Macroeconomics Determinants of Sovereign Credit Ratings: Panel Data Analysis
Ümit YILDIZ
Res. Assist.
Anadolu University
Graduated School of Social Science
Bülent GÜNSOY
Prof. Dr.
Anadolu University
Faculty of Economics
Abstract
In this study, it is investigated that relation between sovereign credit ratings determined by Credit Rating Agencies and macroeconomic variables. Within this framework, 105 countries graded by S&P, one of three well known Credit Rating Agencies, were analyzed by using Econometric Analysis of Panel Data. Ordered Probit and Ordered Log it were used as an econometric estimation technique and the countries were categorized as low and middle income countries and high income countries in the study. According to the estimation results, it was reached a conclusion that, Per Capita Income, Growth Rate, Inflation Rate, Government Debt, Budget Balance, Current Account Balance, are significant macroeconomic variables in terms of determining sovereign credit ratings for low income and middle income countries while they, Per Capita Income, Inflation Rate, Unemployment Rate, Government Debt, are significant macroeconomic variables in terms of determining sovereign credit rating for high income countries. On the other hand, it was reached a systematic relation between credit rating and neither Unemployment Rate for low income and middle income countries nor Growth Rate, Budget Balance, Current Account Balance for high income countries. In the analysis of 105 countries for all the common results of both estimation methods indicate that Per Capita Income, Inflation Rate, Budget Balance and Government Debt are key determinants of Sovereign Credit Ratings.
Keywords: Credit Rating, Sovereign Credit Rating, Standard and Poor’s, Ordered Probit and Logit Models
1.Introduction
The credit rating is briefly defined as an assessment of the creditworthiness of an obligor as an entity or with respect to specific securities, financial instruments and debt obligations. (Schroeter, 2013:379). As a result of the rating process, the determined creditworthiness of the obligor is announced with symbols consisting of a number of letters and numbers that are universal and easy to understand. Although there are a large number of credit rating agencies that conduct ratings around the world, the top three organizations that represent a significant part of the industry are Standard and Poor’s, Moody’s and Fitch. These three organizations, recognized by investors worldwide, have the high impact on market and market participants' decisions. Of the three global players that dominate the credit rating business, Fitch’ share is %15 of the market, while S & P and Moody's share about 80% (Alsakka ve Gwilym, 2010: 2615).
Although the credit rating agencies conduct rating for many different financial instruments, sovereign credit ratings are closely followed by investors. Sovereign credit rating, one of the subheadings of the credit ratings, is short or long term in local currency or foreign currency. In this context, after risk assessment in the light of some economic and political factors, the alpha numerical results announced by the credit rating agencies in terms of long-term foreign currency are called Sovereign Credit Rating. The sovereign credit ratings announced for a country significantly affect the economic stability of that country during and after it is announced. One of the recent debates in the world economy, especially in the last decade, is whether sovereign credit ratings are realistically determined.
A large number of economists and authorities claim that the sovereign credit ratings announced do not reflect the facts. According to these, there is no meaningful relationship between the sovereign credit ratings and the economic performance of the country, and credit rating agencies are 'arbitrary' or even 'malicious' when their grades are determined. It is a concrete example of this opinion that the European Union and US governments file a lawsuit against credit rating agencies and conduct a number of legal arrangements because they are in the wrong credit assessment about themselves during the global financial crisis that started in 2007. In this study, it is analyzed that macroeconomic determinants of sovereign credit rating determined by Credit Rating Agencies. Besides the introduction section, the study consists of a total of five chapters, together with literature, methodology, findings and conclusions.
1.Literature
According to Cantor and Packer (1996), six economic variables play a key role in determining sovereign credit ratings which is announced by S&P and Moody’s. These variables are per capita income, GDP growth, inflation, external debt, level of economic development and default history. On the other hand, in the study that the cross-sectional data of 49 countries were analyzed by the multiple regression method, no systematic relationship was found between the ratings and fiscal or current deficits. According to Mulder and Perelli (2001), the ratio of investments to GDP, the ratio of total debt to exports, output growth, fiscal balance, rescheduling history and inflation are important determinants of the variation in ratings. In the study, panel data from 1992 to 1997 of 25 developing countries rated by S&P and Moody's are analyzed. Afonso (2002) concluded similar results with Cantor and Packer (1996) in his study using the least squares method with cross-sectional data from 81 countries. (29 developed countries, 52 developing countries). In the study, it was concluded that there are six determinants of sovereign credit rating. These variables are GDP per capita, external debt, level of economic development, default history, real growth rate and inflation rate.
Rowland (2004) estimated the economic variables that determine the sovereign credit ratings and creditworthiness by using the least squares method with the help of data from 49 developing countries rated B- and higher. According to Rowland, GDP per capita, GDP growth rate, inflation rate, debt ratios (debt/GDP and debt/exports), debt service ratio (debt service/GDP), international reserves and openness of the economy (export/GDP) are determinants of credit rating and creditworthiness. Bissoondoyal-Bheenick (2005) analyzed measurable determinants of sovereign credit ratings for 95 countries rated by of Moody's and Standard and Poor's. In the study it is stated that the current economic and financial indicators are insufficient to explain the credit ratings. It is also stated that the relationship between economic variables and sovereign credit ratings vary for each grading level. According to the author, economic variables do not have same importance for high rated countries with a long financial stability compared with low rated countries currently undergoing structural change. Mellios and Paget- Blanc (2006) analyzed cross-sectional data of 86 countries rated by S & P, Moody's and Fitch by using linear regression and ordered logit models. They concluded that the following six factors have the highest effect on sovereign credit ratings in the study: Per capita income, government income, real exchange rate changes, inflation rate and default history and corruption index. Afonso, Gomes ve Rother (2011) analyzed the short-and-long term determinants of sovereign ratings from three main rating agencies, for the period 1995-2005 by using linear and ordered response models. They conclude that change in GDP per capita, GDP growth, government debt, and governement balance have impact on sovereign credit ratings in short-term while government effectiveness, external debt, foreign reserves and default history are long-term determinants.
Erdem and Varlı (2014) investigated the effects of macroeconomic variables on sovereign credit ratings in emerging markets.In the study panel data of countires rated by S&P are analyzed by using pooled OLS, fixed effecets, random effects and ordered probit models. According to study budget balance/GDP, GDP per capita, governance indicators and reserves/GDP most relevant factors with sovereign credit ratings. Chee, Fah and Nassir (2015) analyzed the sovereign credit ratings of 53 countries for the period January 2000-December 2011. Qualitative variables such as default history, economic development and economic freedom, as well as a number of macroeconomic variables, have been included in the study. They conclude that the effects of macroeconomic variables on sovereign credit ratings are similar with results of previous works. Also it is emphasized that the economic freedom variable which has vital importance in determining of sovereign credit ratings has been overlooked by previous works. Reusens and Croux (2017) compared the the importance determinants of sovereign credit ratings of 90 countries before and after the 2009 European Debt Crisis. In the study covering the period 2002-2015, ordered probit model was preferred.
Results of the study show that after the start of European Debt Crises, importance of financial balance, economic development and external debt increased significantly. In addition, the study shows that the importance of GDP growth increased for highly indebted countries while government debt became much more important for countires with low growth rate.
1.Methodology
In this section, data set and econometric model used in the study are explained. In this context, firstly the process of collecting the data belonging to the variables and afterwards the process of analyzing the data are explained. Data
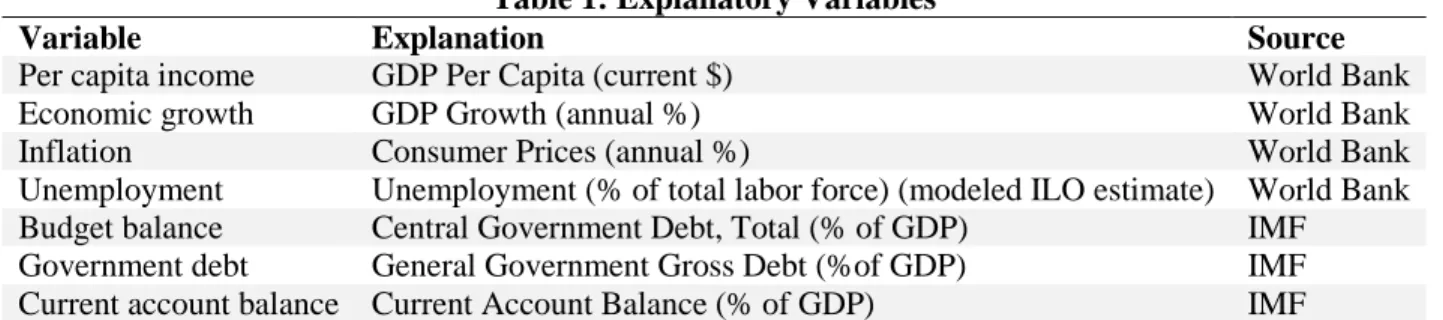
In this study, macroeconomic determinants of sovereign credit ratings determined by Standard and Poor's, one of the three largest rating agencies, are analyzed. S&P is currently determining a credit rating for 133 countries. However, because of problems encountered in reaching data of macroeconomic variables from a number of countries, particularly those in the lower and middle income groups, 105 of these countries were included in the study. These 105 countries were classified as two groups under the titles of low1 and middle income economies2 (60 countries) and high income economies3 (45 countries) and analyzed separately. The explanatory variables of the model were determined by following the literature and considering the variables followed by the S&P rating agency. Thus per capita income, economic growth, inflation, unemployment, budget balance, government debt and current account balance were selected as macroeconomic variables that measure the effects on sovereign credit ratings. Table 1 shows the explanations of the macroeconomic variables using in analysis and the sources of the data belonging to the variables.
Table 1: Explanatory Variables
Variable Explanation Source
Per capita income GDP Per Capita (current $) World Bank
Economic growth GDP Growth (annual %) World Bank
Inflation Consumer Prices (annual %) World Bank
Unemployment Unemployment (% of total labor force) (modeled ILO estimate) World Bank
Budget balance Central Government Debt, Total (% of GDP) IMF
Government debt General Government Gross Debt (%of GDP) IMF
Current account balance Current Account Balance (% of GDP) IMF
In the study, panel data of sovereign credit ratings and seven explanatory variables for the period 2003-2012 are analyzed. The data of per capita income, growth, inflation and unemployment are obtained from the World Bank Database, while the data belonging to the variables of the budget balance, the government debt and the current account balance are obtain from the International Monetary Fund Database. In addition Stata 12 and Eviews 8 programs are used in the analysis.
Panel Data Analysis
Panel data econometric techniques are used in this study. Ordered Probit and Ordered Logit estimation methods are preferred as econometric techniques. The reason for selecting these models in the study is that the dependent variable of the model consists of ordered whole numbers. In converting sovereign credit ratings into ordered whole numbers, the following linear transformations table has been used.
Table 2. Linear Transformations Table
S&P AAA AA+ AA AA- A+ …… CCC CCC- CC D
Fitch AAA AA+ AA AA- A+ …… CCC CCC- CC D
1Burkina Faso, Cambodia, Kenya, Mozambique, Uganda
2Albania, Angola, Argentina, Azerbaijan, Belarus, Bolivia, Bosnia and Herzegovina, Botswana, Brazil, Bulgaria, Cameroon,
Cape Verde Islands, China, Colombia, Costa Rica, Dominican Republic, Ecuador, Egypt, El Salvador, Fiji, Gabon, Ghana, Guatemala, Georgia, Honduras, Hungary, India, Indonesia, Jamaica, Jordan, Kazakhstan, Lebanon, Macedonia, Malaysia, Mexico, Mongolia, Montenegro, Morocco, Nigeria, Pakistan, Panama, Papua New Guinea, Paraguay, Peru, Philippines, Romania, Senegal, Serbia, South Africa, Sri Lanka, Surinam, Thailand, Turkey, Ukraine, Vietnam
3Austria, Austria, Bahamas, Bahrain, Belgium, Canada, Croatia, Cyprus, Czech Republic, Denmark, Estonia, Finland,
France, Germany, Greece, Hong Kong, Ireland, Israel, Italy, Iceland, Japan, Kuwait, Latvia, Lithuania, Luxembourg, Malta, Netherlands, New Zealand, Norway, Oman, Poland, Portugal, Qatar, Russian Federation, Saudi Arabia, Singapore, Slovakia, Slovenia, South Korea, Spain, Sweden, Switzerland, Uruguay, United Kingdom, USA
Moody’s Aaa Aa1 Aa2 Aa3 A1 …… Caa2 Caa3 Ca C
21 20 19 18 17 4 3 2 1
Source: Afonso, Gomes & Rother, 2007:34
Credit grades in the study are analyzed by transforming according to this scale which is also used in many studies in the literature. The credit rating of each country is based on the sovereign credit rating at the end of the year (excluding positive or negative outlook).
Ordered Probit – Ordered Logit Models
Ordered Probit and Ordered Logit models are often used as estimation methods in studies in which the dependent variable is composed of ordered whole numbers. This model is built around a latent regression in a similar manner as the binomial probit model (Greene, 2003: 736). The following assumption shows the relationship between dependent variable 'y' and unobserved dependent variable 'y *'
y* = x′β + ε y = 0; y* ≤0 ise = 1; 0 < y* ≤ µ1 = 2; µ1 < y * ≤ µ2 … = J; µj-1 < y *
y*: unobserved independent variable x : explonatory variables
ε : error term (normally distributed/logistic distributed) µ : cut points(threshold parameters)
In the model, y* is the unobserved dependent variable, x is the explanatory variable vector, and ε is the error term. It is assume that the error term is normally distributed in the ordered probit model while it is assume that the ordered logit model has logistic distribution. The number of threshold parameters depends on the number of values that the dependent variable takes. For example, if 'y' takes values 0, 1 and 2, there are two threshold parameters (μ1 and μ2) in the model (Wooldridge, 2002: 505). Under the assumption of normal distribution, the probabilities for Ordered Probit Model and under the assumption of logistic distribution, the probabilities for Ordered Logit Model are formulated as (Greene, 2003: 737):
P(y = 0 I x ) = Φ (-x′ β)
P(y = 1 I x ) = Φ (µ1 - x′ β) - Φ (-x′ β)
P(y = 2 I x ) = Φ (µ2 - x′ β) - Φ (µ1 - x′ β)
…
P(y = j I x ) = 1 - Φ (µj-1 - x′ β)
Φ: It differs according to the assumption made for the distribution of the error term. It represents the normal distribution for the ordered probit model while it shows the logistic distribution for the ordered logit model. Estimating parameters do not show marginal effects in ordered probit and ordered logit methods like binary choice models. Therefore, it is necessary to take derivative to probability function designed for ordered probit and logit models with respect to independent variables for marginal effects. For example, for the three probabilities (0, 1 or 2), the marginal effects of the changes in regressors are as follows (Greene, 2003: 738):
∂ Prob (y = 0 I x ) / ∂x = - Φ (x′ β) β
∂ Prob (y = 1 I x ) / ∂x = [Φ (-x′ β) – Φ (µ - x′ β) ] β ∂ Prob (y = 2 I x ) / ∂x = Φ (µ - x′ β) β
Econometric Model
Binary choice models form basis of multinomial choice models such as ordered probit and ordered logit models. The dependent variable take two value (0 or 1) in binary choice models. But in many economic situations, the choice may be more than two. These may be unordered alternatives like the preference of a mode of transportation such as bus, car or train, or an occupational choise such as lawyer, teacher. Also these may be ordered alternatives like bond ratings or response to a survey (Baltagi, 2008:339). Sovereign credit ratings also consist of alternatives that contain many economic situations. For this reason, ordered probit and ordered logit models, which are ordered response models, have been used in the analysis. Macroeconomic variables selected as the determinant of sovereign credit ratings and the econometric model designed for panel data is as follows: Rit = β1 PCGDPit + β2 Git + β3 Iit +β4 Uit + β5 BBit + β6 GDit + β7 CABit + uit
y* = x′β + ε yit = 0; y* ≤0 = (D) 1 ; 0 < y* ≤ µ1 = (CC) 2 ; µ1 < y * ≤ µ2 … = (AA+) 20 ; µ19 < y * ≤ µ20 = (AAA) 21 ; µ20 < y *
1. Results
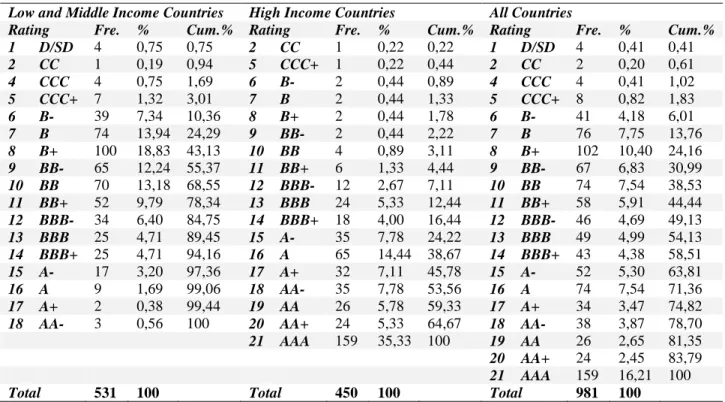
In this part of the study, the relationship sovereign credit ratings and macroeconomic variables is evaluated in terms of ordered probit/logit estimation results. However, it is useful to provide information on the frequency of sovereign credit ratings before this assessment. Table 3, prepared for this purpose, shows the frequency distributions of sovereign credit ratings of the countries rated by the S & P and subject to the analysis.
Table 3. Frequency Table
Low and Middle Income Countries High Income Countries All Countries
Rating Fre. % Cum.% Rating Fre. % Cum.% Rating Fre. % Cum.% 1 D/SD 4 0,75 0,75 2 CC 1 0,22 0,22 1 D/SD 4 0,41 0,41 2 CC 1 0,19 0,94 5 CCC+ 1 0,22 0,44 2 CC 2 0,20 0,61 4 CCC 4 0,75 1,69 6 B- 2 0,44 0,89 4 CCC 4 0,41 1,02 5 CCC+ 7 1,32 3,01 7 B 2 0,44 1,33 5 CCC+ 8 0,82 1,83 6 B- 39 7,34 10,36 8 B+ 2 0,44 1,78 6 B- 41 4,18 6,01 7 B 74 13,94 24,29 9 BB- 2 0,44 2,22 7 B 76 7,75 13,76 8 B+ 100 18,83 43,13 10 BB 4 0,89 3,11 8 B+ 102 10,40 24,16 9 BB- 65 12,24 55,37 11 BB+ 6 1,33 4,44 9 BB- 67 6,83 30,99 10 BB 70 13,18 68,55 12 BBB- 12 2,67 7,11 10 BB 74 7,54 38,53 11 BB+ 52 9,79 78,34 13 BBB 24 5,33 12,44 11 BB+ 58 5,91 44,44 12 BBB- 34 6,40 84,75 14 BBB+ 18 4,00 16,44 12 BBB- 46 4,69 49,13 13 BBB 25 4,71 89,45 15 A- 35 7,78 24,22 13 BBB 49 4,99 54,13 14 BBB+ 25 4,71 94,16 16 A 65 14,44 38,67 14 BBB+ 43 4,38 58,51 15 A- 17 3,20 97,36 17 A+ 32 7,11 45,78 15 A- 52 5,30 63,81 16 A 9 1,69 99,06 18 AA- 35 7,78 53,56 16 A 74 7,54 71,36 17 A+ 2 0,38 99,44 19 AA 26 5,78 59,33 17 A+ 34 3,47 74,82
18 AA- 3 0,56 100 20 AA+ 24 5,33 64,67 18 AA- 38 3,87 78,70
21 AAA 159 35,33 100 19 AA 26 2,65 81,35
20 AA+ 24 2,45 83,79
21 AAA 159 16,21 100
Total 531 100 Total 450 100 Total 981 100
Firstly, as can be seen in table 3, there are a total of 531 observations covering the ten-year period of 60 low and middle-income countries. Also, it is seen that a significant part of the ratings are accumulated in B, B +, BB-, BB and BB + for low and middle income countries. And the cumulative percentage at BB + is 78.34%. In other words, a considerable number of low and middle income countries have not reached the investment grade level BBB- and above BBB-. For the group of high-income countries, the first thing to notice is that credit ratings at AAA level have a significant share in total frequencies. Within a total of 450 observations of 45 countries, AAA is in the first place with 159 observations. The percentage of AAA that represents the lowest risk level is 35.33%. This shows how effective the level of economic development is in assessing the country's risk and in determining sovereign credit ratings.
Table 3 also shows frequency distributions for credit ratings for all countries in the study. As you can see, the AAA credit rating has the highest percentage for the 105 countries analyzed. Also you can see that ,the AAA credit rating constitutes approximately 16% of the total frequencies with 159 observations. This shows that the sovereign credit ratings of high-income countries rated by S & P are stable at high levels for many years, unlike the countries in the low and middle income groups.
As can be seen from Table 3, another credit rating level, which has a large number of observations, is the B+ level. When the frequencies of this rating level are examined, it is seen that the total number of observations of B+ is in the second place after AAA. This credit level has about 10% of the total observations with 102 observations.
On the other hand, frequency percentages of other credit ratings have more homogeneous distribution. Another important point that should be mentioned for all countries is related to the cumulative percentages of frequency distributions. When the cumulative percentages are examined, it is seen that approximately 45% of the total frequencies are composed of sovereign credit ratings are the speculative levels BB + and below BB +.Nearly 55% of the credit ratings consist of above BBB-, which represents the investable level at which the likelihood of being affected by speculative movements is extremely low. Cumulative percentages of credit ratings below the B- level are too low to be ignored. After mentioning to the frequency distributions for credit rating, in this part of the study, correlations between explanatory variables and ordered probit/logit estimation results are evaluated respectively. Firstly, it would be useful to examine the correlations between explanatory variables used in the model before the ordered probit/logit estimation results. Table 4, prepared for this purpose, shows the correlation matrix of explanatory variables for each country group. As you can see from Table 4, there are acceptable correlations between the variables used in the study. Therefore, there is no objection to using the data of these variables in the analysis.
Table 4. Correlation Matrix of Explanatory Variables
Low and Middle Income Countries
PCGDP Growth Inflation Unemployment Budget Bal. Gov. Debt Cur.Acc.Bal.
PCGDP 1,0000 Growth -0,2220* 1,0000 Inflation -0,0930 0,0930 1,0000 Unemployment 0,2074* -0,1837* -0,0457 1,0000 Budget Bal. 0,0332 0,2190* 0,0151 0,0334 1,0000 Gov. Debt 0,0313 -0,1354* 0,0236 -0,0118 -0,4774* 1,0000
Cur. Acc. Bal. 0,0609 0,0815 -0,0022 -0,1241* 0,3840* -0,1813* 1,0000
High Income Countries
PCGDP Growth Inflation Unemployment Budget Bal. Gov. Debt Cur.Acc.Bal.
PCGDP 1,0000 Growth -0,0649 1,0000 Inflation -0,1902* 0,2311* 1,0000 Unemployment -0,4576* -0,2766* -0,0755 1,0000 Budget Bal. 0,1779* 0,4219* 0,1726* -0,4718* 1,0000 Gov. Debt 0,0508 -0,2954* -0,2582* 0,1259* -0,4255* 1,0000
Cur. Acc. Bal. 0,3359* 0,2122* -0,0606 -0,3873* 0,6920* -0,1197 1,0000
All Countries
PCGDP Growth Inflation Unemployment Budget Bal. Gov. Debt Cur.Acc.Bal.
PCGDP 1,0000 Growth -0,2489* 1,0000 Inflation -0,3014* 0,1987* 1,0000 Unemployment -0,2435* -0,1463* 0,0104 1,0000 Budget Bal. 0,2016* 0,2751* 0,0046 -0,1800* 1,0000 Gov. Debt 0,1172* -0,2448* -0,1017* 0,0137 -0,4176* 1,0000
Cur. Acc. Bal. 0,3389* 0,0644 -0,0965* -0,2348* 0,5626* -0,1122* 1,0000 *p < 0.01
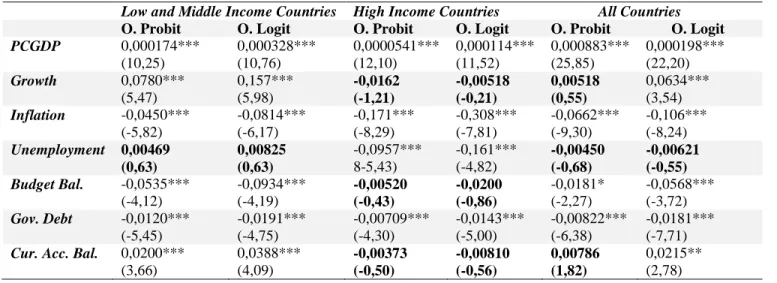
The estimation results show the relationship between sovereign credit ratings and macroeconomic variables are shown for three country groups in Table 5.
Table 5. Ordered Prob it / Log it Estimation Results
Low and Middle Income Countries High Income Countries All Countries
O. Probit O. Logit O. Probit O. Logit O. Probit O. Logit
PCGDP 0,000174*** (10,25) 0,000328*** (10,76) 0,0000541*** (12,10) 0,000114*** (11,52) 0,000883*** (25,85) 0,000198*** (22,20) Growth 0,0780*** (5,47) 0,157*** (5,98) -0,0162 (-1,21) -0,00518 (-0,21) 0,00518 (0,55) 0,0634*** (3,54) Inflation -0,0450*** (-5,82) -0,0814*** (-6,17) -0,171*** (-8,29) -0,308*** (-7,81) -0,0662*** (-9,30) -0,106*** (-8,24) Unemployment 0,00469 (0,63) 0,00825 (0,63) -0,0957*** 8-5,43) -0,161*** (-4,82) -0,00450 (-0,68) -0,00621 (-0,55) Budget Bal. -0,0535*** (-4,12) -0,0934*** (-4,19) -0,00520 (-0,43) -0,0200 (-0,86) -0,0181* (-2,27) -0,0568*** (-3,72) Gov. Debt -0,0120*** (-5,45) -0,0191*** (-4,75) -0,00709*** (-4,30) -0,0143*** (-5,00) -0,00822*** (-6,38) -0,0181*** (-7,71)
Cur. Acc. Bal. 0,0200*** (3,66) 0,0388*** (4,09) -0,00373 (-0,50) -0,00810 (-0,56) 0,00786 (1,82) 0,0215** (2,78) The t statistics are in parentheses
* p<0.05, ** p<0.01, *** p<0.001
As a result of the analysis for the low and middle income countries, it is concluded that the variables such as per capita income, growth rate, inflation, budget balance, government debt and current account balance have significant effects on determining soverign credit rating. However, there is no systematically relation between unemployment rate and sovereign credit rating. According to estimation results for the high income countries, it can be seen that the growth rate, budget balance/GDP and current account balance/GDP is not statistically significant in determining sovereign credit rating. On the other hand, there are significant relationship between sovereign credit rating and per capita income, inflation, unemployment, government debt. In this study, we found that the macroeconomic factors are relatively important for less developed and developing countries rather than the developed countries for determining the country's risk. In particular, the lack of stable economic structures of the less developed and developing countries lead to be unsteady the basic economic indicators of the these countries. And this situation increases the impact of each macroeconomic variable on the sovereign credit ratings. For this reason, macroeconomic variables play an important role in determining the country's risk called the sovereign credit rating, in less developed and developing countries. Another result founded in study that, the estimation results for developed countries differ in many points compared to the developing countries. Macroeconomic indicators of developed countries are more stable and there are no significant differences between the per capita incomes of these countries. These limits the economic factors that determine credit ratings. For this reason, there is a significant relationship between sovereign credit ratings and only four of seven selected macroeconomics varibale. For this reason, there is a significant relationship between sovereign credit ratings and only four (per capita income, inflation, and unemployment and government debt) of selected macroeconomics varibales. On the other hand, the growth rates of developed countries are very low. In addition, data of budget balance and current account balance variables are similar in these countries. Hence, there is no significant statistical relationship between sovereign credit ratings and growth, budget balance, current account balance in these countries. As a result of the analysis for all 105 countries rated by the S&P, it is seen that there are some statistical differences related the estimation method used. In spite of these different results, it is understood that per capita income, inflation rate budget balance and government debt are the main determinants of sovereign credit ratings. The variables of growth rate and current account balance are statistically significant according to ordered logit models. But significance of these variables is not acceptable according to ordered probit model. What is more there is no systematic relationship between the unemployment rate and sovereign credit ratings according to both methods.
5. Conclusion
The free movement of the capital, which emerged as a result of the globalization, created a new need called 'ratings'. This need is met by independent organizations called credit rating agencies in the world. Furthermore, sovereign credit ratings determined by credit rating agencies have become a significant part of the current economic system.
In this context, this study focuses on sovereign credit ratings and analyzes the impact of macroeconomic variables in determining ratings. Under the assumption that the all countries are not assessed with the same criteria when analyzing, the countries are classified and analyzed in three country groups in this study. According to the results of the analysis, all the macroeconomic variables used in the study, except for the unemployment rates which are very similar in the low and middle income countries, have significant effects on the sovereign credit rating.In the high income countries, this significant relationship is seen to be valid for the variables of per capita income, inflation, unemployment and government debt. These results also give an idea of which macroeconomic criteria should be prioritized by the countries that are aiming for improvement in the credit ratings. Finally we can say that the per capita income, inflation, budget balance and the total government debt are the main determinants of the credit ratings of all countries, although the estimation results show a number of differences. Accordingly, the income levels of the households, the generel level of prices and total debt of public sector play a key role in investing in a country. Thus, the countries that want to attract capital, should carry out economical policies aimed at these macroeconomic variables. As a result, we can say that economic factors, especially macroeconomic variables, are influential and vital in determining the credibility of a country, while the influence of political factors on country risk perception is quite important.
References
Afonso, A. (2002). Understanding the determinants of government debt rating: evidence for the two leading agencies. Department of Economics And Research Center On The Portuguese Economy (CISEP), Lisbon Afonso, A., Gomes, P. & Rother, P. (2007). What hides behind sovereign debt ratings?, European Central Bank
Working Paper Series, No:711
Afonso, A., Gomes, P. & Rother, P. (2011). Short and long-run determinants of sovereign debt credit ratings. International Journal of Finance and Economics, 16 (19), 1-15
Alsakka, R. & Gwilym, O. (2010). Leads and lags in soverign credit ratings. Journal of Banking & Finance, 34, 2614-2626
Baltagi, B. H. (2008). Econometrics. Germany: Springer
Bissoondoyal-Bheenick, E. (2005). An analysis of the determinants of sovereign ratings. Global Finance Journal, 15, 251-280
Cantor, R. & Packer, F. (1996). Determinants of ımpact of sovereign credit. FRNBY Economic Policy Review, 2, 37-53
Chee, S.W., Fah, C.F. & Nassir, A.M. (2015). Macroeconomics determinants of sovereign credit ratings. International Business Research, 8(2), 42
Erdem, O & Varlı, Y. (2014). Understanding the sovereign credit rating of emerging markets. Emerging Market Review, 20, 42-57
Greene, W.H. (2003). Econometric Analysis. New Jersey: Pearson Education
Mellios, C. & Paget-Blanc, E. (2006). Which factors determine sovereign credit ratings?. The European Journal of Finance, 12 (4), 361-377
Mulder, C. & Perrelli, R. (2001). Foreign credit ratings for emerging market economies. IMF Working Paper No:191
Reusens, P.& Croux, C. (2017). Sovereign credit rating determinants: A comparison before and after the European debt crisis. Journal of Banking & Finance, 77, 108-121
Rowland, P. (2004). Determinants of spread, credit ratings and creditworthiness for emerging market sovereign debt: a follow-up study using pooled data analysis. Banco de la Republica de Colombia, Borradores de Economia, 295
Schroeter, U. G. (2013). Handbook of Key Global Financial Markets, Institutions, and Infrastructure. 379-390 Wooldridge, J.M. (2002). Econometric analysis of cross section and panel data. London: MIT Press