ÇUKUROVA ÜNİVERSİTESİ TIP FAKÜLTESİ DOI: 10.17826/cumj.779429
Yazışma Adresi/Address for Correspondence: Dr. Derya Kanza Gül, Medipol University School of Medicine, Istanbul, Turkey. E-mail:[email protected]
ARAŞTIRMA / RESEARCH
Can uterocervical angle and cervical length determine the success of
induction of labor in late-term and post-term nulliparous pregnant
women?
Uteroservikal açı ve servikal uzunluk geç term-postterm nullipar gebelerde doğum
indüksiyonunun başarısını belirleyebilir mi?
Derya Kanza Gül
11Medipol University School of Medicine, Istanbul, Turkey.
Cukurova Medical Journal 2020;45(4):1634-1643
Abstract Öz
Purpose: The aim og this study was to evaluate the role of
uterocervical angle (UCA) and cervical length (CL) in predicting the success of induction of labor before induction was performed in late term and post-term pregnancies.
Materials and Methods: This retrospective study was
carried out between January 2018 and April 2020, in Medipol University based on the data about 260 late-term and post-term nulliparous pregnant women who underwent induction of labor. UCA and CL values in pregnant women were assessed just before the induction was performed. Our study population was assigned into two groups: successful IoL group (group1) and failed (group 2) IoL group. The primary outcome of the study is the effectiveness of UCA and CL in predicting successful induction of labor (latent phase duration ≤720 min).
Results: While the mean UCA was 102.17 ± 4.26 degree
in the successful labor induction group, it was 94.25 ± 7.141 degree in the unsuccessful group. While the mean CL was 27.85 ± 3.5 mm in the successful labor induction group, it was found as 31.73 ± 2.71 mm in the unsuccessful group. There was a statistically significant difference between the groups in terms of mean values for the CL and UCA. Both the UCA and the CLsignificantly predicted the duration of the prolonged latent phase.
Conclusions: This study indicated that both the UCA and
CL measurements had a significant predictive value in predicting successful induction of labor and normal birth in late term and post-term nulliparous pregnant women.
Amaç: Bu çalışmada, geç ve post term gebeliklerde
indüksiyon yapılmadan önce doğum indüksiyonunun başarısını öngörmede uteroservikal açının (USA) ve servikal uzunluğun (SU) rolünün araştırılması amaçlanmıştır.
Gereç ve Yöntem: Bu retrospektif çalışma Ocak
2018-Nisan 2020 tarihleri arasında Medipol Üniversitesi Nisa Hastanesinde doğum indüksiyonu uygulanmış 260 nullipar geçterm ve postterm gebeye ait bilgiler kullanılarak yapılmıştır. Gebelerde indüksiyondan hemen önce uteroservikal açı ve servikal uzunluk değerleri değerlendirilmiştir. Çalışma populasyonumuz, başarılı (grup 1) ve başarısız (grup 2) doğum indüksiyonuna göre 2 grup olarak gruplandırılmıştır Birincil sonuç, doğum indüksiyonuna başarısını öngörmekteki etkinliktir. (latent faz ≤720 dk.).
Bulgular: Başarılı doğum induksiyon grubunda
uteroservikal açı ortalaması 102,17 ± 4,26 derece iken başarısız grupta 94,25 ± 7,141 derece olarak saptanmıştır. Başarılı doğum induksiyon grubunda ortalama servikal uzunluk 27,85 ± 3,5 mm iken başarısız grupta 31,73 ± 2,71 mm olarak saptanmıştır. Gruplara göre serviks uzunluk ortalamaları ve uteroservikal açı ortalaması arasında istatistiksel olarak anlamlı bir farklılık saptanmıştır. USA ve SU) uzamış latent faz süresi önemli ölçüde belirleyicidir.
Sonuç: Bu çalışma, geç term ve postterm nullipar
gebelerde hem uteroservikal açı hem de servikal uzunluk ölçümlerinin; başarılı doğum indüksiyonu ve normal doğumu tahmin etmede anlamlı belirleyiciliğe sahip olduğunu göstermiştir.
Keywords:. Cervical length, induction of labor,
INTRODUCTION
The normal gestation period in humans ranges
between 37 and 42 weeks. While the gestation that
continues after the 42
ndgestational week (294 days) is
called post-term pregnancy, gestation ranging
between 41 0/7 weeks and 41 6/7 weeks is called late
term pregnancy. Although there may be differences
between societies, the rate of post-term pregnancies
varies between 5% and 15% .
1With the correct
determination of the gestational age, this rate
decreases to 5%. Since late-term and post-term
pregnancies are associated with an increased risk of
perinatal morbidity and mortality, correct timing is
very important in the induction of labor. According
to available epidemiological evidence, induction of
labor can be considered between the 41 0/7 weeks of
gestation and 42 0/7 weeks of gestation, but
induction of labor is strongly recommended after the
42 0/7 weeks of gestation and up to 42 6/7 weeks of
gestation
1.
Induction of labor (IoL) is a common practice and is
performed in approximately 20-30% of births
2.
Several risk factors such as low Bishop scores (BS
<6), nulliparity, gestational age > 41 weeks, fetal
macrosomia and maternal obesity lead to the failed
IoL. The level of cervical maturation before the IoL
is the most important factor for a successful birth
3,4,5.
Bishop score is the cervical scoring method used to
determine the success of the birth process. The
Bishop score addresses the condition, adequacy, and
position of the cervix enlargement and thinning.
Evaluation of the cervix prior to the induction with
transvaginal ultrasonography (TVUSG) can be
preferred to the traditional Bishop score, because it is
pratical and easy to learn
6.
In addition, the initial
changes in the cervix, cervical length and cervical
angle which cannot be detected during manual
examination can be evaluated with TVUSG.
The UCA is defined as the angle between the
endocervical canal and the anterior uterine wall. The
force exerted by the uterus on the cervix changes
according to the degree of UCA. While the force
applied by the uterus to the cervix cannot open the
narrow angle endocervical canal, it can easily open the
wide angle endocervical canal. Studies in the literature
report that as the UCA increases so does the risk of
preterm labor .
7,8,9In addition, the rate of normal
births is higher in term pregnancies with large
UCA
10,11.
The review of the literature revealed that the
effectiveness of the UCA and cervical length on the
IoL in late term and post-term pregnancies was not
investigated. Therefore, we aimed to determine the
effectiveness of uterocervical angle (UCA) and
cervical length (CL) in predicting successful IoL in
late term and post-term pregnancies in which normal
delivery rates are low.
MATERIALS AND METHODS
This project was carried out as a retrospective study
at Medipol University Nisa Hospital between January
2018 and April 2020 using the digital database of
Gynecology and Obstetrics clinic of the same
hospital. Ethics committee approval and hospital
institution approval were obtained prior to the study
(date: April 16, 2020 and reference number:
10840098-604.01.01-E.14177).
Sample
Between January 2018 and April 2020, 700 pregnant
women received induction of labor. Of these
pregnant women, 260 pregnant women consisted of
patients with late term and postterm periods. Before
the induction of labor; in order to investigate the role
of UCA and CL, measured as a routine hospital
protocol, in predicting successful IoL in late term and
post-term pregnancies, the data available in the
patient files were screened, and 260 patients were
included in the study. Two groups: group 1 (with
normal latent phase duration: ≤720 minutes) and
group 2 (with extended latent phase duration :>720
minutes) were included in the study.
Inclusion criteria were being a primipara, having a
gestational age of 41 0/7 weeks to 42 6/7 weeks, the
fetus in the vertex position, singleton pregnancy,
labor not initiating spontaneously, unfavorable cervix
(Bishop score: <6). Exclusion criteria: were previous
uterine and cervical surgery, cephalopelvic
disproportion, fetal congenital abnormalities and
contraindications to vaginal delivery (e.g., ablation
placenta, placenta previa).
Procedure
Both Bishop score and transvaginal ultrasound
examination data about women who met the
inclusion criteria were obtained from the hospital
database. Before the IoL, all the examinations were
carried out by one obstetrician (Derya Kanza Gül).
Cervical length was defined as a single straight line
from the internal os to the external os. The UCA was
defined as the angle between the anterior uterine wall
and the endocervical canal. The ultasound
measurements were performed two times, and the
mean values obtained from these two measurements
were included in the analysis. Ultrasonographic
markers were performed using an 9.5 MHz
transvaginal transducer.
The IoL was started by placing a vaginal
prostaglandin E2 (PGE2) in the posterior fornix of
vagina. This procedure was continued until BISHOP
score> 7 or for up to 24 hours. Fetal heart was
monitored 1 hour after dinoprostone insertion and
then every 4 hours. vaginal dinoprostone removed in
case of fetal distress, uterine tachystole, or successful
cervical maturation. Participants who successfully
responded to the IoL and the labor was supported
with oxytocin when it was necessary. The decision to
administer oxytocin was made based on the types of
the uterine contractions. The oxytocin was given
intravenously as a diluted solution. The starting dose
was 5 mU / min. It was then increased to 40 mU /
min every 20 minutes. This study population was
assigned into two groups: successful IoL group and
failed IoL group. Induction of labor was considered
successful if the duration of the latent phase was
<720 min
12and if the cervical dilatation was 4 cm at
the end of the latent phase.
13Data on the
socio-demographic and obstetric characteristics (gestational
age, pre- and post-induction Bishop scores) of the
participants, CL, UCA and newborn were analyzed.
The primary outcome was to determine the degree of
UCA, and CL in patients with successful or
unsuccessful induction of labor.
Statistical analysis
The data were analyzed using the IBM SPSS V23.
Kolmogorov Smirnov test was used to find out
whether the variables were distributed normally. The
Chi-square test, the two independent samples t-test,
Mann-Whitney U test, the paired sample t test, ROC
analysis was used for data. p values <0.05 were
considered statistically significant
RESULTS
Our study population was studied in two groups:
group 1 (with normal latent phase duration: ≤720
minutes) and group 2 (with extended latent phase
duration :>720 minutes). There were no statistically
differences between the groups in terms of mean age,
height averages, BMI, educational status, distribution
of income status, baby’s weight, baby’s height, infant
head circumference, and gestational age (
p>0.050)
(Table 1). However, there were statistically significant
differences between the two groups in terms of mean
values for the CL, UCA, and pre-induction Bishop
score (
p<0.001).
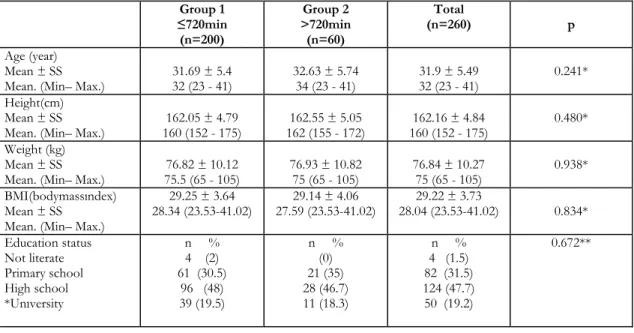
Table 1. Comparison of the demographic characteristics and quantitative variables according to the duration of the latent phase
Group 1 ≤720min (n=200) Group 2 >720min (n=60) Total (n=260) p Age (year) Mean ± SS
Mean. (Min– Max.) 31.69 ± 5.4 32 (23 - 41) 32.63 ± 5.74 34 (23 - 41) 31.9 ± 5.49 32 (23 - 41) 0.241* Height(cm)
Mean ± SS
Mean. (Min– Max.) 160 (152 - 175) 162.05 ± 4.79 162 (155 - 172) 162.55 ± 5.05 160 (152 - 175) 162.16 ± 4.84 0.480* Weight (kg)
Mean ± SS
Mean. (Min– Max.) 75.5 (65 - 105) 76.82 ± 10.12 76.93 ± 10.82 75 (65 - 105) 76.84 ± 10.27 75 (65 - 105) 0.938* BMI(bodymassındex)
Mean ± SS Mean. (Min– Max.)
29.25 ± 3.64 28.34 (23.53-41.02) 27.59 (23.53-41.02) 29.14 ± 4.06 28.04 (23.53-41.02) 29.22 ± 3.73 0.834* Education status Not literate Primary school High school *Unıversity n % 4 (2) 61 (30.5) 96 (48) 39 (19.5) n % (0) 21 (35) 28 (46.7) 11 (18.3) n % 4 (1.5) 82 (31.5) 124 (47.7) 50 (19.2) 0.672**
Income status Revenue lower than expense
Income and expense Income more than expense n % 29 (14.5) 140 (70) 31 (15.5) n % 2 (3.3) 47 (78.3) 11 (18.3) n % 31 (11.9) 187 (71.9) 42 (16.2) 0.06** Baby birth Weight(gram) Mean ± SS
Mean. (Min– Max.) 3355 (295 - 4500) 3322.15 ± 538.94 3400 (2750 - 4000) 3366.5 ± 317.41 3400 (295 - 4500) 3332.38 ± 496.46
0.799***
Baby birth Height (cm) Mean ± SS
Mean. (Min– Max.) 49.4 ± 1.16 49 (48 - 53) 49.52 ± 1.13 50 (48 - 52) 49.42 ± 1.15 49 (48 - 53)
0.473* Infant head
circumferernce (cm)
Mean ± SS Mean. (Min– Max.)
3 4.48 ± 0.5 34 (34 - 35) 34.58 ± 0.5 35 (34 - 35) 35 (34 - 35) 34.5 ± 0.5 0.161*** Gestational age (days) Mean ± SS
Mean. (Min– Max.) 283 (280 - 294) 284.2 ± 3.58 283 (280 - 294) 284.2 ± 3.6 283 (280 - 294) 284.2 ± 3.58
1.000* Cervical length
Mean ± SS
Mean. (Min– Max.) 27.85 ± 3.5 28 (20 - 38) 31.73 ± 2.71 30 (26 - 38) 28,75 ± 3.71 30 (20 - 38) <0.001* Uterocervical angle
Mean ± SS
Mean. (Min– Max.) 102.17 ± 4.26 102 (92 - 112) 494.25 ± 7.14 96 (75 - 110) 100.34 ± 6.06 100 (75 - 112) <0.001* Duration of latent phase
(min) Mean ± SS
Mean. (Min– Max.) 400 (150 - 700) 412 ± 138.5 1200 (750 - 1600) 1174 ± 297.04 450 (150 - 1600) 587.85 ± 371.9
<0.001*
Before induction Bishop score Mean ± SS
Mean. (Min– Max.) 3,16 ± 0,5 3 (2 - 4) 2,2 ± 0,4 2 (2 - 3) 2,93 ± 0,63 3 (2 - 4)
<0.001*
After induction Bishop score
Mean ± SS
Mean. (Min– Max.) 5.33 ± 0.47 5 (5 - 6) 5.33 ± 0.48 5 (5 - 6) 5.33 ± 0.47 5 (5 - 6)
0.962*
*t: independent samples T-Test, ** 𝜒𝜒2: Chi-square test statistics, ***U: Mann-Whitney U test statics
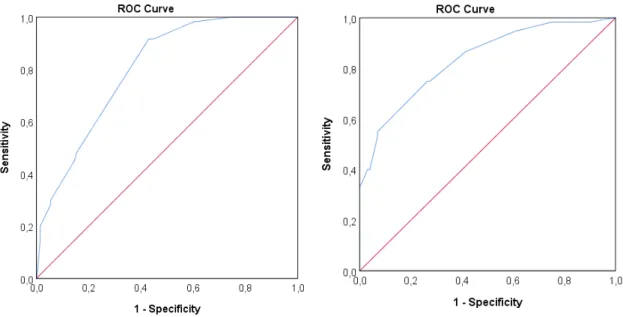
Both anterior UCA (AUC= 0.835,
p<.001) and the
CL (AUC=0.801 (
p<0.001).) predicted prolonged
latent phase (Figures 1 and 2). When the cutoff point
was 98.5 for the uterocervical angle, the sensitivity
and the specificity rates were 75% was 73.5%
respectively. When the cutoff point was 29.5 for the
cervical length, the sensitivity and the specificity rates
were 91.7% and 57% respectively.
The participants were assigned into two subgroups
according to these cutoff points. Some demographic
and clinical characteristics of the groups with and
without high degrees of UCA are given in table 2.
Given cutoff points for the UCA, statistically
differences were determined between the groups in
terms of the mean head circumference values of the
babies, cervical length, pre-induction Bishop score,
duration of the latent phase and normal birth rates.
However, there were no statistically significant
differences between the distributions of the other
variables according to the cutoff points of the cervical
length (
p>0.050).
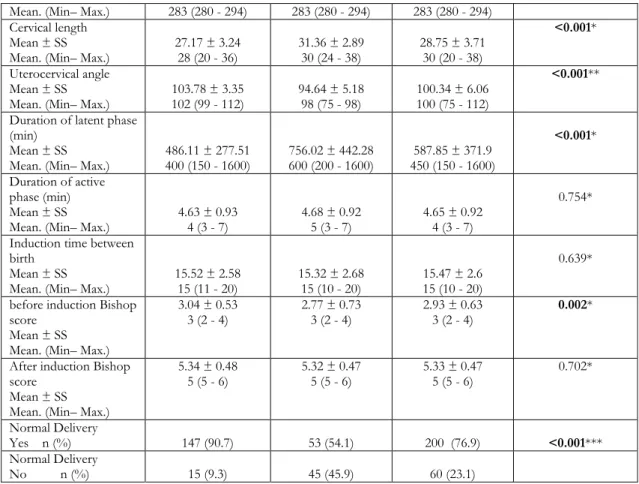
Figure 1. ROC curve for the cervical length when the
duration of the latent phase was ≤720 minutes Fıgure 2. ROC curve for the Uterocervical angle when the duration of the latent phase was ≤720 minutes Table 2. Comparison of the variables according to the cutoff point for the uterocervical angle
Variable UCA>98,5 (n=162) UCA <98,5 (n=98) Total p
Age (year) Mean ± SS
Mean. (Min– Max.) 31.98 ± 5.27 32 (23 - 41) 31.79 ± 5.86 32 (23 - 41) 31.9 ± 5.49 32 (23 - 41)
0.793* Height(cm)
Mean ± SS
Mean. (Min– Max.) 160 (152 - 175) 161.77 ± 4.77 163 (152 - 175) 162.81 ± 4.91 160 (152 - 175) 162.16 ± 4.84 0.095* Weight (kg)
Mean ± SS
Mean. (Min– Max.) 75.5 (65 - 105) 76.92 ± 10.57 75 (65 - 105) 76.71 ± 9.8 76.84 ± 10.27 75 (65 - 105)
0.876* BMI(bodymassındex)
Mean ± SS Mean. (Min– Max.)
29.38 ± 3.75 28.4(23.53– 41.02) 28.97 ± 3.7 27,55 (23.5- 41.02) 29.2 ± 3.73 28,04 (23.53 41.02) 0.386* Baby birth Weight(gram) Mean ± SS
Mean. (Min– Max.) 3400 (2950 -4500) 3300.59 ± 514.71 3400 (2950 - 4500) 3384.95 ± 462.49 3400 (2950 - 4500) 3332.38 ± 496.46
0,187* Baby birth
Height (cm) Mean ± SS
Mean. (Min– Max.) 49.35 ± 1.13 49 (48 - 53) 49.55 ± 1.18 50 (48 - 53) 49.42 ± 1.15 49 (48 - 53)
0.163* Infant head
circumferernce (cm)
Mean ± SS
Mean. (Min– Max.) 34.44 ± 0.5 34 (34 - 35) 35 (34 - 35) 34.6 ± 0.49 35 (34 - 35) 34.5 ± 0.5
0.014*
Gestational age (days)
Mean. (Min– Max.) 283 (280 - 294) 283 (280 - 294) 283 (280 - 294) Cervical length
Mean ± SS
Mean. (Min– Max.) 27.17 ± 3.24 28 (20 - 36) 31.36 ± 2.89 30 (24 - 38) 28.75 ± 3.71 30 (20 - 38)
<0.001*
Uterocervical angle Mean ± SS
Mean. (Min– Max.) 102 (99 - 112) 103.78 ± 3.35 94.64 ± 5.18 98 (75 - 98) 100.34 ± 6.06 100 (75 - 112)
<0.001**
Duration of latent phase (min)
Mean ± SS
Mean. (Min– Max.) 486.11 ± 277.51 400 (150 - 1600) 756.02 ± 442.28 600 (200 - 1600) 450 (150 - 1600) 587.85 ± 371.9
<0.001*
Duration of active phase (min) Mean ± SS
Mean. (Min– Max.) 4.63 ± 0.93 4 (3 - 7) 4.68 ± 0.92 5 (3 - 7) 4.65 ± 0.92 4 (3 - 7)
0.754* Induction time between
birth Mean ± SS
Mean. (Min– Max.) 15.52 ± 2.58 15 (11 - 20) 15.32 ± 2.68 15 (10 - 20) 15.47 ± 2.6 15 (10 - 20)
0.639* before induction Bishop
score Mean ± SS Mean. (Min– Max.)
3.04 ± 0.53
3 (2 - 4) 2.77 ± 0.73 3 (2 - 4) 2.93 ± 0.63 3 (2 - 4) 0.002* After induction Bishop
score Mean ± SS Mean. (Min– Max.)
5.34 ± 0.48 5 (5 - 6) 5.32 ± 0.47 5 (5 - 6) 5.33 ± 0.47 5 (5 - 6) 0.702* Normal Delivery Yes n (%) 147 (90.7) 53 (54.1) 200 (76.9) <0.001*** Normal Delivery No n (%) 15 (9.3) 45 (45.9) 60 (23.1)
*t: independent samples T-Test, **U: Mann-Whitney U test statics, *** 𝜒𝜒2: Chi-square test statistics
The participating pregnant women were assigned to
another two subgroups in terms of their cervical
lengths: women with and without a short cervical
length. Given cutoff points for the cervical length
statistically significant differences were determined
between the two groups in terms of the mean head
circumference values of the babies, cervical length,
uterocervical angle, pre-induction Bishop score,
duration of the latent phase and normal birth rates.
However, there were no statistically significant
differences between the distributions of the other
variables according to the cutoff points of the cervical
length (
p>0.050). (Table 3.)
Table 3. Comparison of the variables according to the cutoff point for the cervical length Variable CL<29.5mm
(n=119) CL>29.5mm (n=141) Total p
Age (year) Mean ± SS
Mean. (Min– Max.) 31.87 ± 5.32 32 (23 - 41) 31.94 ± 5.64 33 (23 - 41) 32 (23 - 41) 31.9 ± 5.49
0.918* Height(cm)
Mean ± SS
Mean. (Min– Max.) 160 (152 - 175) 161.95 ± 4.72 162 (152 - 175) 162.34 ± 4.96 160 (152 - 175) 162.16 ± 4.84 0.518* Weight (kg)
Mean ± SS
Mean. (Min– Max.) 77,76 ± 11,07 77 (65 - 105) 75 (65 - 105) 76,06 ± 9,51 76,84 ± 10,27 75 (65 - 105) 0,184* BMI(bodymassındex)
Mean. (Min– Max.) Baby birth Weight(gram) Mean ± SS
Mean. (Min– Max.) 3328.32 ± 510.04 3400 (295 -4500) 3400 (295 - 4500) 3335.82 ± 486.5 3400 (295 – 4500) 3332.38 ± 496.46 0.898** Baby birth
Height (cm) Mean ± SS
Mean. (Min– Max.) 49.34 ± 1.19 49 (48 - 53) 49.49 ± 1.11 50 (48 - 53) 49.42 ± 1.15 49 (48 - 53)
0.219** Infant head
circumferernce (cm)
Mean ± SS
Mean. (Min– Max.) 34.44 ± 0.5 34 (34 - 35) 34.56 ± 0.5 35 (34 - 35) 35 (34 - 35) 34.5 ± 0.5 0.048* Gestational age
(days) Mean ± SS
Mean. (Min– Max.) 283 (280 - 294) 284.21 ± 3.6 283 (280 - 294) 284.19 ± 3.58 283 (280 - 294) 284.2 ± 3.58 0.967* Cervical length
Mean ± SS
Mean. (Min– Max.) 25.53 ± 2.4 26 (20 - 29) 31.46 ± 2.1 30 (30 - 38) 28.75 ± 3.71 30 (20 - 38) <0.001** Uterocervical angle
Mean ± SS
Mean. (Min– Max.) 104 (96 - 112) 104.19 ± 3.85 98 (75 - 110) 97.09 ± 5.67 100.34 ± 6.06 100 (75 - 112) <0.001* Duration of latent
phase (min) Mean ± SS
Mean. (Min– Max.) 449.92 ± 198.91 400 (150 - 1450) 704.26 ± 438.98 500 (150 - 1600) 450 (150 - 1600) 587.85 ± 371.9 <0.001* Duration of active
phase (min) Mean ± SS
Mean. (Min– Max.) 4.68 ± 0.93 4 (3 - 7) 4.59 ± 0.91 4 (3 - 7) 4.64 ± 0.92 4 (3 - 7)
0.491* Induction time between
birth Mean ± SS
Mean. (Min– Max.) 15.21 ± 2.32 15 (10 - 20) 15.64 ± 2.53 15 (12 - 20) 15.47 ± 2.6 15 (10 - 20) 0.411* before induction Bishop
score Mean ± SS
Mean. (Min– Max.) 3.08 ± 0.5 3 (2 - 4) 2.81 ± 0.7 3 (2 - 4) 2.93 ± 0.63 3 (2 - 4) <0.001* After induction Bishop
score Mean ± SS
Mean. (Min– Max.) 5.29 ± 0.46 5 (5 - 6) 5.36 ± 0.48 5 (5 - 6) 5.33 ± 0.47 5 (5 - 6) 0.248* Normal Delivery
Yes n (%) 114 (95.8%) 86 (61%) 200 (76.9%) <0.001***
Normal Delivery
No n (%) 5 (4.2%) 55 (39%) 60 (23.1%)
*t: independent samples T-Test, **U: Mann-Whitney U test statics; ∗∗∗ 𝜒𝜒2: Chi-square test statistics
DISCUSSION
This study detected that the UCA and CL values had
a predictive value in predicting successful induction
of labor and normal birth rates.
The level of cervical ripening prior to IoL is the most
important factor for a successful labor. Previous
studies have shown a close relationship between the
features of the uterine cervix and the onset of
spontaneous labor.
14The cervix is supported by the pelvic ligaments and
is made up of collagen fibers. The cervix is exposed
to changes under pressure created by the surrounding
pelvic organs, and growing uterus or fetus. Therefore,
the uterocervical angle is important for the correct
progression of labor. Ultrasound is an important for
measuring a large number of obstetric and
ultrasonographic parameters.
15,16,17Previous studies have emphasized that cervical length
is an important indicator in normal delivery and
successful induction of labor in term pregnancies.
18,19In patients whose cutoff value of the cervical length
is <27mm, high sensitivity and specificity were
detected for the success of IoL
10,16,20In this study,
when the cutoff value for the cervical length was 29.5
in late and post-term pregnant women, the area under
the curve (AUC) was 0.801 (
p<0.001). When the
cutoff value was 29.5, the sensitivity and specificity
levels to predict the success of IOL were 91.7% and
57% respectively. Similarly, in studies in which the
probability of normal delivery and cesarean delivery
was assessed in late term pregnant women (week 41),
maternal factors such as nulliparity, advanced
maternal age and obesity and ultrasonographic
cervical length were evaluated, and the cervical length
was found to be effective in predicting normal
birth.
21,22Strobel et al. investigated the success of the
induction of labor in prolonged pregnancies and
found that the Bishop score and ultrasonographic
cervical length were effective in determining the
mode of delivery and the time to delivery.
19In recent years, the anterior UCA has come to the
fore as a new ultrasound marker in the determine of
premature delivery.
8,23A wide UCA creates a bigger
linear protrusion for the uterine content and causes
the fetal head to exert more pressure on the cervix.
In a narrow UCA, the uterus exerts less force on the
cervix and delays the discharge of uterine contents.
Dziadosz et al. compared the predictive performance
of UCA and CL in guessing preterm deliveries and
found that UCA was more effective.
8In another
study, cervical length and utero-cervical angle were
evaluated to distinguish between real and pseudo
labors and it was found that in the “real birth” group,
the cervical length was shorter and the uterocervical
angle was wider. The optimal threshold value for the
UCA was found to be 123 (RR 6.7, sensitivity 50%,
specificity 83%, PPV 10%, and NPV 96%).
24In
addition, the UCA parameter was found valuable in
predicting successful second trimester terminations,
and in pregnant women with a wider angle, a higher
rate of pregnancy termination was determined.
25In
this study the cut-off value for the uterocervical angle
was 98.5 degree. We think that this difference
between the cut-off values is caused by the pressure
of the baby growing in the last trimester on the cervix
uterus.
There are studies showing that cervical length,
posterior cervical angle, and anterior uterocervical
angle evaluations are better than traditional Bishop
scores in predicting the successful induction of labor
in term nulliparous women as they are in second
trimester terminations and preterm deliveries.
10,11,16,26In their study conducted to evaluate 150 nulliparous
term pregnant women, Dağdeviren et al. determined
that the median UCA was wider in patients who gave
birth vaginally after a successful induction of labor
than was that in those who gave birth by cesarean
section. (The UCA was 107.97 ± 19.61 in the
successful induction group and 104.25 ± 18.37 in the
failed group). They also detected a negative
correlation between CL and UCA before induction in
the participants who gave birth vaginally after
successful induction (rho = 0.21,
p=0.03) .
11In this
study, the mean UCA value was 102.17 ± 4.26 in the
successful induction of labor group and 94.25 ±
7.141 in the failed group. In their study conducted to
evaluate 109 nulliparous term pregnant women, Eser
et al. detected that both anterior utero-cervical angle
(AUCA=0.802,
p<.001) and cervical length (AUCA
= 0.679,
p<.05) were good determinants in predicting
the success of induction of labor. They achieved the
optimal cutoff value when the anterior utero-cervical
angle was 97 degrees (sensitivity: 64%, specificity:
91%).
10In this study in which late term and post-term
260 nulliparous pregnant women were evaluated, the
rates of normal births and success of induction of
labor were lower. When the cut-off value for the
uterocervical angle was 98.5, the area under the curve
(AUC) was 0.835. This value obtained is statistically
significant (
p<0.001). When the cut-off value was
98.5, the sensitivity and specificity were 75% and
73.5% respectively.
To our current knowledge, this study is the first study
in which the role of UCA and CL measured in
prenatal period in predicting the success of IoL in late
term and post-term pregnancies. The primary
limitation of our study is that the CL and the UCA
were measured before the uterine contractions
occurred. However, the CL and UCA are variable
anatomical structures that can change with uterine
contractions. Unfortunately, due to the functioning
of the hospital, we were not able to reevaluate the
UCA and CL after the onset of the active phase of
labor. The second limitation was that it was designed
as a retrospective study. In retrospective studies, the
data obtained from the heterogeneous data sources is
limited; therefore, it is recommended that
prospective studies with large populations should
conducted.
In conclusıon this study demonstrated that both the
UCA and CL measurements had a significant
predictive value in the prediction of successful
induction of labor and normal birth rates in late term
and post-term nulliparous pregnant women.
Yazar Katkıları: Çalışma konsepti/Tasarımı: DKG; Veri toplama:
DKG; Veri analizi ve yorumlama: DKG; Yazı taslağı: DKG; İçeriğin eleştirel incelenmesi: DKG; Son onay ve sorumluluk: DKG; Teknik ve malzeme desteği: DKG; Süpervizyon:DKG; Fon sağlama (mevcut ise): yok.
Etik Onay: Bu çalışma için Medipol Üniversitesi Tıp Fakültesi
Girişimsel Olmayan Klinik Araştırmalar Etik Kurulu'ndan etik onay alınmıştır. (16.04.2020 tarihi ve 10840098-604.01.01-E.14177 numarası ile).
Hakem Değerlendirmesi: Dış bağımsız.
Çıkar Çatışması: Yazarlar çıkar çatışması beyan etmemişlerdir. Finansal Destek: Yazarlar finansal destek beyan etmemişlerdir. Author Contributions: Concept/Design : DKG; Data acquisition: DKG; Data analysis and interpretation: DKG; Drafting manuscript: DKG; Critical revision of manuscript: DKG; Final approval and accountability: DKG; Technical or material support: DKG; Supervision: DKG; Securing funding (if available): n/a.
Ethical Approval: Ethical approval was obtained from Medipol
University Faculty of Medicine Non-Interventional Clinical Research Ethics Committee for this study. (With the date 16.04.2020 and the number 10840098-604.01.01-E.14177).
Peer-review: Externally peer-reviewed.
Conflict of Interest: Authors declared no conflict of interest. Financial Disclosure: Authors declared no financial support
REFERENCES
1. 1.Management of Late-Term and Postterm Pregnancies. Practice Bulletin No 146. American College of Obstetricians and Gynecologists. Obstet Gynecol. 2014;124:390-396.
2. Martin JA, Hamilton BE, Ventura SJ, Osterman MJ, Kirmeyer S, Mathews TJ, et al. Births: final data for 2009. Natl Vital Stat Rep. 2011;60:1–70.
3. Crane JM. Factors predicting labor induction success: a critical analysis. Clin Obstet Gynecol. 2006;49:573– 584.
4. Pevzner L, Rayburn WF, Rumney P, Wing DA. Factors predicting successful labor induction with dinoprostone and misoprostol vaginal inserts. Obstet Gynecol. 2009;114:261–267.
5. Parkes I, Kabiri D, Hants Y, Ezra Y. The indication for induction of labor impacts the risk of cesarean delivery. J Matern Fetal Neonatal Med 2016;29:224– 28.
6. Lazanakis M, Marsh M, Brockbank E, Economides D. Assessment of the cervix in the third trimester of
pregnancy using transvaginal ultrasound scanning. Eur J Obstet Gynecol Reprod Biol. 2002;105:31–35. 7. Sochacki-Wójcicka N, Wojcicki J, Bomba-Opon D,
Wielgos M. Anterior cervical angle as a new biophysical ultrasound marker for prediction of spontaneous preterm birth. Ultrasound Obstet Gynecol. 2015;46:377–378.
8. Dziadosz M, Bennett TA, Dolin C, West Honart A, Pham A, Lee SS et al. Uterocervical angle: a novel ultrasound screening tool to predict spontaneous preterm birth. Am J Obstet Gynecol. 2016;215:1-7. 9. Sepúlveda-Martínez A, Díaz F, Muñoz H, Valdés E,
Parra-Cordero M. Second-trimester anterior cervical angle in a low-risk population as a marker for spontaneous preterm delivery. Fetal Diagn Ther. 2017;41:220–225.
10. Eser A., Ozkaya E. Uterocervical angle: an ultrasound screening tool to predict satisfactory response to labor inductionJ Matern Fetal Neonatal Med. 2020;33:1295-1301.
11. Dagdeviren E, Aslan Çetin B, Aydogan Mathyk B, Koroglu N, Topcu EG, Yuksel MA. Can uterocervical angles successfully predict induction of labor in nulliparous women? Eur J Obstet Gynecol Reprod Biol. 2018;228:87-91.
12. 12.Grobman WA, Simon C. Factors associated with the length of the latent phase during labor induction. Eur J Obstet Gynecol Reprod Biol. 2007;132:163–66. 13. American College of Obstetricians and Gynecologists. ACOG Practice Bulletin Number 49, December 2003: dystocia and augmentation of labor. Obstet Gynecol. 2003;102:1445–1454.
14. Hassan SS, Romero R, Haddad R et al. The transcriptome of the uterine cervix before and after spontaneous term parturition. Am J Obstet Gynecol. 2006;195:778–86.
15. Eggebø TM, Heien C, Økland I, Gjessing LK, Romundstad P, Salvesen KA. Ultrasound assessment of fetal head-perineum distance before induction of labor. Ultrasound Obstet Gynecol. 2008;32:199–204. 16. Rane SM, Pandis GK, Guirgis RR, et al. Pre-induction sonographic measurement of cervical length in prolonged pregnancy: the effect of parity in the prediction of induction-to-delivery interval. Ultrasound Obstet Gynecol. 2003;22:40–44. 17. Rovas L, Sladkevicius P, Strobel E, Valentin L.
Three-dimensional power Doppler ultrasound assessment of the cervix for the prediction of successful induction of labor with prostaglandin in prolonged pregnancy. J Ultrasound Med. 2005;24:933–939.
18. Stupar ZT, Miki_c AN, Bogavac M et al. Prediction of labor induction outcome using different clinical parameters. Srp Arh Celok Lek. 2013;141:770–74. 19. Strobel E, Sladkevicius P, Rovas L et al. Bishop score
and ultrasound assessment of the cervix for prediction of time to onset of labor and time to delivery in prolonged pregnancy. Ultrasound Obstet Gynecol. 2006;28:298–305.
20. Daskalakis G, Thomakos N, Hatziioannou L et al. Sonographic cervical length measurement before labor induction in term nulliparous women. Fetal Diagn Ther. 2006;21:34–38.
21. Rao A, Celik E, Poggi S, et al. Cervical length and maternal factors in expectantly managed prolonged pregnancy: prediction of onset of labor and mode of delivery. Ultrasound Obstet Gynecol. 2008;32:646– 51.
22. Roos N, Sahlin L, Ekman-Ordeberg G, et al. Maternal risk factors for postterm pregnancy and cesarean delivery following labor induction. Acta Obstet Gynecol Scand. 2010;89:1003–1010.
23. Farràs Llobet A, Regincós Martí L, Higueras T, Calero Fernández IZ, Gascón Portalés A, Goya Canino MM et al. The uterocervical angle and its relationship with
preterm birth. J Matern Fetal Neonatal Med 2018;31:1881-84.
24. Bouzid A, Kehila M, Trabelsi H et al. Sonographic landmarks to differentiate “false labor” and “early true labor” as a possible new application of ultrasound in labor ward. J Gynecol Obstet Hum Reprod. 2017;46:363–66.
25. Cetin BA, Aydogan Mathyk B, Tuten A et al. The predictive nature of uterocervical angles in the termination of second trimester pregnancy. J Matern Fetal Neonatal Med. 2019;32:1952-57.
26. Keepanasseril A, Suri V, Bagga R, et al. Pre-induction sonographic assessment of the cervix in the prediction of successful induction of labour in nulliparous women. Aust N Z J Obstet Gynaecol. 2007;47:389– 393.