Adaptation Of Change Tendencies Scale For Teachers Değişim Eğilimleri Ölçeğinin Öğretmenler İçin
Uyarlanması Şener BÜYÜKÖZTÜRK
Hasan Kalyoncu Üniversitesi Eğitim Fakültesi, Gaziantep Öner USLU
Ege Üniversitesi Eğitim Fakültesi, İzmir Sadegül AKBABA ALTUN
Başkent Üniversitesi Eğitim Fakültesi, Ankara
Makale Geliş Tarihi: 06.01.2016 Yayına Kabul Tarihi: 21.07.2016 Abstract
It is frequently expected from teachers to change their instructional techniques in line with the innovations in education. However, change is a painful process. Developing or adapting a scale to measure teachers’ tendencies toward change may contribute to possible future studies about teacher change. Therefore, this study is aimed to investigate the psychometric characteristics of school administrators’ Change Tendencies Scale (CTS) for teachers. The analyses were conducted through the data obtained from 850 teachers who had participated in the study voluntarily. The four-factor structure of CTS was examined by first and second level Confirmatory Factor Analysis (CFA).
Keywords: Change Tendencies Scale, Teachers’ Change Tendencies, Scale Adaptation Özet
Eğitim alanındaki yeniliklere paralel olarak öğretmenlerden sıklıkla kullandıkları yöntemleri değiştirmeleri beklenmektedir. Ancak değişim sancılı bir süreçtir. Öğretmenlerin değişime yönelik eğilimlerini belirleyebilecek ölçme araçları geliştirmek ya da uyarlamak öğretmenlerin değişimiyle ilgili yapılacak olan çalışmalara katkı getirebilir. Bu nedenle bu araştırmayla okul yöneticilerine yönelik geliştirilmiş olan Değişim Eğilimleri Ölçeğinin (DEÖ) psikometrik niteliklerinin öğretmenler için incelenmesi amaçlanmıştır. Analizler çalışmaya gönüllü olarak katılan 850 öğretmen üzerinden gerçekleştirilmiştir. DEÖ’nin dört faktörlü yapısı birinci ve ikinci düzey Doğrulayıcı Faktör Analiziyle (DFA) incelenmiştir.
Anahtar Kelimeler: Değişim Eğilimleri Ölçeği, Öğretmenlerin Değişim Eğilimi, Ölçek Uyarlama
1. Introduction
The concept of change is seen as a desired act to the recent situation of objects or individuals (Balcı, 2005) and is defined as the difference between the elements of the whole and the relations between these elements compared to the previous situa-tion (Balcı, 2005; Demirtaş & Güneş, 2002). Özdemir (2000) describes change as in that any systems, procedures or environmental transformation from one situation to another. According to Fullan (1993) change is a non-linear and complex process with lots of uncertainties; moreover, the more complex the change the more difficult it is. Everard and Morris (1990) point out the importance of understanding the complex structure of change and state that the process of change is to be managed based on this understanding.
Change in the educational system is inevitable with the change at the individu-al and societindividu-al levels. Increase in the knowledge base about education necessitates educators at all levels to gain new expertise. It is expected from teachers to change their educational materials, instructional methods, or attitudes (Fullan, 2005; Guskey, 2000).
Change can be at teacher, school or regional level. However, most related change about teaching and learning process is the teacher level change. This means change in teachers’ ideas, attitudes and behaviors (Fullan, 2005; Klecker & Loadman, 1999). Change in teachers’ in-class activities is a difficult process, even changing teachers’ knowledge and skills does not guarantee change in class level activities (Guskey, 2000). Quite a lot of studies both in Turkey and around the world claim that the ai-med change could not affect the implementation (Akpınar & Gezer, 2010; Aykaç & Ulubey, 2012; Hennessy, Ruthven, & Brindley, 2005; Law, Pelgrum, & Plomp, 2008).
As it is claimed there are lots of reasons for failing at change initiatives, and one of these reasons is that change is seen as one time occasion instead of a continuous process (Fullan, 2005; Guskey, 2000). However, to be successful, change should be seen as a continuous process rather than a onetime event, including teachers’ conti-nuous professional development initiatives. Determining teachers’ tendencies about change is rather important at this process. Schlechty (1993)’s classification of five types of roles during change process at schools may help to determine the teachers’ ideas about change processes. These are trailblazers, pioneers, settlers, stay-at-homes and saboteurs at the change process (Schlechty, 1993).
Trailblazers are motivated for change and willing to take risks. They are ready to go although no one wants to go. Pioneers are also willing for adventure and take risks; however, they should be persuaded that innovation would be better than the current situation. Settlers need to know what is expected of them and where they are going to go. They need much more detail and more carefully drawn maps than those who have gone before them. They should be persuaded about the usefulness of the change and they want to see why the change is necessary. Stay-at-homes are unwilling to participate in the change process. After trailblazers and pioneers finish the change process, stay-at-homes join them to test the change. If they are satisfied with the new experiences, then they accept the change. On the other hand, saboteurs are not only
unwilling to participate the change process, but they also try to prevent others’ partici-pation in the change. Effective saboteurs, like trailblazers, do not hesitate to take risk. Trailblazers go to new places while others are afraid to leave; saboteurs stay at their place while others are afraid to stay (Schlechty, 1993).
Some people are entrepreneurs and willing to take risk during the change process (Schlechty, 1993). Encouraging this entrepreneurship in teachers to share their experi-ence with other teachers may contribute to the success of the change process (Collin-son et al., 2009). However, higher perceived risk may prevent teachers from applying the change in the class. Because of this, it is better to take same precautions to reduce the perceived risk, so that teachers may be motivated for the change (Le Fevre, 2014).
Some teachers may resist to change because of the perceived risk or other reasons; resistance to change is one of the main reasons that prevent change process (Doğru & Uyar, 2012; Elliott & Tudge, 2007; Kwahk & Lee, 2008). Resistance to change is seen effective at the major change initiatives such as technology, method and administra-tion related issues (Oreg, 2006). The major reasons of resistance to change are reluc-tance to lose control, cognitive rigidity, lack of psychological resilience, intolerance to the adjustment period involved in change, preference for low levels of stimulation and novelty and reluctance to give up old habits (Oreg, 2003). In addition to this, if teachers cannot understand the structure of the change, they may show resistance to change (Han, 2011).
Besides resistance to change, some people try to prevent the existing situation and attempt to stop the change process (Schlechty, 1993). Teachers may be unwilling to enter the change when they feel endangered about job safety etc. during the process (Madden, 2008). Teachers can be persuaded and motivated to enter change process more easily with the help of meetings, discussions, professional development prog-rams and continuous support (Bayır, 2009; Madden, 2008; Schlechty, 1993). Bayır (2009) indicates that it is better if the process is explained to the employees in detail and openly, listening employees’ ideas about the change and including them into the process may help to improve individuals’ commitment to the process.
There are so many factors affecting teachers’ change process. Because of this, determining teachers’ current situation about change is important for evidence based decisions. In this context, studies have been carried out on teacher change over the last decades. These studies have employed both qualitative and quantitative methods (Akpınar & Aydın, 2007; Akpınar & Gezer, 2010; Aydoğan, 2007; Han, 2011; Mad-den, 2008; Tekbıyık & Akdeniz, 2008; Yangin & Dindar, 2007). Mostly questionna-ires were used in quantitative studies, while some of them used scales to examine teachers’ attitudes towards organizational change or examine change in specific sub-jects such as mathematics (Duru & Korkmaz, 2010; Kurşunoğlu & Tanrıöğen, 2006). Consequently, it can be said that studies on teachers’ change process are limited at Turkey. Additionally, there are only few studies examining different dimensions of teachers’ change. Developing or adapting reliable and validated scales containing dif-ferent dimensions of the change process may contribute to increase the number of studies about teacher change, which would help to determine teachers’ conditions about change easily and explicitly. When teachers’ tendencies about the change can
be determined, problems about change may be clarified and some successions may be given to decision makers.
Akbaba-Altun and Büyüköztürk (2011) have developed the Change Tendencies Scale for administrators, which includes four dimensions of change. As the scale inc-ludes educational change in the school environment, it is thought that this scale can be adapted for teachers since no scale is available to determine change tendencies of teachers. As mentioned above, adapting this scale for teachers can contribute both to the literature and practice. Thus, the aim of this study is to examine the psychometric properties of the Change Tendencies Scale for teachers, which was developed for school administrators (Akbaba-Altun and Büyüköztürk, 2011).
2. Methodology Adaptation Process
The original Change Tendencies Scale was developed by Akbaba-Altun and Bü-yüköztürk (2011) for school administrators. The validity and reliability analyses of the scale were reported based on the data collected from 284 administrators. The factor structure of the scale was examined by exploratory factor analysis. Results of the analysis revealed a-four factored structure that had conceptual relevance with 44.6% of the total variance. The factors of the scale are “Entrepreneurship in change”, “Re-sistance to change”, “Belief in the usefulness of change”, “Keeping the status”. This four factored structure was examined with the confirmatory factor analysis (CFA). The results of CFA showed that the data fit the model. Cronbach’s alpha coefficient was found as .86 for “Entrepreneurship in change”, .82 for “Resistance to change”, .91 for the “Belief in the usefulness of change” and .67 for “Keeping the status”. Cor-rected item total correlations were between .34 and .79.
The adaptation started out by rewording and aligning the original scale items and the instructions for teachers. For example, an item which was prepared for administ-rators said: “Teachers at school know my habit of complaining about everything” was changed for teachers as follows: “My colleagues at the school know my habits of complaining about everything.” Then, the four-factor scale was finalized with the adapted items to determine teachers’ tendencies. This adapted version of the scale was sent to expert review together with the previously written items. Only one item was revised after expert review. Finally, after obtaining approval from the creators of the original scale, the process of validation of the scale was carried out.
Validation Participants
The scale was distributed to 850 teachers who joined a professional development program and worked in Izmir province. Total completion time of the scale took betwe-en 20-30 minutes. In terms of educational level, 88% of the teachers (n=749) have an undergraduate degree while the 10% of them (n=91) have a postgraduate degree. The remaining 2% (n=10) of the group did not answer the questions about the education
level. In terms of gender, 57% of the teachers (n=484) marked themselves as female and 43% (n=366) marked as male. In terms of experience, 6% of the teachers (n=48) have been working for 3 years, 5% (n=39) for 4-6 years, 50% (n=424) for 7-18 years, 36% (n=309) for 19-30 years and 3% of them (n=30) for more than 31 years.
Data Analysis
When investigating the correlational analysis, results were considered significant if p< .001, to account for the effect of multiple testing. To test whether the CTS is con-sistent with the nature of that construct, a confirmatory factor analysis was conducted on the extracted factors, following the same procedures described above. First level CFA was run to examine the four factor structure of CTS. Then, through second level CFA, an upper-level concept was examined and defined as “Change”. When correla-tions were observed between items and their errors in modification indices, necessary modifications were added to the model. Finally, Cronbach’s alpha was calculated both for the full scale and for the reported factors separately to observe the internal consis-tency of the scale.
3. Findings
Confirmatory Factor Analysis
The four-factor structure of CTS was examined by confirmatory factor analysis. When CFA modification indices were examined, it was observed that if the correla-tions between the errors in some variables (item10 and item8, item14 and item13, item30 and item29, item32 and item31) were defined in the model, the chi-square value, which is an indicator of a model fit, would decrease remarkably. Before procee-ding to this step, first, expert opinions were sought to ensure whether it is theoretically appropriate to include these relations into the model. Once these error relations were included in the model, it was observed a total of 603.4 decrease in chi-square value. The fit indices for the first and second level CFA are presented in Table 1. All standart coefficients calculated for item-factor and factor-factor were presented in Table 2. Table 1. The fit indices of the first and second level CFA
c2 (sd) (c2/sd) RMSEA RMS CFI NFI NNFI GFI AGFI
First Order 3472.14 (769) 4.50 .06 .04 .98 .97 .98 .83 .81 Second Order 3832.40 (771) 4.97 .07 .10 .97 .96 .97 .82 .80
The fit indices calculated at first order are as follows: c2 (sd=769)=3472.14, (c2/sd)=4.50, RMSEA=0.06, RMS=0.04, CFI=0.98, NFI=0.97 and NNFI=0.98. GFI=0.83, AGFI=0.81. Fit indices calculated at the second order are as follows: c2 (sd=769)=3832.40 (771), (c2/sd)=4.97, RMSEA=.07, RMS=.10, CFI=.97, NFI=.96, NNFI=.97, GFI=.82 and AGFI=.80.
Table 2. The results of CFA: Standart coefficients
Usefulness Entrepreneurship 1 .72 (.72) 17 .73 (.72) 2 .73 (.73) 19 .71 (.69) 4 .79 (.80) 20 .80 (.80) 5 .76 (.76) 21 .74 (.73) 7 .82 (.82) 23 .65 (.65) 8 .82 (.81) 26 .77 (.78 9 .88 (.88) 27 .68 (.69 10 .87 (.87) 28 .73 (.73 11 .79 (.79) 31 .59 (.59 13 .83 (.83) 32 .55 (.56 14 .71 (.70) 33 .69 (.68) 16 .79 (.79) 35 .62 (.62) Resistance 37 .66 (.66) 18 .64 (.64) 40 .69 (.69) 22 .67 (.67) Status 24 .70 (.69) 3 .58 (.65) 25 .58 (.58) 6 .70 (.77) 29 .65 (.65) 12 .62 (.75) 30 .63 (.63) 15 .69 (.71) 34 .66 (.66) 36 .58 (.58) 38 .51 (.51) 39 .53 (.53) 41 .60 (.60)
Usefulness Resistance Entrepreneurship
Usefulness
-Resistance .43
-Entrepreneurship .77 .33
-Status .48 .82 .32
Note: The values in parenthesis report the results of second order CFA
For CTS with four-factor measurement model, standard coefficients were calcula-ted for the factor of “entrepreneurship in change” between .55 and .88; “resistance to change” between .51 and .70; “Belief in the usefulness of change” .71 and .88; “ke-eping the status” between .66 and .76. The highest relation was between “resistance to change” and “keeping the status”. The standard coefficient numbers between fac-tors varied between .32 and .82. The lowest relation was between “entrepreneurship in change” and “keeping the status quo”, whereas the highest relation was between “resistance to change” and “keeping the status”. Based on the relationship observed between the factors, the connectivity of the four-factor measurement model to anot-her upper-level concept, named as “Change”, was examined through CFA. After the analysis, standard coefficient numbers between change and latent variables were cal-culated for “entrepreneurship in change” to be .49, for “resistance to change” to be .85, for “Belief in the usefulness of change” to be .60 and for “keeping the status” to be .89. When the second order CFA was executed, similar coefficients were observed
as presented in Table 2. The standard coefficiency scores between the upper construct “change tendency” and the related latent variables in second order CFA are as follows: For change tendency and entrepreneurship in change .49, for change tendency and resistance to change .85; for change tendency and belief in the usefulness of change .60; and, for change tendency and keeping the status.89. All t-values calculated for re-lationship between latent variables and observed variables or amongs latent variables found significant at .01 level.
Reliability
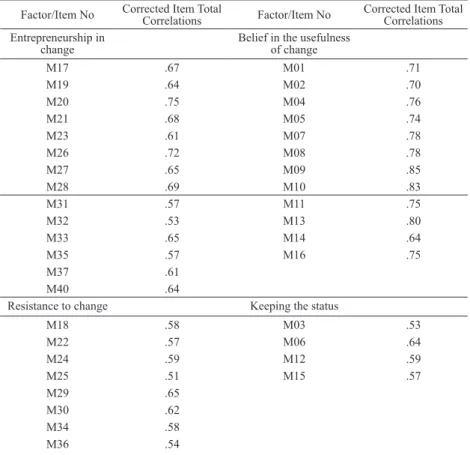
The alpha coefficient numbers of the factors of CTS were calculated for “Entrep-reneurship in change” as .92, for “Resistance to change” as .86, for “Belief in the use-fulness of change” as .95 and for “Keeping the status” as .78. The Spearman Brown coefficient numbers calculated for reliability were .88, .82, .91 and .74 respectively. The corrected item total correlation (Table 3) was calculated for each factor and it varied between .44 and .85.
Table 3 CTS item analysis results
Factor/Item No Corrected Item Total Correlations Factor/Item No Corrected Item Total Correlations Entrepreneurship in
change Belief in the usefulness of change
M17 .67 M01 .71 M19 .64 M02 .70 M20 .75 M04 .76 M21 .68 M05 .74 M23 .61 M07 .78 M26 .72 M08 .78 M27 .65 M09 .85 M28 .69 M10 .83 M31 .57 M11 .75 M32 .53 M13 .80 M33 .65 M14 .64 M35 .57 M16 .75 M37 .61 M40 .64
Resistance to change Keeping the status
M18 .58 M03 .53 M22 .57 M06 .64 M24 .59 M12 .59 M25 .51 M15 .57 M29 .65 M30 .62 M34 .58 M36 .54
Factor/Item No Corrected Item Total Correlations Factor/Item No Corrected Item Total Correlations Entrepreneurship in
change Belief in the usefulness of change
M38 .44
M39 .46
M48 .51
The descriptive statistics for CTS factor scores is presented in Table 3. The ave-rage point difference for “entrepreneurship in change” is 51.33; for “resistance to change” is 42.61; for “Belief in the usefulness of change” is 47.74; and, for “keeping the status” is 15.33. The skewness values for four factors are near to zero, so it can be said that the distribution is almost symmetric. The kurtosis values are positive, which indicates that the distribution is deviated from the normal distribution.
Table 4. Descriptive statistics for the factor scores of CTS (N=850)
Factor # of items M SD Skewness Kurtosis Min Max
Entrepreneurship in change 14 51.33 8.29 -0.12 1.11 14 70
Resistance to change 11 42.61 6.63 -0.78 2.22 11 55
Belief in the usefulness of change 12 47.74 8.21 -0.90 2.14 12 60
Keeping the status 4 15.33 3.02 -0.74 1.37 4 20
4. Discussion
This study reported the psychometric characteristics of CTS for teachers, which was originally developed for school administrators. Volunteer teachers (n=850) par-ticipated in the study. Firstly, four-factor structure of CTS was examined by the first level CFA. After the first level analysis, RMS (.04) was found to be close to zero and CFI (.98), NFI (.97) and NNFI (.98) were close to one which indicates that the model has a good fit with the data (Jöreskog & Sörbom, 1993; Şimşek, 2007). The results of RMSEA (.06) and “c2/sd” (4.50) indicate that the fit between the model and data is within acceptable intervals (Hooper, Coughlan, & Mullen, 2008; Jöreskog & Sörbom, 1993; Sümer, 2000). In addition, GFI (.83) and AGFI (.81) are between acceptable fit index intervals or close to these intervals (Anderson & Gerbing, 1984; Cole, 1987; Marsh, Balla, & Mcdonald, 1988). Consequently, it can be said that, there is an accep-table fit between the model and data for the four factored CTS.
The connectivity of the four-factor measurement model to another upper-level concept defined as “Change” was examined through a second level CFA. Although the results of the second level CFA are relatively lower than the results of the first le-vel CFA, these results RMSEA (.07), RMS (.10), CFI(.97), NFI(.96), NNFI(.97), GFI (.82) and AGFI (.80) were also between acceptable intervals. The reliability analysis indicates that the alpha reliability coefficients are between .95 and .75, suggesting that the reliability of CTS is at the acceptable level (Leech, Barrett, & Borgan, 2005). In addition to the reliability analysis, corrected item total correlations were also
examined for each item. These correlations were calculated to be between .44 and .85, for each factor. As the item total correlations were higher than .40, it can be said that each item has a distinctiveness power (Büyüköztürk, 2007). Thus, it means that the items are probably at least moderately correlated with most of the other items and will make a good component of this summated rating scale (Leech et al., 2005).
The CTS has for factors namely: entrepreneurship in change, resistance to change, belief in the usefulness of change, keeping the status. These factors are parallel with most publications in the literature. The first factor of the CTS is “entrepreneurship in change”. Similarly, Fullan (1990) claims that, teachers can investigate new ways of change when they are supported properly. Schlechty (1993) explains five types of people in the change process and firstly explains the details of entrepreneurships. The entrepreneurs are not only willing to change but also willing to take risks; entreprene-ur teachers should be encoentreprene-uraged to share their experiences with other teachers dentreprene-uring the change process (Collinson et al., 2009). So entrepreneurs can motivate other teac-hers for the change efforts.
The second factor of the CTS is “resistance to change”. Resistance to change is one of the main reasons for failure in the change process (Knight, 2009; Oreg, 2003). Determining teachers’ perceived risks in the change process will be helpful for the effort of reducing the resistance to change (Le Fevre, 2014). Therefore, informing teachers about the change process will be helpful (Knight, 2009). Also, Han (2011) claims that when teachers understand the structure of the change, their resistance to change will decrease.
Another factor of the CTS is “belief in the usefulness of change”. Similarly, Fullan (1990) indicates that teachers should be persuaded about the benefits of the change. If teachers cannot be persuaded about the benefit of the change, the change initiative could fail.
The last factor of the CTS is “keeping the status”. Some of the teachers may refuse to participate in the change process, especially when they think that the results of the change may pose a risk for them (Madden, 2008; Schlechty, 1993). These are the most difficult teachers to persuade and motivate for change efforts.
Teachers’ tendencies about change can be determined by using CTS. Offering a scale for teachers’ change tendencies can support both the literature and practical imp-lications. The nature of teacher change can be understood more easily with the help of studies which use CTS. The current situation of teachers about each dimension of change tendencies can be described by this way. Determining if teachers are entrepre-neur, resistance, belief the usefulness of change or they are willing to keep the status is important for change initiatives. Thus, teachers’ need for the change initiatives may be determined effectively as their needs at each dimension differs (Schlechty, 1993).
Moreover, it is important to examine the correlation between teacher change ten-dencies and other variables such as technology usage, age, content area they teach etc. We can understand how other variables may affect teacher change this way and make it possible to take provisions against these variables as well.
In addition to their contributions to the literature, studies about teacher change tendencies can also support practical implementations. Decision makers can get empi-rical data with the help of the studies which use CTS. The chance of success in change initiatives may be increased with the help of empirical data. Experimental studies also help in determining how teachers’ tendencies are shifting during the change process.
Professional development programs are the main support for teachers at the chan-ge process (Fullan, 1990; Guskey, 2000). Professional development programs could be more effective if they can be planned compatibly with teachers’ current situati-ons and needs (Guskey, 2000). Therefore, studies which examine teachers’ change tendencies can support professional development studies. Moreover, examining the shift in teachers’ change tendencies during professional development programs may help to determine the effectiveness of these programs. Thus the effectiveness of pro-fessional development programs can be improved with the help of change tendency examinations.
Some suggestions may be given for prospective studies. Researchers may conduct some descriptive studies to determine the change tendencies of teachers. Moreover, studies can be carried out to examine the correlations between teachers’ change ten-dencies and some other variables. Additionally, pre-test post-test type studies can be conducted so that researchers can get evidence about the effectiveness of change ini-tiatives.
To conclude, CTS which was developed for school administrators can also be used for teachers. The subscales of the CTS are parallel with lots of studies about teacher change in the literature. Offering a scale that can determine teachers’ change tenden-cies may support both the literature and practical implications.
5. References
Akbaba-Altun, S., & Büyüköztürk, Ş. (2011). Değişim eğilimleri ölçeğinin geliştirilmesi. Kalem Eğitim ve İnsan Bilimleri Dergisi, 1(1), 73 - 90.
Akpınar, B., & Aydın, K. (2007). Eğitimde Değişim ve Öğretmenlerin Değişim Algıları Eğitim ve Bilim, 32(144), 71 - 80.
Akpınar, B., & Gezer, B. (2010). Öğrenen Merkezli Yeni Eğitim Yaklaşımlarının Öğrenme-Öğret-me Sürecine Yansımaları. Dicle Üniversitesi Ziya Gökalp Eğitim Fakültesi Dergisi, 14, 1 - 12. Anderson, J. C., & Gerbing, D. W. (1984). The Effect of Sampling Error on Convergence,
Impro-per Solutions, and Goodness-of-Fit Indexes for Maximum-Likelihood Confirmatory Factor-Analysis. Psychometrika, 49(2), 155-173.
Aydoğan, İ. (2007). Değişimin Süreci ve Okul Personeli GAU J. Soc. & Appl. Sci., 3(5), 13-24. Aykaç, N., & Ulubey, Ö. (2012). Öğretmen adaylarının ilköğretim programının uygulanma
düze-yine ilişkin görüşleri. Ankara Üniversitesi Eğitim Bilimleri Fakültesi Dergisi, 45(1), 63-82. Balcı, A. (2005). Eğitim yönetimi terimleri sözlüğü. Ankara: Tek Ağaç Yayıncılık.
Bayır, T. (2009). Deişim Sürecinde Örgütsel Bağlılığı Etkileyen Faktörlerin İncelenmesi: Bir Uy-gulama. (Yüksek Lisans), Dumlupınar Üniversitesi, Kütahya.
Büyüköztürk, Ş. (2007). Sosyal Bilimler İçin Veri Analizi El Kitabı (8. Basım ed.). Ankara: Pegem A Yayıncılık.
Cole, D. A. (1987). Utility of Confirmatory Factor-Analysis in Test Validation Research. Journal of Consulting and Clinical Psychology, 55(4), 584-594.
Collinson, V., Kozina, E., Lin, Y. H. K., Ling, L., Matheson, I., Newcombe, L., & Zogla, I. (2009). Professional development for teachers: a world of change. European Journal of Teacher Edu-cation, 32(1), 3-19.
Demirtaş, H., & Güneş, H. (2002). Eğitim yönetimi ve denetimi sözlüğü: Anı.
Doğru, S., & Uyar, M. (2012). Millî Eğitim Bakanlığı Taşra Örgütlerinin Değişmeye Direnme Eği-limleri Üzerine Bir Araştırma (Konya İli Örneği) Buca Eğitim Fakültesi Dergisi, 32, 118 - 143. Duru, A., & Korkmaz, H. (2010). Öğretmenlerin Yeni Matematik Programı Hakkındaki Görüşleri ve Program Değişim Sürecinde Karşılaşılan Zorluklar. Hacettepe Üniversitesi Eğitim Fakül-tesi Dergisi, 38, 67-81.
Elliott, J., & Tudge, J. (2007). The impact of the west on post‐Soviet Russian education: change and resistance to change. Comparative Education, 43(1), 93-112.
Everard, B., & Morris, G. (1990). Effective School Management (2nd ed.): Paul Chapman Pub-lishing Ltd.
Fullan, M. (1990). Staff development, innovation, and institutional development. in: B. Joyce (Ed.) Changing school culture through staff development (Alexandria, ASCD), 3–25.
Fullan, M. (1993). Change Forces: Probing the depths of educational reform. N. Y: : Palmer Press. Fullan, M. (2005). The new meaning of educational change. Amsterdam Avenue, New York:
Columbia: Teachers College Press.
Guskey, T. R. (2000). Evaluating professional development. California: California: Corwin Press. Han, Ç. (2011). Eğitimsel Değişim ve Öğretmen: Biyoloji Öğretmenlerinin Yeni Öğretim Programı
Hakkındaki Kişisel Teorileri Üzerine Etnografik Bir Durum Araştırması. (Yüksek Lisans), Marmara Üniversitesi, İstanbul.
Hennessy, S., Ruthven, K., & Brindley, S. (2005). Teacher perspectives on integrating ICT into subject teaching: commitment, constraints, caution, and change. Journal of Curriculum Stu-dies, 37(2), 155-192.
Hooper, D., Coughlan, J., & Mullen, M. (2008). Structural equation modelling: Guidelines for determining model fit. Articles, 2.
Jöreskog, K. G., & Sörbom, D. (1993). LISREL 8: Structural Equation Modeling with the SIMP-LIS Command Language. Lincolnwood: Scientific Software International.
Klecker, & Loadman, B. M. (1999). Measuring principals’ openness to change on three dimen-sions: Affective, cognitive and behavioral. Journal of Instructional Psychology, 26(4), 213. Knight, J. (2009). What can we do about teacher resistance. Phi Delta Kappan, 90(7), 508-513. Kurşunoğlu, A., & Tanrıöğen, A. (2006). İlköğretim Okulu Öğretmenlerinin Örgütsel Değişmeye
İlişkin Tutumları Pamukkale Üniversitesi Eğitim Fakültesi Dergisi, 20, 13-22.
Kwahk, K.-Y., & Lee, J.-N. (2008). The role of readiness for change in ERP implementation: The-oretical bases and empirical validation. Information & Management, 45(7), 474-481. Law, N., Pelgrum, W. J., & Plomp, T. (2008). Pedagogy and ICT use in schools around the world:
Findings from the IEA SITES 2006 Study.: Comparative Education Research Centre. Sprin-ger: The University of Hong Kong.
Le Fevre, D. M. (2014). Barriers to implementing pedagogical change: The role of teachers’ per-ceptions of risk. Teaching and Teacher Education, 38, 56-64. doi: 10.1016/j.tate.2013.11.007 Leech, N., Barrett, K. C., & Borgan, G. A. (2005). SPSS for intermediate statistics use and
intarp-retation (2nd ed.). New Jersey, London.
Madden, T. (2008). Planlı Değişim Sürecinin Okulların Geliştirilmesinde Kullanılması. (Doktora), Anadolu Üniversitesi, Eskişehir.
Marsh, H. W., Balla, J. R., & Mcdonald, R. P. (1988). Goodness-of-Fit Indexes in Confirmatory Factor-Analysis - the Effect of Sample-Size. Psychological Bulletin, 103(3), 391-410. Oreg, S. (2003). Resistance to change: Developing an individual differences measure. Journal of
applied psychology, 88(4), 680-692.
Oreg, S. (2006). Personality, context, and resistance to organizational change. European Journal of Work and Organizational Psychology, 15(1), 73 - 101.
Özdemir, S. (2000). Eğitimde örgütsel yenileşme: Pegem A Yayıncılık.
Schlechty, P. C. (1993). On the Frontier of School Reform with Tradblazers, Pioneers, and. Journal of Staff Development, 14(4).
Sümer, N. (2000). Yapısal eşitlik modelleri: Temel kavramlar ve örnek uygulamalar. Türk Psikoloji Yazıları, 3(6), 49-74.
Şimşek, Ö. F. (2007). Yapısal Eşitlik Modellemesine Giriş (Temel İlkeler ve LISREL Uygulamala-rı). Ankara: ekinoks.
Tekbıyık, A., & Akdeniz, A. R. (2008). İlköğretim Fen ve Teknoloji Dersi Öğretim Programı-nı Kabullenmeye ve Uygulamaya Yönelik Öğretmen Görüşleri Necatibey Eğitim Fakültesi Elektronik Fen ve Matematik Eğitimi Dergisi (EFMED), 2(2), 23-37.
Yangin, S., & Dindar, H. (2007). İlköğretim Fen ve Teknoloji Programındaki Değişimin Öğret-menlere Yansımaları. Hacettepe Üniversitesi Eğitim Fakültesi Dergisi, 33, 240-252.