ANALYSIS OF CHRNA5 EXPRESSION IN BREAST CANCER CELL LINES IN RESPONSE TO SERUM STARVATION AND
ESTROGEN TREATMENT
A THESIS SUBMITTED TO
THE DEPARTMENT OF MOLECULAR BIOLOGY AND GENETICS AND GRADUATE SCHOOL OF ENGINEERING AND SCIENCE
OF BILKENT UNIVERSITY
IN PARTIAL FULFILLMENT OF THE REQUIREMENTS FOR THE DEGREE OF
MASTER OF SCIENCE
By Azer Aylin AÇIKGÖZ
August 2013
ABSTRACT
ANALYSIS OF CHRNA5 ISOFORMS IN BREAST CANCER CELL LINES IN RESPONSE TO SERUM STARVATION AND
ESTROGEN TREATMENT Azer Aylin Açıkgöz
MSc. in Molecular Biology and Genetics Supervisor: Asst. Prof. Dr. Özlen Konu
August 2013
Breast cancer is a complex disease that can be classified into distinct molec-ular subtypes including Basal, Luminal A, Luminal B and HER2 positive. These molecular subtypes mainly differ in their hormone receptor expression and response to treatment. This makes the discovery of new molecular mark-ers for further classification important. Cholinergic nicotinic acetylcholine receptors are ion channels involved in smoking behavior, neurodegenera-tive diseases and cancer. Cholinergic nicotinic receptor alpha 5 (CHRNA5) has been associated with nicotine addiction and recently with lung cancer yet its importance in breast cancer remains relatively unexplored. In the present study, a panel of 10 breast cancer cell lines were used for quan-tification of isoform-specific CHRNA5 expression using qPCR. Changes in CHRNA5 expression in response to serum starvation and estrogen treatment were assessed. qPCR showed that CHRNA5 was alternatively spliced, with at least five different isoforms in breast cancer cell lines. qPCR analysis for CHRNA5 expression in serum treated and serum starved cells were analyzed after outlier detection and exclusion; and statistical tests included ANCOVA using geometric mean of TPT1 and SDHA, as reference genes. Our results demonstrated that, CHRNA5 expression differed between different subtypes of breast cancer cell lines. CHRNA5 expression significantly responded to serum starvation in ZR75-1 and MDA-MB-157 cell lines, isoform specifically. Isoform expression of CHRNA5 exhibited significant alterations upon estro-gen treatment in a dose and time-dependent manner. Expression of 1000bp variant, isoform2 and isoform3 of CHRNA5 significantly increased upon E2
treatment and total CHRNA5 and isoform2 CHRNA5 increased in expres-sion at 24 hours when compared with 12 hours of treatment. Our findings show that CHRNA5 has multiple isoforms in breast cancer, with potential to be modulated by serum starvation and estrogen treatment in a cell-specific manner.
Keywords: Breast cancer, CHRNA5, estrogen, serum starvation, molecular subtype.
ÖZ
CHRNA5 İFADESİNİN MEME KANSERİ HÜCRE HATLARINDA ANALİZİ VE SERUM AÇLIĞI İLE
ÖSTROJENE CEVABI Azer Aylin Açıkgöz
Moleküler Biyoloji ve Genetik Yüksek Lisansı Tez Danışmanı: Yrd. Doç. Dr. Özlen Konu
Ağustos 2013
Meme kanseri karmaşık bir hastalık olup, moleküler olarak bazal, luminal A, luminal B, HER2+ ve normal tipler olarak sınıflandırılabilir. Bu tipler arasındaki ana fark hormon reseprörlerinin ifadeleri açısındandır. Farklı tip-lerin tedaviye cevapları da farklıdır. Bu nedenle, meme kanserini daha iyi sınıflandırabılmek için yeni moleküler markörler bulmanın önemi artmak-tadır. Kolinerjik nikotinik asetilkolin reseptörleri , sigara içme alışkanlığında, nörodejeneretiv hastalıklarda ve kanserde rolü olduğu düşülünen iyon kanal-larıdır. Kolinerjik reseptör nikotinik alfa 5 (CHRNA5) nikotin bağımlılığı ve akciğer kanseri ile ilişkilendirilmiştir ancak meme kanserindeki önemi henüz bilinmemektedir. Bu çalışmada, 10 adet meme kanseri hücre hat-tından oluşan bir panel kullanılarak, CHRNA5 varyantlarının ifadesi qPCR ile ölçülmüştür. CHRNA5 ifasesinin serum açlığı ve östrojen tedavisine bağlı değişimi incelenmiştir. qPCR sonuçları CHRNA5in meme kanseri hücre hat-larında alternatif kırpıldığını ve en az beş izoforma sahip olduğunu göster-miştir. Serum varlığında ve serum açlığında CHRNA5 ifadesini ölçen qPCR verilerinin analizleri aykırı verilerin bulunup çıkartılmasından sonra, TPT1 ve SDHA referans genlerinin geometrik ortalaması alınarak ANCOVA istatistik-sel analizi ile yapılmıştır. Sonuçlarımız gösteriyor ki, CHRNA5 ifadesi farklı tip meme kanseri hücre hatları arasında farklılık göstermektedir. Serum yokluğunda ZR-75-1 ve MDA MB 157 hücre hatlarında CHRNA5 ifadesi izoformlara özgü olarak anlamli bir değişime uğramıştır. Östrojen tedavisi sonucunda, CHRNA5 izoformlarının ifadeleri doz ve zamana bağlı olarak değişmektedir. Toplam CHRNA5 ifadesi ve izoform 2 CHRNA5 ifadesi 24
saatte, 12 saate göre artış göstermiştir. Bulgularımız CHRNA5in meme kanserinde birden fazla izoformu olduğunu ve bu izoformların serum açlığı ve östrojen tedavisi sonucunda, hücre hattına bağlı olarak değişme potan-siyelinin olduğunu göstermiştir.
Anahtar sözcükler: meme kanseri, CHRNA5, alternatif kırpılma, östrojen, serum açlığı, moleküler tip.
ACKNOWLEDGEMENTS
First of all, I would like to thank my thesis advisor Asst. Prof. Özlen Konu for her guidance throughout my thesis work.
I would like to thank Asst. Prof. Ali O. Güre and Asst. Prof. Öznur Taştan for their scientific assistance and advice for my thesis. I would also like to express my gratitude to Assoc. Prof. İhsan Gürsel for helping me both in my scientific and personal life whenever I needed.
I would especially like to mention Sıla, Nilüfer and Gurbet who have always been there for me, both scientifically and as dearest friends throughout these two years.
I would like to thank Ermira Jahja for cloning, sequencing and providing primer sequences and Gizem Ölmezer for assistance in cell culture experi-ments.
I’m grateful to the MBG family, especially to Damla and to the members of IG Group for a friendly and understanding working environment.
I would like to express my heartfelt gratitude to İhsan, for always being there for me in these past two years, for being with me, helping and supporting me both in the best and worst of the times.
I would like to convey my deepest love and gratitude towards my family: my grandparents Şaziye and Celal; my best friend and brother Alihan; and foremost, my beautiful super-mom Esin. Without you I would not be where I’m today. I appreciate everything you have done for me and I’m eternally grateful.
The research presented in this thesis has been funded by TUBITAK (TBAG-111T316). I was supported by Bilkent University Molecular Biology and Genetics Department, and TUBITAK for my graduate studies.
Contents
1
INTRODUCTION
1
1.1 Breast Cancer . . . 1
1.1.1 Types and Progression . . . 1
1.1.2 Genes Involved in Breast Cancer . . . 2
1.1.3 Risk Factors . . . 2
1.1.4 Classification . . . 3
1.1.4.1 Histopathological Type . . . 3
1.1.4.2 Tumor Grade . . . 3
1.1.4.3 Tumor Stage . . . 4
1.1.5 Receptor Status and Molecular Subtype . . . 4
1.1.6 Estrogen, Estrogen Receptor (ER) and Breast Cancer . 5 1.1.7 Breast Cancer Cell Lines . . . 8
1.2 Cholinergic Receptor Nicotinic Alpha (CHRNA or nAChR) . . . 10
1.3 CHRNA5 . . . 12
1.6 Quantitative Real Time Polymerase Chain Reaction (qPCR)
Analysis . . . 18
2
AIM
20
3MATERIALS AND METHODS
22
3.1 Cell Culture Protocols . . . 223.1.1 Cell Lines . . . 22
3.1.2 Cell Growth Conditions . . . 24
3.1.3 Thawing Cells . . . 24
3.1.4 Subculturing of Cells . . . 24
3.1.5 Cryopreservation of Cells . . . 25
3.1.6 Serum Starvation Treatment . . . 25
3.1.7 β-Estradiol (E2) Treatment . . . . 26
3.1.8 MTT Assay . . . 27
3.2 Gene Expression Analyses . . . 28
3.2.1 Total RNA Isolation . . . 28
3.2.2 cDNA Synthesis . . . 29
3.2.3 Oligonucleotides . . . 29
3.2.4 Polymerase Chain Reaction . . . 30
3.2.5 Agarose Gel Electrophoresis . . . 31
3.2.6 Quantitative Real Time-Polymerase Chain Reaction (qPCR) . . . 31
3.3 Analyses of Serum-Starvation qPCR Results . . . 33
3.3.2 Geometric Mean of Reference Genes . . . 34
3.3.3 Statistical Analysis of qPCR Data . . . 36
3.3.3.1 Pearson Correlation Between 200bp and 1000bp CHRNA5 Isoforms . . . 38
3.3.3.2 ANCOVA . . . 38
a) For all cell lines . . . 38
b) For each cell line, for the effect of serum star-vation . . . 38
3.4 Analyses of β-Estradiol Treatment Results . . . 39
3.4.1 Two-way Anova analysis with R . . . 39
3.4.2 ANCOVA of CHRNA5 expression . . . 40
3.4.3 Saturation Analysis of E2 Treatment . . . 40
3.5 General Solutions . . . 41
4
RESULTS
42
4.1 Expression of CHRNA5 Isoforms in Cell Lines . . . 424.2 Effects of Serum Starvation Treatment . . . 44
4.2.1 Effects of Serum Starvation on Cell Proliferation and Viability . . . 44
4.2.2 Effects of Serum Starvation on CHRNA5 Variant Ex-pression . . . 49
4.2.2.1 Outlier Detection in qPCR data . . . 49
4.2.2.4 Comparison of CHRNA5 Variant Expression in Response to Serum Starvation Treatment . 67
4.3 Effects of E2 treatment . . . 79
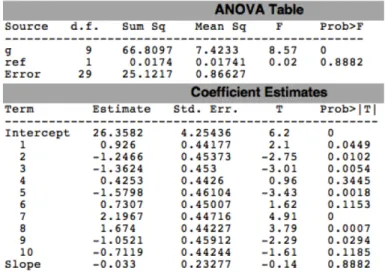
4.3.1 Two-way Anova According to Dose and Time . . . 79
4.3.2 ANCOVA of CHRNA5 expression . . . 93
4.3.2.1 Saturation Points of E2 Treatment . . . 98
5
CONCLUSION AND DISCUSSION
102
6
FUTURE PERSPECTIVES
107
7
REFERENCES
109
8
APPENDICES
109
List of Figures
1.1 The genetics of breast cancer. . . 2
1.2 Sources of estrogen and its target organs. . . 5
1.3 Estrogen receptor signaling pathways. . . 6
1.4 Pathways that lead to estrogen carcinogenesis. . . 7
1.5 Schematic representation of a nAChR. . . 11
1.6 Schematic representation of a heteromeric nAChR and ACh binding site. . . 11
1.7 Schematic representation of CHRNA3-CHRNA5-CHRNB4 gene cluster. . . 12
1.8 Alternative splicing of CHRNA5 in lung. . . 13
1.9 Different types of alternative splicing. . . 15
1.10 Abnormal pre-mRNA splicing can lead to malignancy. . . 16
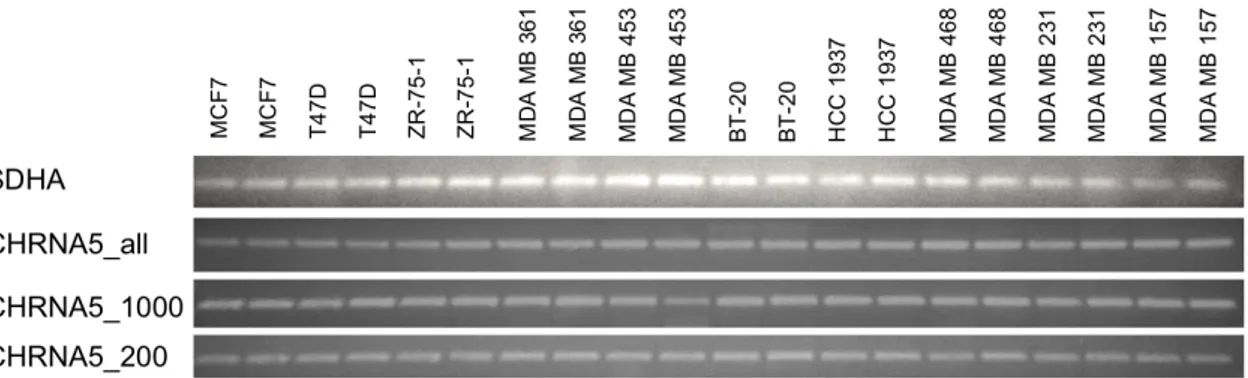
4.1 Representative expression of CHRNA5 alternative splicing prod-ucts and TPT1 across breast cancer cell lines treated with 10% and 0.1% FBS. . . 43 4.2 Expression of different CHRNA5 variants and SDHA across
4.3 MTT assay results for MCF7 cells. . . 46
4.4 MTT assay results for T47D cells. . . 46
4.5 MTT assay results for ZR-75-1 cells. . . 46
4.6 MTT assay results for MDA MB 361 cells. . . 47
4.7 MTT assay results for MDA MB 453 cells. . . 47
4.8 MTT assay results for BT-20 cells. . . 47
4.9 MTT assay results for HCC 1937 cells. . . 48
4.10 MTT assay results for MDA MB 468 cells. . . 48
4.11 MTT assay results for MDA MB 231 cells. . . 48
4.12 MTT assay results for MDA MB 157 cells. . . 49
4.13 Outlier analysis for TPT1. . . 51
4.14 Outlier analysis for SDHA. . . 52
4.15 Outlier analysis for 200bp CHRNA5. . . 53
4.16 Outlier analysis for 1000bp CHRNA5. . . 54
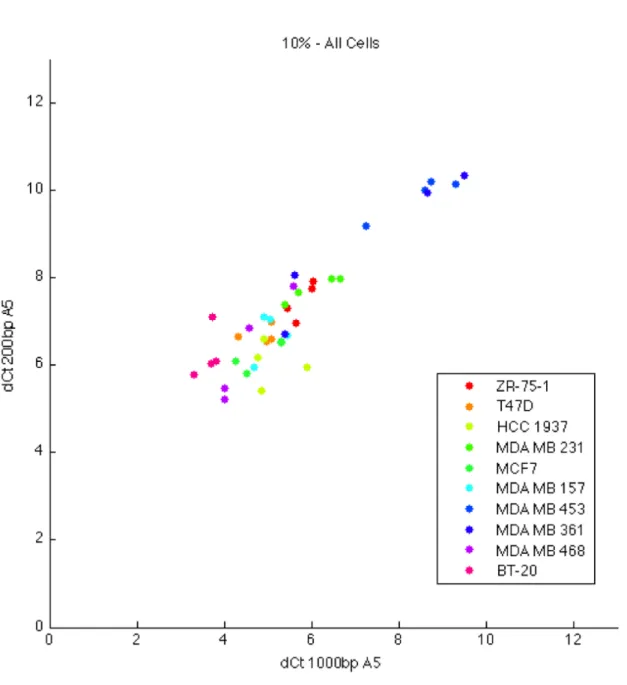
4.17 200bp and 1000bp CHRNA5 expression across 10% FBS treated cell lines. . . 56
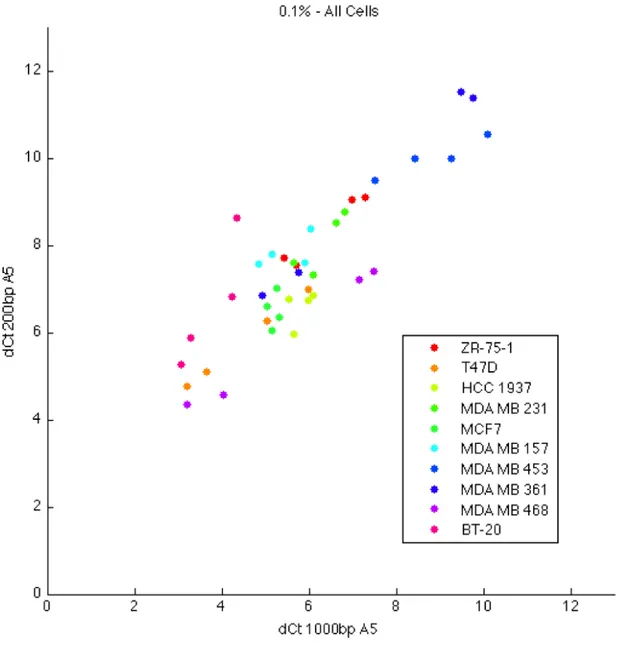
4.18 200bp and 1000bp CHRNA5 expression across 0.1% FBS treated cell lines. . . 57
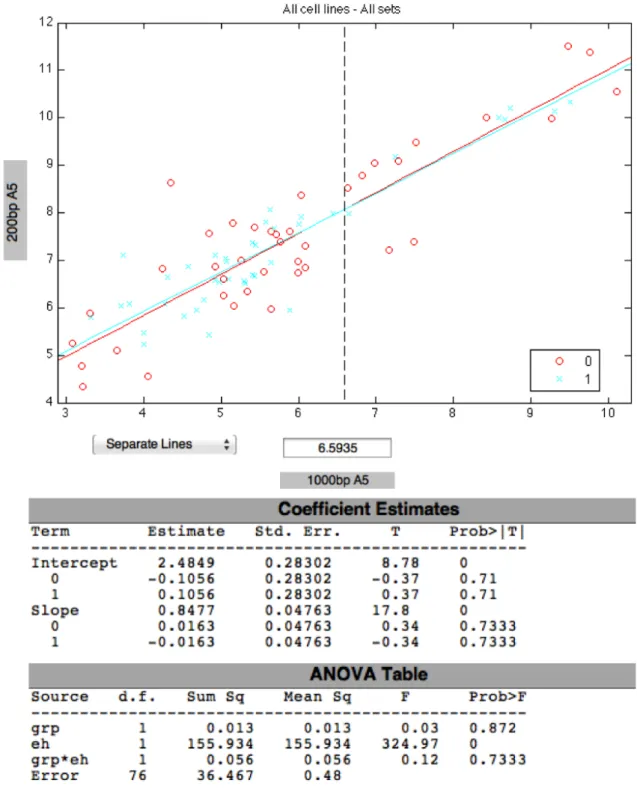
4.19 ANCOVA of 200bp and 1000bp CHRNA5 variants in 10% and 0.1% FBS treated cell lines. . . 59
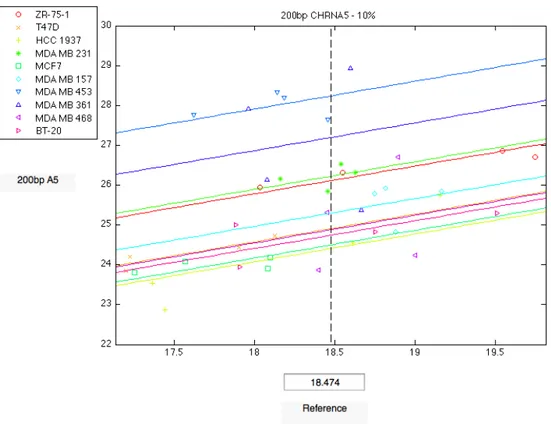
4.20 Comparison of 200bp CHRNA5 expression among brest cancer cell lines grown with 10% FBS. . . 63
4.21 Probability values of 200bp CHRNA5 expression of breast can-cer cell lines grown in 10% FBS. . . 63
4.22 Comparison of 200bp CHRNA5 expression among brest cancer cell lines grown with 0.1% FBS. . . 64 4.23 Probability values of 200bp CHRNA5 expression of breast
can-cer cell lines grown in 0.1% FBS. . . 64 4.24 Comparison of 1000bp CHRNA5 expression among brest
can-cer cell lines grown with 10% FBS. . . 65 4.25 Probability values of 1000bp CHRNA5 expression of breast
cancer cell lines grown in 10% FBS. . . 65 4.26 Comparison of 1000bp CHRNA5 expression among brest
can-cer cell lines grown with 0.1% FBS. . . 66 4.27 Probability values of 1000bp CHRNA5 expression of breast
cancer cell lines grown in 0.1% FBS. . . 66 4.28 ANCOVA for 200bp CHRNA5 expression in ZR-75-1 cell line. 69 4.29 ANCOVA for 1000bp CHRNA5 expression in ZR-75-1 cell line. 69 4.30 ANCOVA for 200bp CHRNA5 expression in T47D cell line. . . 70 4.31 ANCOVA for 1000bp CHRNA5 expression in T47D cell line. . 70 4.32 ANCOVA for 200bp CHRNA5 expression in HCC 1937 cell line. 71 4.33 ANCOVA for 1000bp CHRNA5 expression in HCC 1937 cell
line. . . 71 4.34 ANCOVA for 200bp CHRNA5 expression in MDA MB 231
cell line. . . 72 4.35 ANCOVA for 1000bp CHRNA5 expression in MDA MB 231
4.38 ANCOVA for 200bp CHRNA5 expression in MDA MB 157 cell line. . . 74 4.39 ANCOVA for 1000bp CHRNA5 expression in MDA MB 157
cell line. . . 74 4.40 ANCOVA for 200bp CHRNA5 expression in MDA MB 453
cell line. . . 75 4.41 ANCOVA for 1000bp CHRNA5 expression in MDA MB 453
cell line. . . 75 4.42 ANCOVA for 200bp CHRNA5 expression in MDA MB 361
cell line. . . 76 4.43 ANCOVA for 1000bp CHRNA5 expression in MDA MB 361
cell line. . . 76 4.44 ANCOVA for 200bp CHRNA5 expression in MDA MB 468
cell line. . . 77 4.45 ANCOVA for 1000bp CHRNA5 expression in MDA MB 468
cell line. . . 77 4.46 ANCOVA for 200bp CHRNA5 expression in BT-20 cell line. . 78 4.47 ANCOVA for 1000bp CHRNA5 expression in BT-20 cell line. . 78 4.48 Boxplot for PS2 in E2 treated cells. . . 80 4.49 Boxplot for ANLN in E2 treated cells. . . 82 4.50 Boxplot for all variants of CHRNA5 in E2 treated cells. . . 84 4.51 Boxplot for 1000bp variant of CHRNA5 in E2 treated cells. . . 86 4.52 Boxplot for 200bp variant of CHRNA5 in E2 treated cells. . . 88 4.53 Boxplot for isoform 2 of CHRNA5 in E2 treated cells. . . 90 4.54 Boxplot for isoform 3 of CHRNA5 in E2 treated cells. . . 92
4.55 ANCOVA of CHRNA5_All in response to E2 treatment. . . . 94 4.56 ANCOVA of 1000bp CHRNA5 in response to E2 treatment. . 95 4.57 ANCOVA of 200bp CHRNA5 in response to E2 treatment. . . 96 4.58 ANCOVA of iso2 CHRNA5 in response to E2 treatment. . . . 97 4.59 ANCOVA of iso3 CHRNA5 in response to E2 treatment. . . . 98 4.60 Expression levels of all isoforms of CHRNA5 in response to E2
treatment . . . 99 4.61 Expression levels of 1000bp isoform of CHRNA5 in response
to E2 treatment . . . 99 4.62 Expression levels of 200bp isoform of CHRNA5 in response to
E2 treatment . . . 100 4.63 Expression levels of isoform 2 of CHRNA5 in response to E2
treatment . . . 100 4.64 Expression levels of isoform 3 of CHRNA5 in response to E2
treatment . . . 101 7.1 Expression values of TPT1 probeset in GSE21648 dataset in
control and starvation groups . . . 125 7.2 Expression values of SDHA probeset in GSE21648 dataset in
control and starvation groups . . . 125 7.3 Expression values of TPT1 probeset in GSE31040 dataset in
control and starvation groups . . . 126 7.4 Expression values of SDHA probeset in GSE31040 dataset in
7.5 Expression values of TPT1 probeset in GSE1692 dataset in control and starvation groups . . . 127 7.6 Expression values of SDHA probeset in GSE1692 dataset in
control and starvation groups . . . 127 7.7 Expression values of TPT1 probeset in GSE8597 dataset in
control and estradiol treatment groups . . . 128 7.8 Expression values of SDHA probeset in GSE8597 dataset in
List of Tables
1.1 The origins of breast cancer cell lines used in this study. . . . 9
1.2 Hormone receptor characterization of molecular subtypes. . . . 9
1.3 Molecular characterization of breast cancer cell lines. . . 10
3.1 Breast cancer cell lines and their properties. . . 23
3.2 Primer sequences and their product sizes. . . 30
3.3 PCR reagents and their volumes. . . 31
3.4 PCR conditions for specific primers. . . 31
3.5 qPCR reagents and their volumes. . . 32
3.6 qPCR conditions. . . 32
3.7 GSE datasets that were analyzed for TPT1 and SDHA probe-sets. . . 35
3.8 An example of csv files used in two-way ANOVA analysis for E2-treatment data. . . 40
4.1 MTT results for all cell lines. . . 45
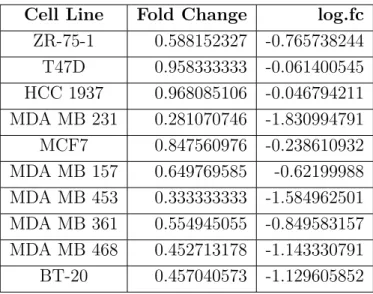
4.2 Fold changes of MTT absorbance values between 10% and 0.1% FBS treated breast cancer cell lines. . . 45
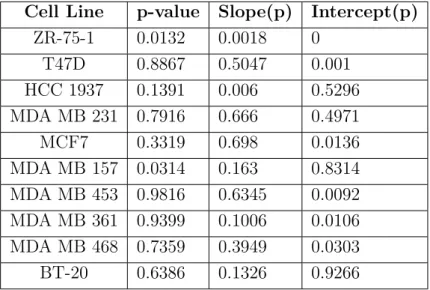
4.3 p-values of ANCOVA for all cell lines, pertaining to Figures
4.20-4.27. . . 61
4.4 ANCOVA results of each cell line for 200bp CHRNA5. . . 67
4.5 ANCOVA results of each cell line for 1000bp CHRNA5. . . 68
4.6 Log2-fold changes of PS2 in response to E2 treatment. . . 79
4.7 Significance values of change in PS2 expression in response to E2 treatment . . . 80
4.8 Log2-fold changes of ANLN in response to E2 treatment. . . . 81
4.9 Significance values of change in ANLN expression in response to E2 treatment . . . 81
4.10 Log2-fold changes of total CHRNA5 in response to E2 treatment. 83 4.11 Significance values of change in total CHRNA5 expression in response to E2 treatment . . . 83
4.12 Log2-fold changes of 1000bp variant of CHRNA5 in response to E2 treatment. . . 85
4.13 Significance values of change in 1000bp CHRNA5 expression in response to E2 treatment . . . 85
4.14 Log2-fold changes of 200bp variant of CHRNA5 in response to E2 treatment. . . 87
4.15 Significance values of change in 200bp CHRNA5 expression in response to E2 treatment . . . 87
4.16 Log2-fold changes of isoform2 of CHRNA5 in response to E2 treatment. . . 89
4.17 Significance values of change in isoform2 CHRNA5 expression in response to E2 treatment . . . 89
4.18 Log2-fold changes of isoform3 of CHRNA5 in response to E2 treatment. . . 91 4.19 Significance values of change in isoform3 CHRNA5 expression
in response to E2 treatment . . . 91 4.20 2-way ANOVA results for all genes. . . 92 7.1 Matlab code for outlier detection and exclusion . . . 121 7.2 Matlab code for arithmetic mean and geometric mean of
ref-erences . . . 122 7.3 Matlab code for ANCOVA of all cell lines . . . 123 7.4 Matlab code for ANCOVA of separate cell lines . . . 124
Abbreviations
AC
Adenocarcinoma
ACh
Acetylcholine
AF
Ascites Fluid
ANLN
Anilin
ATCC
American Type Culture Collection
bp
base pairs
BRCA
Breast Cancer Susceptibility Gene
CDC
Cell Division Cycle
cDNA
complementary Deoxyribonucleic Acid
CHEK2
Checkpoint Kinase2
CHRN
Cholinergic Receptor Nicotinic
CHRNA
Cholinergic Receptor Nicotinic Alpha
CHRNB
Cholinergic Receptor Nicotinic Beta
DC
Ductal Carcinoma
ddH2O
double-distilled water
DMEM
Dulbecco’s Modified Eagle’s Medium
DMSO
Dimethyl sulfoxide
DNA
Deoxyribonucleic Acid
dNTPs
deoxyribonucleotide triphosphates
E2
β-Estradiol
EDTA
Ethylenediaminetetraacetic Acid
ER
Estrogen Receptor
ERB-B2
Erythroblastic Leukemia Viral Oncogene Homolog 2
ERE
Estrogen Response Elements
ESS
Exonic Splicing Silencer
EST
Expressed Sequence Tag
EtOH
Ethanol
FBS
Fetal Bovine Serum
GABA
Gamma Amino Butyric Acid
glyR
Glycine Receptor
GWA
Genome Wide Association
HER2
Human Epidermal Growth Factor Receptor 2
IDC
Invasive Ductal Carcinoma
IGFBP4
Insulin-like Growth Factor Binding Protein 4
ISE
Intronic Splicing Enhancer
ISS
Intronic Splicing Silencer
MC
Metaplastic Carcinoma
MCM2
Minichromosome Maintenance Complex Component 2
MYC
myelocytomatosis
nAChR
Nicotinic Acetylcholine Receptor
PB
Primary Breast
PBS
Phosphate Buffered Saline
PCR
Polymerase Chain Reaction
PF
Pleural Effusion
PR
Progesterone Receptor
PTEN
Phosphatase and Tensin Homolog
qPCR
Quantitative Real Time Polymerase Chain Reaction
RNA
Ribonucleic Acid
SDHA
Succinate Dehydrogenase Complex, Subunit A
SNP
Single Nucleotide Polymorphism
snRNPs
Small Nucleic Ribonucleoproteins
TAE
Tris-Acetate-EDTA
TFF1
Trefoil Factor 1
TP53
Tumor Protein 53
TPT1
Tumor Protein, Translationally-Controlled
WISP2
WNT1 Inducible Signaling Pathway Protein 2
Chapter 1
INTRODUCTION
1.1
Breast Cancer
Breast cancer is the most common cancer among females. In the USA, breast cancer constitutes 28% of all new cancer cases and 26% of cancer-related deaths in women.1
1.1.1
Types and Progression
Breast cancer can either be hereditary or sporadic. In hereditary breast can-cer, patients have susceptibility to breast cancer due to a germline mutation that they inherited. The major genes that result in susceptibility are BRCA1 and BRCA2 but mutations in PTEN and TP53 can also cause breast can-cer.2 The contributions of mutations of particular genes to susceptibility of hereditary breast cancer are shown in Figure 1.1. Sporadic breast cancer occurs as a result of the accumulation of mutations in somatic tissues.2, 3
Figure 1.1: The genetics of breast cancer. (Reproduced with permission from
Wooster et al., 2003 Copyright Massachusetts Medical Society)
The transformation from a normal cell to a malignant cell can be described in 3 steps. In step 1, which is named ‘carcinoma in situ’, a normal cell changes into an atypical cell type and, after successive divisions, becomes a lesion. Step 2 is where the lesion becomes malignant and step 3 is the formation of metastases.3
1.1.2
Genes Involved in Breast Cancer
The genes implicated in breast cancer tumorigenesis can be divided into 6 groups. Oncogenes (e.g. MYC, ERBB2), tumor suppressor genes (e.g. BRCA1, BRCA2, p53), apoptosis genes, steroid receptors (e.g. ERα, ERβ, PR) and genes involved in invasion/cell adhesion and angiogenesis.3
1.1.3
Risk Factors
The major breast cancer risk factors are gender and age. Although familial breast cancers constitute around 10% of all breast cancers, family history is also an important risk factor, with increasing susceptibility to breast cancer in women with one or more relatives with breast cancer.
Hormonal and reproductive risk factors include the main female hormone estrogen and lack of childbearing at an early age. Early menarche and late menopause are also thought to increase the risk of getting breast cancer in women.4
Other major and minor risk factors include usage of hormone replacement therapy or oral contraceptives, lack of physical activity during adolescence, weight gain after menopause, obesity, history of some non-malignant breast diseases, environmental factors such as diet, consumption of alcohol on a daily basis and exposure to radiation.4
1.1.4
Classification
Classification of breast cancer is done in several categories in order to decide on the best treatment approach. The most common ones among these cat-egories are the histopathological type, tumor grade, tumor stage, receptor status and classifications that are based on DNA.
1.1.4.1 Histopathological Type
Histopathological type is defined based on the growth pattern of the breast cancer, with the most common type being invasive ductal carcinoma or IDC. There are, at least, 17 different histopathological types of breast cancer.5
1.1.4.2 Tumor Grade
The grading of the breast cancer tumors is based on the comparison of the appearance of the tumor tissue with the normal breast tissue under the mi-croscope. Three different criteria are assessed and a score from 1 to 3 is given for each of them. The grade of the tumor is identified after the summation of the scores for each criteria. 3 to 5 points indicate that the tumor is well-differentiated (low grade), 6 to 7 points indicate that the tumor is moderately differentiated (intermediate grade) and 8 to 9 points indicate that the tumor
correlated with the prognosis of breast cancer, with the poorly differentiated high grade tumors having the worst prognosis.6
1.1.4.3 Tumor Stage
Tumor staging is the procedure by which the location and the size of the cancer is determined. Staging is done after the assessment of mainly three properties which are tumor size (T), the involvement of lymph-nodes (N) and the presence of metastasis (M). This method, called the TNM staging system, is also used in the decision of the appropriate treatment for a patient and informs clinicians about the severity of the disease.7, 8 Stages differ from 0 to IV, with stage II and stage III having substages and stage IV being the most advanced stage, generally considered incurable. A larger tumor size, spreading to a number of nodes and metastasis tend to have a worse prognosis.7, 8
1.1.5
Receptor Status and Molecular Subtype
Another category used to classify breast cancer is its receptor status. Ex-pression, or lack thereof, of three most important ones, estrogen receptor (ER), progesterone receptor (PR) and HER2, helps in the determination of appropriate treatment type.
It was found out that breast tumors and breast cancer cell lines could be clustered into different subtypes according to the similarities and differences in their gene expression patterns. After microarray analysis, breast cancer was divided into four distinct molecular subtypes, namely luminal (ER+), basal (ER-, also called triple-negative breast cancer), ERB-B2+ (HER2+), and normal-like. Luminal type is further divided into luminal A and luminal B, with distinctive gene expression patterns.9–12
These molecular subtypes have different clinical outcomes and prognosis, with basal type having the worst prognosis and ERB-B2 having a consider-ably bad prognosis.9–12
1.1.6
Estrogen, Estrogen Receptor (ER) and Breast
Cancer
Estrogens are the primary steroid hormones of females. Premenopausal women have high levels of serum estrogen, but this level decreases after menopause. Estrogen can be endogenous or exogenous. Exogenous sources include hormone-replacement therapies and oral contraceptive usage. Pri-mary endogenous source of estrogen during the menstrual life are the ovaries. The small amount of estrogen present postmenopausally comes from extrag-onadal tissues like muscles, fat and liver.13, 14 Sources of estrogen and its target organs can be seen in Figure 1.2.
Figure 1.2: Sources of estrogen and its target organs. (Reproduced with
per-mission from Clemons et al., 2001 Copyright Massachusetts Medical Society)
receptor, namely ER-α and ER-β. Although ER-α has a higher affinity for estrogen when compared to ER-β, a balanced ratio between the two types of receptors is important in determining the estrogen response of a tissue.14, 15 Pathways of ER signaling are summarized in Figure 1.3.
Figure 1.3: Estrogen receptor signaling pathways. (Reproduced with permission
from Yager et al., 2006 Copyright Massachusetts Medical Society)
Estrogen is implicated in the carcinogenesis of the breast. In rodents, es-trogen intake causes mammary tumors, excessive hormone stimulation may cause uncontrolled cell growth and division, resulting in malignancy.14 The effects of estrogen are believed to be cumulative; when the exposure time lengthens, the risk increases. This is supported by the fact that women who
start their menstrual periods at an earlier age, or go through menopause at a later age tend to be at a higher risk of breast cancer.13 Hormone replacement therapy also causes an increase in the breast cancer risk, but this increase can be reversed.15 Estrogen has been associated both with the initiation and progression of breast cancer, but the mechanisms underlying this effect are complex.13–15 Pathways that lead to estrogen carcinogenesis is summarized in Figure 1.4.
Figure 1.4: Pathways that lead to estrogen carcinogenesis. (Reproduced with permission from Yager et al., 2006 Copyright Massachusetts Medical Society)
Estrogens were shown to regulate a variety of target genes. There are three mechanisms with which estrogen exerts its effects on its target genes.16 These
2. Recruitment of other transcription factors by ER 3. Indirect modulation
Effects of estrogen on gene expression is thought to be cell specific.16 The effects of estrogen on proliferation, apoptosis and gene expression were in-vestigated mainly in ER-responsive (ER+) breast cancer cell lines. In the ER+ breast cancer cell lines MCF7 and T47D, estrogen treatment resulted in increased proliferation17, 18but this was not the case in an ER- breast can-cer cell line MDA MB 436.17 A variety of primary and secondary responses (either up- or down-regulation) to estrogen treatment were identified in ER+ cell lines. These include genes involved in cell cycle and apoptosis (Cyclin D1, CDC2, CDC6, MCM2), genes that code for growth factors and cytokines (IGFBP4, WISP2) and TFF1/PS2, XBP1, CCND1, FOS and E2F.16, 19–21
1.1.7
Breast Cancer Cell Lines
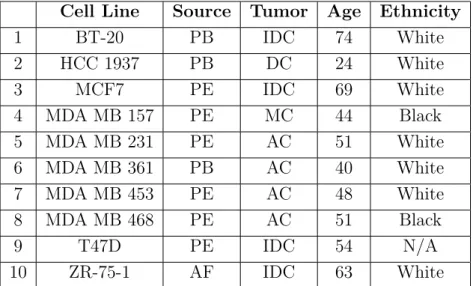
A large part of the research on breast cancer relies on the use of breast cancer cell lines. Breast cancer cell lines are immortalized cell lines, generally isolated from metastatic breast tumors and they have varying phenotypic and molecular characteristics, resembling the diversity of breast tumors. The origins of the cell lines used in this study can be found in Table 1.1.
Table 1.1: The origins of breast cancer cell lines used in this study.22
Cell Line Source Tumor Age Ethnicity
1 BT-20 PB IDC 74 White 2 HCC 1937 PB DC 24 White 3 MCF7 PE IDC 69 White 4 MDA MB 157 PE MC 44 Black 5 MDA MB 231 PE AC 51 White 6 MDA MB 361 PB AC 40 White 7 MDA MB 453 PE AC 48 White 8 MDA MB 468 PE AC 51 Black 9 T47D PE IDC 54 N/A 10 ZR-75-1 AF IDC 63 White
AC, adenocarcinoma; AF, ascites fluid; DC, ductal carcinoma; IDC, invasive ductal carcinoma; MC, metaplastic carcinoma; PB, primary breast; PE, pleural effusion.
Breast cancer cell lines can, like breast cancer tumors, be divided into molec-ular subtypes, mainly characterized by their expression of hormone receptors ER, PR and HER2.23 Table 1.2 shows which subtypes express which recep-tors.
Table 1.2: Hormone receptor characterization of molecular subtypes.23
Subtype ER PR HER2
Basal - -
-Luminal A + + or -
-Luminal B + + or - +
HER2 - - +
According to their expression of these receptors, the 10 breast cancer cell lines used in this study falls into the following molecular subtypes:22, 24, 25
Table 1.3: Molecular characterization of breast cancer cell lines.22, 24, 25
Cell Line ER PR HER2 Subtype
1 BT-20 - - - Basal 2 HCC 1937 - - - Basal 3 MCF7 + + - Luminal 4 MDA MB 157 - - - Basal 5 MDA MB 231 - - - Basal 6 MDA MB 361 + + + HER2 7 MDA MB 453 - - + HER2 8 MDA MB 468 - - - Basal 9 T47D + + - Luminal 10 ZR-75-1 + + - Luminal
1.2
Cholinergic Receptor Nicotinic Alpha
(CHRNA or nAChR)
Nicotinic acetylcholine receptors or cholinergic nicotinic receptors are excita-tory, transmembrane ligand-gated ion channels that belong to a superfamily along with other transmembrane ligand-gated channels such as GABA and glyR. They can bind acetylcholine (ACh) and nicotine and are mainly found at the neuromuscular junction and in some neurons both in the central and the peripheral nervous system.26–28
nAChRs have 2 different types of subunits identified, namely α, β and are found in either homomeric (consisting of a single subunit) or heteromeric (consisting of multiple subunits) pentamers. Each of the subunits have 4 transmembrane domains and a long extracellular N-terminal domain. To date, 9 α subunits (α2-10) and 3 β subunits (β2-4) have been identified, making a total of 12 subunits.27 Different combinations of these subunits in pentamers results in receptors with different electrophysiological properties. Some of the nAChRs were found out to have mRNAs that can be
alter-natively spliced, which further increases the diversity, with different splice variants resulting in different receptor subtypes. These subtypes may ex-plain the variable tolerance and addiction to nicotine or different release of neurotransmitters in different synapses.26, 28
Schematic representation of nAChRs and an example of a heteromeric nAChR can be seen in Figure 1.5 and 1.6, respectively.
Figure 1.5: Schematic representation of a nAChR. (Reprinted from Improgo et
nAChRs are implicated in a variety of diseases, disorders and behaviors, in-cluding nicotine addiction and smoking behavior, Alzheimer’s Disease, Parkin-son’s Disease, schizophrenia, epilepsy, and cancer.26–28
1.3
CHRNA5
nAChR subunits α3, α5 and β4 cluster together in the genome.29, 30 These were later mapped to chromosome 15 in humans (15q24-25) and chromosome 9 in mice.31 Figure 1.7 shows the gene cluster and relative positions of these three subunits in the genome.
Figure 1.7: Schematic representation of CHRNA3-CHRNA5-CHRNB4 gene
cluster. (Reprinted from Improgo et al., 2010, with permission from
Elsevier)
When combined with α3β3 subunits, α5 subunit has been shown to cause faster and a higher amount of desensitization of the receptor complex.32, 33 CHRNA5 has 6 exons and is alternatively spliced, with at least three alter-native transcripts identified.34 It is implicated in smoking behavior with a single nucleotide polymorphism (SNP) and a common haplotype, resulting in high nicotine dependence and nicotine addiction.35–37 CHRNA5 has also been associated with cognitive performance38, 39
CHRNA5 is implicated in lung cancer37with at least three independent GWA studies40–42showing association between the chromosomal region of this gene cluster and lung cancer. CHRNA5 was found to be upregulated 30 times in lung adenocarcinoma, compared to normal lung tissue. 5 different transcripts of CHRNA5 was identified in normal lung tissue, due to alternative splicing
of the 5th exon. 1 of these isoforms is the full length CHRNA5 transcript and the others are shorter versions. All of these variants were expressed sig-nificantly higher in lung adenocarcinoma.43 Splicing of these isoforms can be seen in 1.8.
Figure 1.8: Alternative splicing of CHRNA5 in lung. (Reprinted from Falvella
et al., 2013, with permission from Oxford University Press)
CHRNA5 was also shown to be expressed in breast tumors and breast cancer cell lines.44
1.4
Alternative Splicing
Alternative splicing is the process by which a single gene is allowed to pro-duce a variety of protein isoforms. This event has a pivotal role in differential expression of genes. Since eukaryotic genes have introns, pre-mRNA splicing
done by a complex called the spliceosome, which includes 5 small nuclear ri-bonucleoproteins (snRNPs) and a large number of other proteins.45, 46 Proper localization of the spliceosome is also dependent on cis-regulatory elements, named exonic and intronic splicing enhancers (ESE and ISE) and exonic and intronic splicing silencers (ESS and ISS), as well as trans regulatory splicing factors.47
Correct splicing is very important, as errors in parts of this mechanism lead to a variety of diseases. Especially in genes that are implicated in apop-tosis, invasion, differentiation and metastasis, splicing occurs differently in tumors.45, 48, 49
At least five different alternative splicing patterns were identified.45, 49, 50 They are shown in Figure 1.9. These include:
1. Cassette Exon: these exons are either skipped during splicing (spliced out) or included in the mature mRNA.
2. Alternative 3’ Splice Site: an alternative to the normal 3’ splice junction is used, resulting in an altered 5’ end of the exon that is downstream. This can either lengthen or shorten the exon. Also called alternative acceptor site.
3. Alternative 5’ Splice Site: an alternative to the normal 5’ splice junction is used, resulting in an altered 3’ end of the exon that is upstream. This can either lengthen or shorten the exon. Also called alternative donor site.
4. Mutually Exclusive Exons: one of these exons is included in the processed mRNA after splicing, but never both.
5. Intron Retention: in this pattern, an intron is not removed and included in the mature mRNA product.
Among these patterns, exon-skipping is the one that is most commonly ob-served in mammals, while intron retention is the least commonly obob-served.51
A combination of different alternative splicing patterns can be used in pro-cessing of a single pre-mRNA.47 In addition to these main patterns, the presence of variants may be due to having multiple promoter sequences or multiple polyadenylation sites. Different isoforms of a gene can also be cel-l/tissue type or developmental stage-specific.45, 47–49 It was shown that the 5th exon of CHRNA5 is an exon with alternative splice sites, and there are at least 5 isoforms that either include or exclude parts of this exon.43
Figure 1.9: Different types of alternative splicing. (Reprinted from Ladomery et
al., 2006, with permission from Elsevier)
Alterations in splicing patterns of particular genes have been observed or im-plicated in a number of diseases, including different types of cancer. These alterations may include mutations in cis or trans regulatory elements of splic-ing and result in changes in the selection of splice sites, leadsplic-ing to the
for-tissues.46, 47 An illustration of how alterations in splicing can lead to malig-nancy is shown in Figure 1.10.
Figure 1.10: Abnormal pre-mRNA splicing can lead to malignancy. (Reprinted
from Pajares et al., 2007, with permission from Elsevier)
In tumors, these so called ‘abnormal’ splicing variants, or aberrant transcripts are seen in genes that are involved in many processes in cancer susceptibility, initiation, development and progression. These include genes that are in-volved in apoptosis (p53, Klf6, MDM4, Bcl-x, Caspase-2, Fas), metabolism (Pyruvate kinase M ), invasiveness and metastasis (CD44, FGFs, Rac1, Ron,
Crk), angiogenesis (VEGFA) and proto-oncogenes (Cyclin D1, H-Ras).46, 48, 52
Classical methods for identification of splice variants in cancer included cDNA sequencing and RT-PCR, but recently more global, genome-wide meth-ods have been devised. These methmeth-ods include EST alignment, splicing-specific exon-junction microarrays and bead-based fiber microarrays.46, 47, 53
1.5
Serum Starvation
For years, serum starvation has been widely used as an experimental proce-dure, mainly to obtain cells with synchronized cell cycles. Although some scientists oppose the utility of serum starvation as a method of cell synchro-nization,54, 55a large number of researchers use this method in order to obtain cells with a G0/G1 phase arrest in the cell cycle. It is not exactly clear how serum starvation results in cell cycle arrest, but there has been a number of explanations. One of these associate the cell cycle arrest with inactivation of TOR and decreased Cyclin D1 levels, while another links it to increased p21 levels.56, 57
Serum starvation has also been related to apoptosis. Prolonged exposure to serum-free media can cause apoptosis by itself, both in a p53-dependent58 and p53-independent manner.59 A number of caspases were also implicated in serum starvation induced apoptotic processes.60, 61
Apart from being used as a method to synchronize cells, serum starvation has also been used as a method to investigate apoptosis, stress response of cells, autophagy and protein degradation, and regulation of gene expression. Mi-croarrays were used to study molecular mechanisms of serum starvation/de-pletion (unpublished data from Konu Lab). It is important to note that, generally, serum starvation response differs between the cells and the cell culture protocols used.62
1.6
Quantitative Real Time Polymerase Chain
Reaction (qPCR) Analysis
Quantitative real-time PCR (qPCR) has become the method of choice, both in research and in clinic, for quantification of gene expression. Among its many advantages are the fact that it is a high-throughput method, it is cost-effective, sensitive, specific and relatively easy to perform.63, 64 Still, in-terpreting and analyzing the data can be a challenge due to the complexity that having a number of variables brings.
Experimental design is very important, starting from the RNA to the analy-sis of the data obtained from qPCR. The things that need to be considered include, but are not limited to, RNA isolation and storage, preparation of the experimental setup, number of replicates (both biological and technical), normalization and statistical analysis methods.63, 64 In order to increase the statistical significance and meaning of the results, sample size must be in-creased and both biological and technical replicates must be present. Having biological replicates are thought to have more value than technical repli-cates, though technical replicates may help in the identification of outlier values.65, 66 There could be sample to sample or run to run variations be-tween samples. Normalization is the method used to correct sample to sample variations that can arise from total RNA converted to cDNA, cDNA conver-sion efficiency, high individual variation or technical differences among runs and sampling errors.63, 65, 67, 68 Selecting a proper normalization method is of great importance since normalization affects the interpretation of the data. Normalization is generally done by using one or more reference genes. Us-ing multiple reference genes for normalization is advised, with three beUs-ing considered the optimal number.63 When using multiple reference genes, nor-malization can be done by calculating the geometric mean of the reference genes. To aid with the selection of reference genes, a number of programs were devised, including GeNorm and BestKeeper.63, 64
variabil-ity being either biological, technical or due to an inappropriate experimental design.65 This high number of possible causes for variability makes data anal-ysis very important in interpreting the result of qPCR. Statistical analanal-ysis of the obtained data aims to identify differences in gene expression that are truly due to treatment, after minimizing the technical noise and identify the biological variability of the samples.68 To this end, a proposed list of steps for data analysis includes the identification and exclusion of outliers (experimen-tal errors), followed by averaging of technical and biological replicates and choosing a statistical test to perform.69, 70 The presence of three samples was said to be enough to be able to detect outliers with statistical significance.70 Outliers can be identified as data points that do not obey the distribution of other data points in the data set. These are considered irregulars, distinct from the rest of the data set.66 Identification and handling of these outliers is important to obtain statistically meaningful results and prevent wrong in-terpretations of the data.
It was proposed that a graphical representation of the distribution of the data may be of aid in the identification of outlier values.66 To this end, an easy method was devised using box plots.66 In these boxplots, the median value of the data points for a set is calculated and a box that represents the interquartile range is drawn around the median. The data points that fall outside of the whiskers are marked as potential outliers.66 Statistical anal-yses, such as Grubb’s test may be needed to assess the significance of the potential outliers.66 The identified outlier values can later be removed from the data prior to analysis, increasing the statistical power.
Chapter 2
AIM
Breast cancer is the most common cancer and the secondary cause of cancer-related deaths in women in the Western world. This year, in the United States alone, more than 200000 women are expected to develop breast can-cer, with an estimated death of around 40000.71 Since breast cancer is a complex disease, classification has been important in prognosis. Histopatho-logical type, tumor grading and staging were classically used to classify breast cancer and help with prognosis, but the observation that breast cancer is a more complex disease than previously thought lead to molecular classifica-tion of breast cancer and molecular subtypes.
Molecular subtype is described essentially by hormone receptor status, such as ER+, PR+, HER2+. According to this classification, breast cancers are now subdivided to 5 main molecular subtypes. These are basal or triple neg-ative, luminal A, luminal B, HER2+ and normal-like. Even though this lead to a better classification, it was seen that there were significant differences in response to a particular therapy, clinical outcomes and prognosis, even in patients that are categorized under the same molecular subtype. This calls for a need for further molecular classification of breast cancer, and makes finding new molecular markers that can be used in novel categorization of great importance.
Cholinergic nicotinic receptors (CHRNs) are ion channels that have been as-sociated with smoking behavior and nicotine addiction, neurodegenerative diseases and obesity. 9 alpha and 3 beta subunits have been identified in
humans. Recently, the α5 subunit has been associated with lung cancer. It was shown that CHRNA5 was expressed in breast cancers, but its transcrip-tional regulation was not extensively studied. In-silico analyses also suggest that CHRNA5 expression increases with estrogen treatment in ER+ breast cancer cell lines.72
Alternative splicing is an important way by which cells can increase their protein repertoire without the need for extra genes. Alternative splicing pat-terns of some genes were shown to be aberrant or abnormal in cancers, with either changes in the splice variants or changes in the ratios between specific variants.
In light of these information, in this study we asked whether CHRNA5 iso-forms were alternatively spliced among different breast cancer cell lines under different serum regimes and whether an estrogen receptor positive cell line, MCF7, increased its CHRNA5 expression upon estrogen treatment.
In particular, the following were studied:
• Presence of alternative splicing of CHRNA5 in a breast cancer cell line panel and identification of different splice variants.
• Isoform-specific CHRNA5 expression in breast cancer cell lines with different molecular subtypes and identifying the relationship, if any, with ER status.
• The expression profile of CHRNA5 splice variants in breast cancer cell lines in response to serum starvation treatment.
• Isoform-specific CHRNA5 expression in response to estrogen treatment, and whether it changes according to dose and time of treatment in MCF7 cells.
Chapter 3
MATERIALS AND METHODS
3.1
Cell Culture Protocols
3.1.1
Cell Lines
10 different breast cancer cell lines (MCF7, T-47D, ZR-75-1, MDA-MB-361, 453, BT-20, HCC 1937, 468, 231, MDA-MB-157) were used in this study (ATCC; Manassas, USA). They have been cul-tured in Bilkent University MBG laboratories. Information about these cell lines are listed in Table 3.1
T able 3.1: Breast cancer cell lines and their prop e rties. Line Tissue Deriv ed from Morphology Disease Age Gender Ethnicit y A TCC # mammary gland pleural effusion epithelial adeno carcinoma 69 y o female Caucasian HTB-22 mammary gland pleural effusion epithelial ductal carcinoma 54 y o female N/A HTB-133 mammary gland ascites epithelial ductal carcinoma 63 y o female Caucasion CRL-1500 mammary gland brain epithelial adeno carcinoma 40 y o female Caucasian HTB-27 MB 453 mammary gland p ericardial effusion epithelial metastatic carcinoma 48 y o female Caucasion HTB-131 mammary gland breast epithelial carcinoma 74 y o female Caucasian HTB-19 1937 mammary gland breast/duct epithelial ductal carcinoma 23 y o female Caucasian CRL-2336 MB 468 mammary gland pleural effusion epithelial adeno carcinoma 51 y o female Blac k HTB-132 MB 231 mammary gland pleural effusion epithelial adeno carcinoma 51 y o female Caucasian HTB-26 MB 157 mammary gland breast/medulla epithelial medulallary carcinoma 44 y o female Blac k HTB-24
3.1.2
Cell Growth Conditions
DMEM (SH30021.01), RPMI 1640 Medium (SH30255.01), FBS (SW30160.03),
Penicillin/Streptomycin Solution (SV30010) and Trypsin/EDTA solution (SH30042.01) were from HyClone (Logan, USA). Non-essential amino acid solution (K0293)
was from Biochrom AG (Berlin, Germany). PBS (17-516F) was from Lonza (Switzerland).
The growth medium of MCF7, MDA-MB-453, BT-20, MDA-MB-468 and MDA-MB-231 cells included DMEM with 10% Fetal Bovine Serum, 1% Peni-cillin/Streptomycin solution and 1% Non-essential amino acids.
The growth medium of ZR-75-1 cells included RPMI 1640 medium with 10% Fetal Bovine Serum, 1% Penicillin/Streptomycin solution, 1% Non-essential amino acids and 4,5 g/L D(+)-Glucose (Riedel-de-Haël, Hanover, Germany). The growth medium of MDA-MB-361 and MDA-MB-157 cells included DMEM, with 10% Fetal Bovine Serum, 1% Penicillin/Streptomycin solution, 1% Non-essential amino acids and 1% Sodium Pyruvate (11360) (Gibco, USA).
3.1.3
Thawing Cells
One vial of frozen cells was taken from liquid nitrogen and were placed in the water bath at 37°C to melt. After melting, the cells were taken to a 15 ml, sterile tube with 10 ml complete medium and re-suspended. The cells were centrifuged at 1500 rpm for 5 minutes. After the supernatant was aspirated, the cells were re-suspended in complete growth medium and seeded in T25 flasks (Greiner Bio One, Frickenhausen, Germany) with 7-8 ml of complete medium.
3.1.4
Subculturing of Cells
All cell types were grown in T75 flasks (Grenier Bio One, Frickenhausen, Germany) with 13-14 ml of complete medium in a 37°C incubator with 5% CO2. The cells were passaged to new flasks, on average, every 3 days, or when
they were around 80% confluent. For passaging, the growth medium was aspirated; flasks were washed with PBS. 0.5 - 1 ml Trypsin/EDTA solution was then added; flasks were kept in 37°C incubators for 5-8 minutes, until the cells detached from the surface. The cells were then collected with 7-8 ml complete growth medium and centrifuged at 1500 rpm for 5 minutes. The supernatant was aspirated; the cells were re-suspended in complete medium and were seeded to new flasks with the desired dilution.
3.1.5
Cryopreservation of Cells
For cryopreservation, freezing medium was prepared as 10% DMSO in FBS. The growth medium was aspirated; cells were washed with PBS, and trypsinized. After detachment, the cells were collected with complete medium and cen-trifuged at 1500 rpm for 5 minutes. Supernatant was aspirated and the cells were re-suspended in 2 ml PBS. They were centrifuged again at 1500 rpm for 3-5 minutes; supernatant was aspirated; and the cells were re-suspended in freezing medium. 1.5 ml of this was taken to 2 ml screw-capped cryotubes. The cryotubes were placed at - 20°C for 1-2 hours, and taken to - 80°C for 3-7 days after that. They were then placed and stored in liquid nitrogen.
3.1.6
Serum Starvation Treatment
Serum-deficient media were prepared, according to the cell type, as either DMEM or RPMI 1640 medium with 0.1% FBS instead of 10% FBS. The other additives in the media that were listed in Section 3.2 did not change. Serum starvation experiments were done for each of the 10 cell lines twice, at different times. (1st batch=set1-2, 2nd batch=set3-4).
For serum starvation experiments, 4 x T75 flasks were taken and 10 ml com-plete growth medium, specific to the particular cell type, was added to each. 3 x 10⁶ cells were seeded to each T75 flask. The cells were incubated with complete medium for 24 hours. After 24 hours, the medium was aspirated
other 2 flasks. The cells were incubated for 48 hours.
3.1.7
β-Estradiol (E2) Treatment
For E2 treatment, the growth medium of the cells were changed to phenol red-free Dulbecco’s MEM (F0475) (Biochrom AG, Berlin, Germany) with 5% charcoal/dextran-treated FBS (SH30068.02) (Hyclone, Logan, USA), 1% penicillin/streptomycin solution and 1% non-essential amino acids. To iden-tify the effects of estrogen on breast cancer cell lines, β-Estradiol (E2758) (Sigma Aldrich, Missouri,USA) was used as estrogen substrate.
E2 stock solution was prepared by dissolving 27.238 mg E2 in 50 ml 100% EtOH (32221) (Sigma Aldrich, Missouri, USA) so that the final concentra-tion of the stock soluconcentra-tion was 2 mM. The stock soluconcentra-tion was filtered and aliquoted to be stored in -20°C.
Final E2 treatment concentrations were 30 nM and 100 nM. For 30 mM final concentration, 0.75µl of 2 mM stock solution was added to 50 ml phenol red-free DMEM with 5% charcoal/dextran-treated FBS. For 100 mM final concentration, 2.5 µl of 2 mM stock solution was added to 50 ml phenol red-free DMEM with 5% charcoal/dextran-treated FBS.
The medium for 100nM E2 control group was prepared by adding 2.5 µl 100% EtOH to 50 ml phenol red-free DMEM with 5% charcoal/dextran-treated FBS.
MCF7 cells were counted and 12 x T75 flasks were seeded with 1 x 10⁶ cells. They were incubated with regular 10% DMEM growth medium (with phe-nol red) for 24 hours. After 24 hours, the media of the cells were changed to phenol red-free DMEM with 5% charcoal dextran-treated FBS. The cells were incubated with this medium for 72 hours. 72 hours later, the media was changed to phenol red-free DMEM with 0.1% charcoal/dextran-treated FBS (the rest of the additives from the 5% medium were not changed) in order to synchronize the cell cycles of the cells to be able to properly assess the effect of E2 treatment.
After 24 hours, the 0.1% FBS medium was aspirated. 12 ml of media was added to each flask, with four of them being the control medium, 4 of them being 30 mM E2 treatment medium and 4 of them being 100 nM E2 treat-ment medium. After 12 hours, 2 of the controls, 2 of the 30 nM treattreat-ments and 2 of the 100 nM treatments were collected as pellets. The rest were collected after 24 hours.
3.1.8
MTT Assay
MTT assay was done for all of the cell lines, in order to assess the effect of serum starvation treatment on proliferation of breast cancer cell lines. Vybrant® MTT Cell Proliferation Assay Kit (V13154) (Molecular Probes, Oregon, USA).
12 mM MTT stock solution was prepared by dissolving 5 mg MTT in 1 ml sterile PBS and stored at +4°C. SDS solution was prepared by dissolving 1 g SDS in 10 ml, 0.01 M HCl.
For MTT assay, 96-well plates (Greiner Bio One, Frickenhausen, Germany) were used. 150 µl of 10% growth medium per well was added according to the cell type. 12 wells were filled for each cell line and 5000 cells per well were seeded. The cells were incubated at 37°C for 24 hours. After 24 hours, the media in the wells were discarded by using a micropippette rather than aspirating the medium with glass pasteurs. Then the plate was inverted to get rid of the remaining medium. The wells were washed with 80-100 µl PBS; PBS was, again, discarded by a micropippette; and the plate was inverted to get rid of the remaining PBS. For each cell line, 150 µl of 10% medium was added to 6 wells and 150 µl of 0.1% medium was added to 6 wells. The cells were incubated at 37°C for 48 hours. After 48 hours, the media in the wells were removed by a micropippette and the plate was inverted to get rid of the remaining media. 100 µl fresh medium was added to the wells (10% medium was used for the control groups and 0.1% medium was used for the serum
each well and carefully mixed. The plates were incubated at 37°C for 4 hours. After 4 hours, 100 µl of SDS-HCl solution was added to each well and the plates were incubated at 37°for 12-18 hours. After the final incubation, each sample was mixed again, and absorbance was read at 570 nm with µQuant spectrophotometer (BioTek Instruments, Vermont, USA).
3.2
Gene Expression Analyses
3.2.1
Total RNA Isolation
At the end of serum starvation and β-Estradiol treatments, pellets of cells were collected by aspirating the medium, washing the flasks with PBS and trypsinizing them. 7-8 ml of media was added to collect the trypsinized cells and the cells were centrifuged at 1500 rpm for 5 minutes. The supernatant was aspirated and the cells were re-suspended in 1-2 ml PBS. They were centrifuged at 1500 rpm for 5 minutes and the supernatant was aspirated. The pellets were stored at -80°C until RNA isolation.
Before total RNA isolation, the cell pellets were taken from -80°C and were thawed on ice. Then they were lysed completely with 1 ml TRIzol Reagent (15596-026) (Life Technologies, California, USA). The lysates were taken to 1.5 ml tubes and 200 µl of chloroform was added to each tube. The tubes were shaken vigorously for 10-15 seconds until they homogenized and they were left to incubate for 3-5 minutes at room temperature. The tubes were centrifuged at 13.200 rpm for 17 minutes at +4°C. After the centrifugation, a clear phase can be seen. 500 µl of the clear phase were taken to new 1.5 ml tubes and 500 µl isopropanol was added to each tube in order to precipitate total RNA pellet. The tubes were gently inverted for a couple of times and they were left to incubate at room temperature for 10 minutes. They were then centrifuged at 13.200 rpm for 12 minutes at +4°C. The supernatant was discarded, the pellet was washed with 1 ml 75% EtOH and centrifuged at 8000 rpm for 8 minutes at +4°C. The supernatant was discarded, 1 ml 100% EtOH was added and the tubes were centrifuged again at 8000 rpm for 8
minutes at +4°C. The supernatant was discarded and the pellets were left under laminar flow to air dry.
After the pellets dried, they were dissolved in 30-40 µl Hypure Molecular Biol-ogy Grade water (SH30538.03) (Hyclone, Logan, USA). The measurements of the samples were taken with NanoDrop® ND-1000 spectrophotometer (Nan-oDrop Technologies, USA). The RNA samples were stored at -80°C.
3.2.2
cDNA Synthesis
Isolated total RNA was used in cDNA synthesis. cDNA synthesis was done with RevertAid First Strand cDNA Synthesis Kit (K1621) (Thermo Fisher Scientific, Massachusetts, USA) according to the manufacturer’s protocol. 1
µg (for serum starvation set3-4) - 1.5 µg (for serum starvation set1-2) total
RNA was taken to 0.2 ml tubes. 1 µl oligo(dT) primer was added and the mixture was completed to 12 µl total volume by adding nuclease-free water. Other reagents were added (4 µl of 5x Reaction Buffer, 1 µl of RiboLock RNase Inhibitor, 2 µl of 10 mM dNTP Mix, 1 µl of RevertAid M-MuLV Reverse Transcriptase; in that order) to complete the total volume at 20 µl. The tubes were incubated at 42°C for 60 min, followed by 5 minutes at 70°C to terminate the reaction. They were stored at - 20°C.
3.2.3
Oligonucleotides
Table 3.2: Primer sequences and their product sizes.
Gene Sequence Product Size
ANLN Forward 5’-TAAAGCAGGTGATTGTTCGG-3’ 180 bp
Reverse 5’-GTTCTTCATCAACACAGCAG-3’
CHRNA5_W* Forward 5’-TTAAGATGGAACCCTGATGACTATG-3’ Multiple
Reverse 5’-ATTGTTGGATCTCTTGGGCTTTTT-3’
CHRNA5_All Forward 5’-AGATGGAACCCTGATGACTATGGT-3’ 104 bp
Reverse 5’-AAACGTCCATCTGCATTATCAAAC-3’
CHRNA5_200 Forward 5’-CATCAGGTGTTGAAGATTGGAAAT-3’ 101 bp
Reverse 5’-AAAAAGCCCAAGAGATCCAACAAT-3’
CHRNA5_1000 Forward 5’-GGAAACTGAGAGTGGTAGTGGA-3’ 122 bp
Reverse 5’-CTTCAACAACCTCACGGACA-3’
CHRNA5_iso2† Forward 5’-TGGAGAATGGGAGATTGTGAGTGCA-3’ 78 bp Reverse 5’-CCAATCTTCAACAACCAGCAACAGC-3’
CHRNA5_iso3† Forward 5’-TGGAGAATGGGAGATTGTGAGTGCA-3’ 78 bp Reverse 5’-CCAATCTTCAACAACGGATACCAGC-3’
PS2‡ Forward 5’-CCATGGAGAACAAGGTGATCTGC-3’ 208 bp
Reverse 5’-TTAGGATAGAAGCACCAGGGGAC-3’
SDHAº Forward 5’-TGGGAACAAGAGGGCATCTG-3’ 86 bp
Reverse 5’-CCACCACTGCATCAAATTCATG-3’
TPT1 Forward 5’-GATCGCGGACGGGTTGT-3’ 100 bp
Reverse 5’-TTCAGCGGAGGCATTTCC-3’
* Adapted from Warzecha et al., 200973
† Adapted from Falvella et al., 201343 ‡Adapted from Alotaibi et al., 200674 ºAdapted from Gur-Dedeoglu et al., 200975
3.2.4
Polymerase Chain Reaction
Polymerase Chain Reactions were done using OneTaq Quick-Load Master Mix (M0486L) (New England Biolabs, Massachusetts, USA) after optimizing manufacturer’s protocol. The prepared PCRs and their reaction conditions are listed in Table 3.3 and Table 3.4, respectively.
Table 3.3: PCR reagents and their volumes.
PCR Reaction Volume
2x OneTaq QuickLoad Master Mix 12.5 µl Forward primer (10pmol) 0.5 µl Reverse primer (10pmol) 0.5 µl
cDNA 1 µl
DNase/RNase-free water 9.5 µl
Total 25 µl
Table 3.4: PCR conditions for specific primers.
PCR Steps CHRNA5_W, CHRNA5_All, SDHA,
CHRNA5_200 CHRNA5_1000 TPT1 Initial Denaturation 95°C, 5’ 94°C, 5’ 94°C, 5’ Denaturation 95°C, 30” 95°C, 30” 95°C, 30” Annealing 60°C, 90” 60°C, 30” 58°C, 30” Extension 72°C, 90” 72°C, 30” 72°C, 30” Number of cycles 35 40 40 Final Extension 68°C, 10’ 72°C, 5’ 72°C, 5’
’ denotes minutes, ” denotes seconds
3.2.5
Agarose Gel Electrophoresis
2% agarose gels were prepared by adding agarose to 1x TAE buffer. 1mg/ml ethidium bromide solution was added. After the gel polymerized, the wells were loaded with 10-12 µl PCR product. 4-5 µl GeneRuler 100bp DNA ladder (SM0241) (Thermo Scientific, Waltham, Massachusetts, USA) was used.
3.2.6
Quantitative Real Time-Polymerase Chain
tocol. Every sample in the plates, including negative controls, were done in duplicates.
LightCycler® 480 PCR Instrument (Roche Applied Science, Germany) was used as the PCR machine and LightCycler® 480 Multiwell Plate 96 (04729692001) (Roche Applied Sciences, Germany) was used as plate in these reactions.
The prepared PCRs and their reaction conditions are listed in Table 3.5 and Table 3.6, respectively. Same conditions were used for each of the qPCR primers.
Table 3.5: qPCR reagents and their volumes.
PCR Reaction Volume
LightCycler 480 SYBR Green I Master 5 µl
Forward primer (10pmol) 1 µl
Reverse primer (10pmol) 1 µl
cDNA 2 µl DNase/RNase-free water 1 µl Total 10 µl Table 3.6: qPCR conditions. PCR Steps Initial Denaturation 95°C, 5’ Denaturation 95°C, 10” Annealing 58°C, 20” Extension 72°C, 20” Number of cycles 45 Acquisition 95°C, 5” 55°C, 1’ 95°C, Continuous acquisition Final Extension 40°C, 10”
3.3
Analyses of Serum-Starvation qPCR
Re-sults
The results of the qPCR experiments were taken as Cts (Cq) calculated by the 2nd derivative method.
3.3.1
Detection of qPCR Outliers with Matlab
Several outlier detection methods exist in the literature for analyzing microar-ray data and other datasets.66, 76 It is important that the outlier detection is done carefully, so that only the extreme outliers are removed.77 If both of the technical duplicates of a sample as detected as outliers, they are not removed since this variation may pertain to the biological characteristics of the partic-ular sample. Outliers that result from technical problems can occur because of inhibition of PCR reactions and these can be detected by using a PCR kinetics approach.78 As well as using manual detection, researchers have also used existing softwares for the detection of unusually variable points in technical triplicates.79, 80 Standard deviations were also used as parameters within a study group with given restrictions (e.g. no more than a certain number of group members were excluded).80 Visual inspection of boxplots of the data, followed by a statistical analysis was also suggested as a method for outlier detection.66 According to this method, data points that fall outside the range of the box and whisker plots can be considered potential outliers. Using Grubb’s test has also been suggested for outlier detection and exclu-sion for qPCR data.66 In this test, whether a data point belongs to the population is tested based on the difference between the mean and the most extreme value upon normalization with the standard deviation. This provides a statistical measure of how much suspected outlier deviates from normal dis-tribution.81
lab® (version: 2008b) were used to write a code (Appendix A Table 7.1) in order to detect the outlier Ct values of qPCRs. It was run for starvation set1-2 and starvation set3-4 separately. The boxplots themselves represent the 25% to 75% of the data, and the whiskers have a default length of 1.5. This corresponds to approximately 99.3 coverage, assuming the data is nor-mally distributed. The working principle for the outlier detection code is as follows:
• It takes an xls file that contains both of the qPCR runs for a particular gene and a batch as input.
• It groups Ct values corresponding to each cell line and draws a boxplot (including both 10% and 0.1% values), separately for each cell line. • The boxplot shows whether or not there are any outliers in Ct values
for each cell line by marking it with a + sign.
• If there are any outliers, it detects the index of the outlier and replace that Ct value with ‘NaN’.
After the replacement is done, the newly generated files are manually checked and if there are any samples in which both of the duplicates are flagged, these are replaced with their original Ct values.
3.3.2
Geometric Mean of Reference Genes
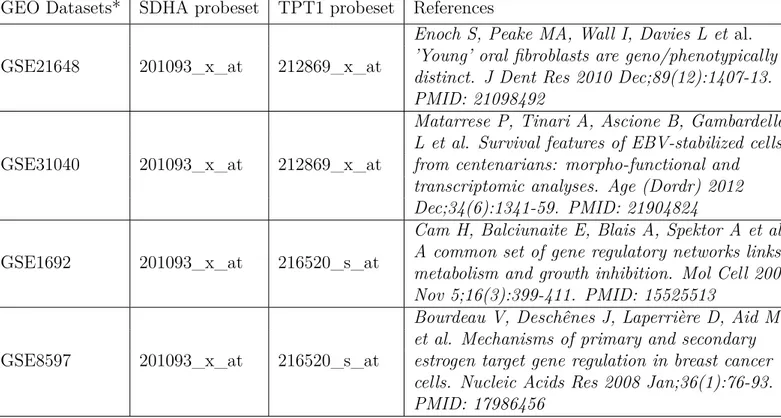
TPT1 and SDHA were chosen as reference genes and two runs of each was done for each set. Reference gene selection and the number of reference genes to be used are among important aspects of qPCR data normalization. It is assumed that RNA is converted to cDNA with equal efficiency and amount for each sample. A deviation from this expectation may result in sample variation attributable to either technical or biological issues and it is difficult to address which one is in effect. One solution to overcome the variations in RNA amounts in a qPCR run is the use of multiple reference genes for normalization.63 Another issue with the use of reference genes is deciding which gene is appropriate for a given condition. Recent studies have shown
that there is no uniform reference gene that can be used in all studies.79 We addressed whether TPT1 and SDHA, two commonly used reference genes, can be used to assess the amounts of RNA preparation in our serum starva-tion experiments. For this, we looked for Affymetrix microarray experiments that were conducted on serum starved samples in the GEO database. For each dataset, TPT1 and SDHA probesets were analyzed using GEO2R util-ity of the GEO database. Table 3.7 shows the names of the GSE datasets analyzed for TPT1 and SDHA probesets. Figures 7.1 to 7.6 in Appendix B show the expression values of TPT1 and SDHA in the control (no starvation) and treatment (serum starved) groups.
Table 3.7: GSE datasets that were analyzed for TPT1 and SDHA probesets. GEO Datasets* SDHA probeset TPT1 probeset References
GSE21648 201093_x_at 212869_x_at
Enoch S, Peake MA, Wall I, Davies L et al. ’Young’ oral fibroblasts are geno/phenotypically distinct. J Dent Res 2010 Dec;89(12):1407-13. PMID: 21098492
GSE31040 201093_x_at 212869_x_at
Matarrese P, Tinari A, Ascione B, Gambardella L et al. Survival features of EBV-stabilized cells from centenarians: morpho-functional and transcriptomic analyses. Age (Dordr) 2012 Dec;34(6):1341-59. PMID: 21904824
GSE1692 201093_x_at 216520_s_at
Cam H, Balciunaite E, Blais A, Spektor A et al. A common set of gene regulatory networks links metabolism and growth inhibition. Mol Cell 2004 Nov 5;16(3):399-411. PMID: 15525513
GSE8597 201093_x_at 216520_s_at
Bourdeau V, Deschênes J, Laperrière D, Aid M et al. Mechanisms of primary and secondary estrogen target gene regulation in breast cancer cells. Nucleic Acids Res 2008 Jan;36(1):76-93. PMID: 17986456
* NCBI GEO: archive for functional genomics data sets. 10 years on. Tanya Barrett, Dennis B. Troup,