USE OF HIGH-FREQUENCY GNSS SENSORS IN DYNAMIC
MOTIONS
Yusuf Hatay ÖNEN
1, Ahmet Anıl DİNDAR
2, Engin GÜLAL
3, Güray GÜRKAN
4, Koray
GÜRKAN
5and Burak AKPINAR
6ABSTRACT
Monitoring the engineered structures is becoming more vital in terms of reliable design of new and assessment of existing structures. As technological capabilities of the modern sensing instruments develop, different types of sensors have been in use as a part of monitoring systems. For the last two decades, the geosensors those are part Global Navigation Satellite Systems (GNSS) have rapidly gained popularity in studies such as crustal deformations and long-period structural systems (i.e. bridges, high-rises). GNSS system is indeed combination of GPS and GLONASS satellite constellations those were established by the USA and Russian governments, respectively. Due to its huge potential in scientific researches in addition to navigation, there have been several attempts to establish or improve satellite constellations such as Galileo by EU countries, Compass by China and IRNSS by India. Turkish Continuously Operating Reference Station (CORS-TR) network system has significantly improved the observation tolerances of the geosensors in scientific researchers. Hence, the studies aiming to give a better understanding in the use of GNSS sensors in monitoring the dynamic motions of the observation points either on the ground or on the top of a building is extremely important for near future. The results presented here have been acquired as a part of research project funded by Istanbul Kultur University in 2013 summer. The current study used a single-axis shake table for creating harmonic and random motions and the combination of LVDT, three-axis accelerometers and a GNSS receiver those measure at 50Hz, 110Hz and 100Hz, respectively. The synchronization of the data has been accomplished using GPS-based satellite clocks embedded to the sensors. The corrections of the GNSS receiver measurements were taken with respect to classical base station at 5km and CORS-TR networks. Very interesting results found in the comparison of the dynamic motion characteristics and the GNSS correction sources.
INTRODUCTION
Ground motion records used in the earthquake engineering are mainly depended on the lateral ground acceleration, and they have been recorded by accelerometer sensors since 1930’s. By the time, the analog sensors left their places to the digital instruments those are better in the data quality and also
1
Prof.Dr., Istanbul Kultur University, Istanbul/Turkey, [email protected]
2 Assoc.Prof.Dr.,Yildiz Technical University, Istanbul/Turkey, [email protected] 3 Assist.Prof.Dr., Istanbul Kultur University, Istanbul/Turkey, [email protected] 4 Assist.Prof.Dr., Istanbul Kultur University, Istanbul/Turkey, [email protected] 5
Dr., Istanbul University, Istanbul/Turkey, [email protected] 6 Dr., Yildiz Technical University, Istanbul/Turkey, [email protected]
with higher data sampling per second. As the researches realize that having more ground motion data in the high seismic regions provide a better understanding in the characteristics of the motions, the governmental agencies started setting up sensor networks for continuous monitoring the ground. Today, the modern accelerometers used in the continuous monitoring are capable of sampling 200 data per second and transmit the data from the station to the process centers where the network data is gathered using high-speed telecommunication infrastructure.
Another sensor type, GPS (Global Positioning System) or currently GNSS (Global Navigation Satellite System) has gained popularity in the determination and monitoring the ground displacements for the last 30 years. The principle of navigation satellites provides a perfect reference frame to the researchers who would like to study absolute motion of an observation point on Earth according to the selected International Terrestrial Reference System (ITRF) (Uzel et al, 2012). The technology of GNSS receivers and antennas have been in continuous development by both research institutions and commercial companies so that the accuracy and the capability of point positioning increased for more dynamic motions compared to the slow crustal deformations.
In recent years, structural health monitoring has become a major subject for civil engineers as increased number of tall buildings, bridges. By placement of high-tech accelerometers, inductive or laser based displacement sensors, it is possible to analyse the structure behaviour in static or under dynamic loads like earthquakes, winds, etc. and to check structural integrity. Because of the double integration of accelerometer data creates baseline offsets (Graizer, 1979) and weakness of accelerometers in rotational motions (Bock et al., 2011), Global Positioning System (GPS) receivers have also be used combined with accelerometers in relative displacement measurement.
Lovse et al. (1995) have measured structural vibration frequency of Calgary Tower, Canada using one at reference station (fix) and two differential 1 Hz rate GPS receivers. Tower was 160 m above ground level and they reported that under wind loading, a vibration frequency of 0.3 Hz. Hartinger and Brunner (1998) use GPS to detect landslide in Styria, Austria and the results of these tests show that an accuracy of nearly ±2 mm in position can be achieved. Tamura et al. (2002) demonstrate the feasibility of 10 Hz Real Time Kinematic (RTK) GPS (Leica MC1000) for wind-induced response measurements and its efficiency in measuring the displacement of a full-scale tower. They reported that the responses with amplitudes larger than 2 cm and natural frequencies lower than 2 Hz can be detected by RTK-GPS. Celebi and Sanli (2002), give results from operational deployment, at a 34-story San Francisco building, which consists of a GPS unit (Leica MC1000) and a tri-axial accelerometer are deployed at two diagonal corners of the roof of the building and a third GPS unit is deployed as a reference at the roof of a single-story. They reported that using a 10 Hz GPS, monitoring of long-period structures provide sufficiently accurate measurements of relative displacements such that dynamic characteristics of the vibrating systems can be accurately identified. Kijewski-Correa et al. (2006) documented the performance of a high-precision 10 Hz GPS (Leica MC500) in terms of its background noise and dynamic tracking ability, while providing position quality thresholds suitable for qualifying the accuracy of tracking in full scale. Roberts et al. (2004) present an integrated monitoring system consist of 10 Hz GPS receivers with accelerometers and the main natural frequencies of a monitored suspension footbridge are identified from the hybrid system. Brownjohn et al. (2004) studied the dynamic response of a 280 m building in Singapore with 10 Hz RTK GPS (Leica 530) and accelerometers. They reported that surprising results have been obtained about the relative importance of seismic and wind loading. Nickitopoulou et al. (2006) made a large number of experiments, in which harmonic movements were simulated by a rotating GPS receiver antenna, and the recorded coordinates were compared with the real ones. The outcome of this study was that in mid-latitude regions a simple monitoring system consisting of two GPS receivers and commercial data processing software permits a standard accuracy of up to 15 mm and 35 mm in horizontal and vertical coordinates, respectively, at 1.5% outlier level. Harmonic frequencies in the range 0.1Hz<f<0.5Hz to approximately 2 Hz can also be determined. By Li et al. (2006) an integrated system comprising of 20 Hz RTK GPS (Trimble) and accelerometers has been developed. GPS and accelerometers installed on a 108-m-high steel tower in Tokyo, together with other sensors such as anemometer and strain gauge. The seismic and wind-induced responses of the tower were analyzed using the Fast Fourier Transformation (FFT) and compared to results from finite element modeling (FEM). In order to study the system reliability, the correlated signals were extracted by applying a digital filtering technique and the filtered data sets were converted to displacement (in the case of
accelerometer data) and acceleration (in the case of GPS data) through double integration and double differentiation, respectively. The results agree with each other very well, although the static and quasi-static components are missing from the accelerometer-derived results. By Chan et al. (2006) a series of motion simulation table tests performed at a site, using three 20 Hz GPS (Leica GX1230) receivers, one accelerometer, and one motion simulation table that can simulate various types of motion defined by input wave time histories around a pre-defined static position. They reported that the motion simulation table test results showed that the GPS was susceptible to multipath and incapable of measuring high-frequency dynamic displacement response, while the accelerometer was incapable of measuring mean displacement and low-frequency dynamic displacement response. However, they report that after adopting the two integrated data processing algorithms, empirical mode decomposition (EMD) and an adaptive filter, the measurement accuracy of the total displacement was improved significantly. Park et al. (2007) has installed two accelerometers, and three 1 Hz GPS receivers on 66-story 234 m high building to measure and analyze the building’s response to yellow dust storm and typhoon. They were able to measure horizontal displacement in terms of static displacement component and dynamic variable displacement component, while torsional displacement was also measured to define completely the building’s movement under wind load. Kuang et al. (2011) search the characterization of the wind-induced resonant and slowly-varying (quasi-static) responses of a 260 m tall reinforced concrete building under ambient wind excitations based on 10 Hz GPS measurements. The equipment used includes two sets of orthogonally aligned accelerometers, two GPS (Topcon GB-1000) receivers. To verification of dynamic measurement accuracy of GPS, a GPS antenna was mounted on a computer-controlled mechanical shaker that simulated sinusoidal vibrations of adjustable frequency and amplitude to assess the dynamic measurement accuracy of the GPS. The shaker was set up in an open area with a reference base station placed approximately 10 m away from the device. They reported that the frequencies identified from the two types of measurements match each other well. The performance tests of the high-rate GPS data observation have been conducted by Wang and et al (2012) for three-axial shake table tests and also 2010 Chile Earthquake. In their test, a harmonic motion with predefined displacement pattern was created by a three-axial shake table where the three accelerometers and a dual frequency GNSS receiver were placed on the platform. The motions sent to the shake table were 2Hz sinusoidal motions with amplitudes of ±5 cm along each translational direction. The accelerometers recorded the motion data at 100Hz whereas the GNSS receiver sampled only 10 data per second. The comparison of the data from the accelerometer and geosensor revealed that the GNSS receivers have a great potential in the determination of an observation point’s horizontal motion. During the 2010 Chile Earthquake, a continuous reference station near the epicentre recorded GNSS signal at 1Hz which is the current sampling rate in geosensor measurements. The study shows that in the beginning of the earthquake, observations data was partially lost due to the interlocking problem for some satellites. Such an interlocking problem may occur by a combination of the movement of antenna and/or internal receiver clock. Solving this physical problem require extensive tests on the hardware of the receiver and also in the signal processing methodologies in the calculations.
By Lagbein et al. (2013) various different GNSS receivers and antennas were tested using different displacement signals programmed into a shake table. The motion of the shake table was measured independently using both an internal displacement transducer and an accelerometer mounted next to the GNSS antenna on the shake table. They reported that tests demonstrate that the GPS equipment has a frequency dependent response in that the observed position changes are dependent on the frequency content of the actual displacement. For frequencies less that 2 Hz, the GPS provides an accurate record of the displacements. However, at frequencies centered at 5 Hz, the GPS provides an amplified version of the displacement. At higher frequencies (> 8 Hz) the displacements observed by GPS are an attenuated.
In our work, similar and an addition to given previous studies, performance of a high-rate 100 Hz geodetic GNSS receiver is measured with a series shake table tests which is the part research project (Önen et al , 2012). This paper presents the use of high-rate GNSS observations those are corrected from the national Continuously Operating Reference Station (CORS-TR) system for dynamic motion of an observation point. Measured static and dynamic displacements, relative displacements from GNSS receiver are compared with known LVDT data and accelerometer’s double integration results.
TEST SETUP
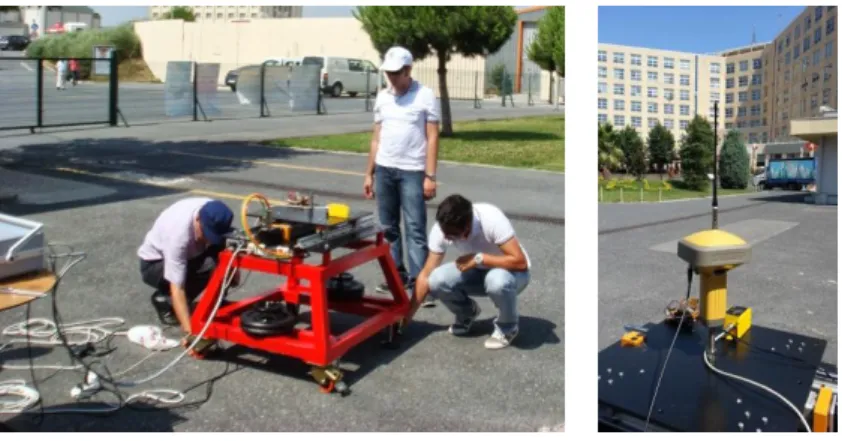
The measurement tests were conducted by using uniaxial shake table that was located in Istanbul Kültür University Atakoy Campus (N: 40.990439 E: 28.832354) where no obstructing element exists within elevation mask of 5 degree for GPS measurement (Figure 1). Extra care was given to provide a stable position and stability of the shake table during the test by using additional balancing load.
Figure 1. Test location and setup
The shake table system is operated through a compact servo-control and data acquisition unit. The control software is supplied by manufacturer and it is possible to control servo-driver to generate sinusoidal displacements with specific peaks and frequencies via this software. Maximum frequencies for ±80mm and ±1mm displacements are measured as 1 Hz and 10 Hz, respectively. Infinite screw driving 750W servo motor has a torque of 1.2 Nm and able to generate accelerations up to ± 2g and linear velocities up to ± 500 mm /sec.
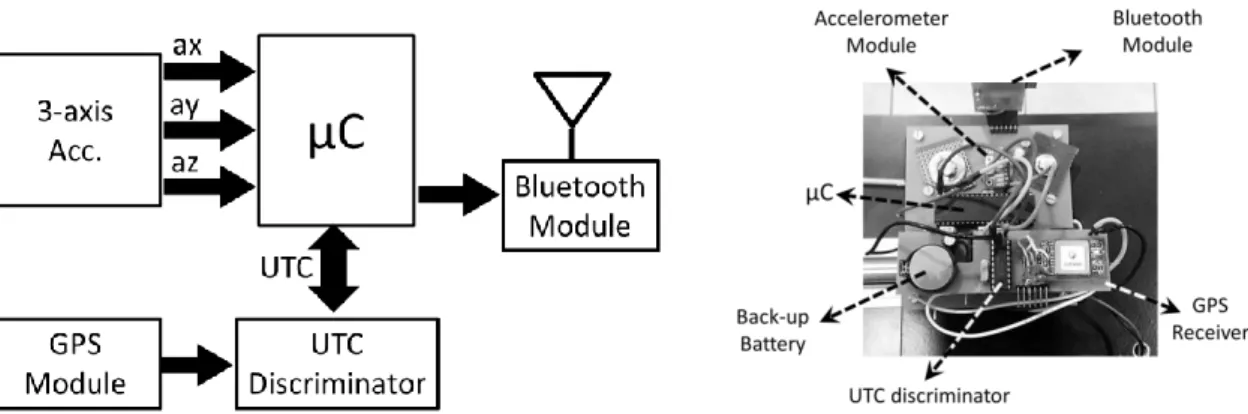
The measurement sensors placed on the shake table system is given in Fig. 2.
Figure 2. Test instrumentation
The data acquisition system consists of hardware and software components. The hardware part acquires acceleration signals from accelerometer and UTC time from GPS receiver, Fig. 3. The UTC time-stamped data is then transmitted using Bluetooth® protocol. The software enables the real-time recording, visualization and interpretation of acceleration data.
Figure 3. Accelerometer data acquisition unit
The chosen GPS receiver module (MediaTek - MT3329) has a maximum capacity of 66 channels in L1 band. In the test process of the GPS receiver module, the baud rate of UART communication was pre-adjusted to 57600 bits per second (bps) with a refresh rate of 1 Hz, only to send the string $GPRMC which is common in National Marine Electronics Association (NMEA) sentences. UTC discriminator checks whether any new data is available from GPS receiver module and extracts the concurrent UTC time from the incoming sentence starting with $GPRMC. The Bluetooth® module HC-06 realizes wireless transmission of data at a baud-rate of 57600 bps (Gürkan et al, 2013). The system is powered with a 9V battery and consumes approximately 1 W. A back-up battery of 3V is also included in the system to keep GPS on-board clock power on and retain module settings.
The Microsoft Windows® execution file of the system’s software is compiled using Microsoft Visual BASIC®. The software first sets one of the available virtual serial ports (COM ports) for Bluetooth® communication. The synchronization of UTC wall clock and local computer clock is updated in only MM:SS (minute and seconds) format with the “Sync” button since there exists an hour difference between UTC and local time (Istanbul/Turkey). As soon as the first data is received, a new “text” file (.txt) is generated with respect to concurrent computer date and time. The data stream, consisting of 3-axis floating point acceleration data, an assigned row number (with modulus 255), computer seconds and concurrent UTC time are instantaneously monitored in roll mode on PC screen which is cleared in every 500 samples.
To acquire high-precision GPS data, we have used commercially available 226 Channel GNSS receiver system (Topcon GR-5®). The system’s receiver unit uses a fence antenna technology and enables optional update rates (1 Hz to 100 Hz) of GNSS data. The device can use mobile network data correction servers using a built-in HSPA or CDMA cellular communication module. Under RTK data correction mode, the device’s accuracy is reported to be 10mm+1ppm in horizontal and 15mm+1 ppm in vertical direction. In static mode, the accuracy is reported to be 3mm+0.5ppm in horizontal and 5mm+0.5ppm in vertical direction. The receiver is able to output real time data formats such as TPS, RTCM SC104, CMR and CMR+. The NMEA 0183 version 2.x and 3.0 ASCII output formats are also available through the receiver.
The control software supplied by manufacturer is able to monitor and save acquired displacement sensor data. The displacement sensor is a built-in Linear Variable Differential Transformer (LVDT). The acquired LVDT data are stored in PC hard-drive by time-stamps merged referring to recording PC clock.
Experiments
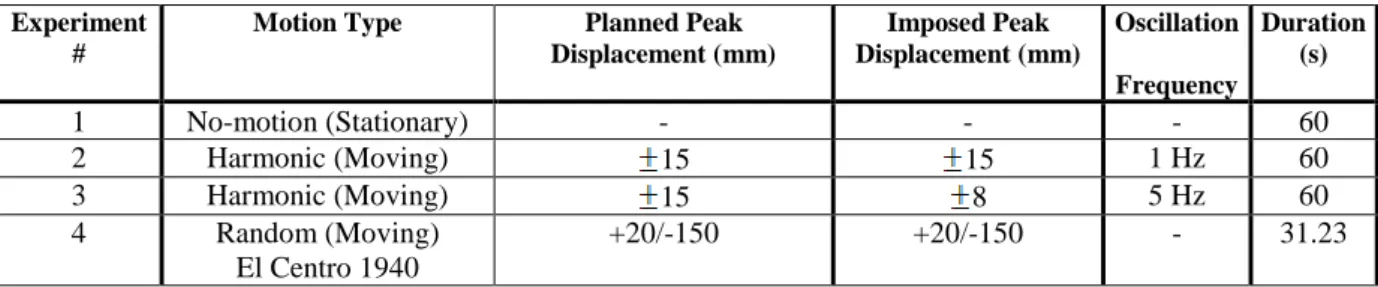
To assess the accuracy and performance of high-rate GPS and 3-axial accelerometer for displacement measurement, a series of field tests were conducted for sinusoidal shake harmonic with the amplitude of 15mm at 1 Hz and 5 Hz forcing frequencies and also random (representing earthquake record El Centro 1940 N-S) motions. In each of the test, 3-axial acceleration data (110Hz), high-rate GPS data (100 Hz) and reference LVDT (50Hz) data are recorded in ASCII files, Table 1.
Table 1. Information about the tests Experiment
#
Motion Type Planned Peak
Displacement (mm) Imposed Peak Displacement (mm) Oscillation Frequency Duration (s) 1 No-motion (Stationary) - - - 60 2 Harmonic (Moving) 15 15 1 Hz 60 3 Harmonic (Moving) 15 8 5 Hz 60 4 Random (Moving) El Centro 1940 +20/-150 +20/-150 - 31.23
No-Motion (Stationary) Test
The error margins of the measurement instruments can’t be observed during the motions due to the contribution of the high-frequency oscillations of the test setup, the latencies during the data transmission etc. Hence, the no motion (stationary) test was conducted prior the moving tests in order to see the measurement errors of the instruments. The 60seconds long data acquisition of the stationary table position reveals very stable acceleration records as shown in Fig. 4. The standard deviation of the horizontal acceleration data is estimated as 0.0035 and 0.0032 for x and y axis, respectively. On the other hand, the acceleration data opposite to the gravity direction has the deviation about 0.0082. However, the stationary tests show that the 3-axial accelerometer compiled has reasonable error in the measurement.
Figure 4. 3-axial accelerometer data during No-Motion test
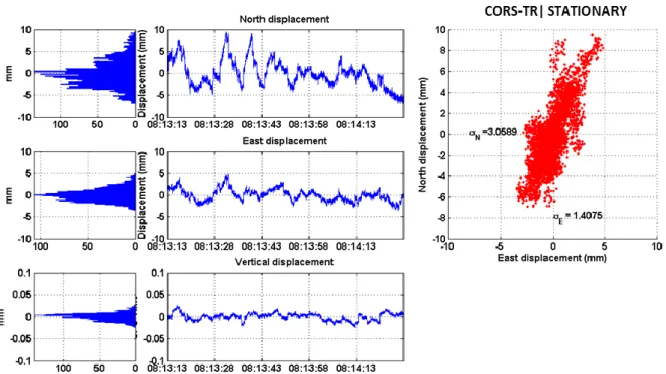
It is well-known that the error sources in the GNSS observations range from the atmospheric conditions to the internal clock inconsistency. Therefore, the accuracy of the GNSS kinematic measurements varies whether the data is processed in real-time and later (Eren et al, 2009). The error of the real-time kinematic GNSS processes range from 1-3cm in the North and East directions. As seen in Fig. 5, the horizontal movement of the GNSS antenna during the No-Motion test is within the range of +10mm/-7mm (in total 17mm and 3.05mm) and +5/-5mm (in total 10mm and mm) for North and East directions, respectively. Having these results, we can indicate the stability of the GNSS data measurement.
Figure 4. No-Motion test analysis of high precision GPS data
Harmonic (Moving) Tests
Two sinusoidal displacement patterns were applied in the harmonic (moving) tests. The most convenient harmonic dynamic motion is a sinusoidal displacement pattern with given amplitude and frequency. The uniaxial shake table has the capability of running sinus functions for different amplitude and frequencies. We have preferred to keep the amplitude of the harmonic motion at ±15mm while the frequencies were assigned as 1 and 5Hz for test 2 and 3, respectively. However, during the second test, it was noticed that the amplitude of the harmonic motion significantly dropped to ±8mm due to the mechanical characteristics of the shake table. In fact, this leaded us to examine the lowest displacement values to be determined by the GNSS sensors.
The accelerometer has a constant DC offset and a wideband noise characteristic on all axis, we have applied a digital Butterworth bandpass filter of order 4 to compensate these negative effects, fig. 5. The choice of bandpass filter center frequency is critical. Since we have applied known oscillation frequencies, we were able to select the precise center frequency for the filters. However, the relevant precision cannot be reached easily in real world applications. In order to compare the accelerometer values with absolute displacement sensor (LVDT) data, the acceleration measurement were transformed to displacement using double integration method.
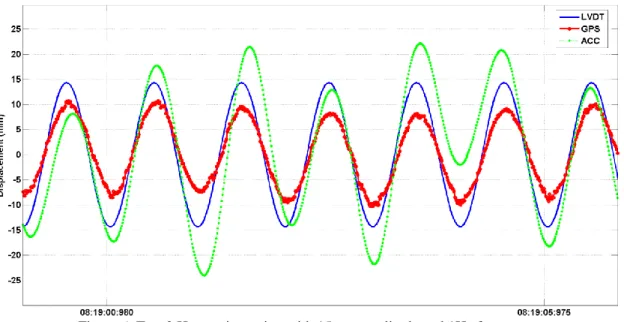
The measured data for LVDT, 3-axial accelerometer and GNSS sensors during the first moving test with 15mm amplitude and 1Hz frequency was plotted in Fig. 6. Since the all data of three different sensors were tagged according to precise satellite clock, the time synchronization for all data points was successfully achieved in the data acquisition. The five second window out of 60second long measurement shows that correlation between the GPS and LVDT values are better than the acceleration (ACC) and LVDT values.
Figure 6. Test 2 Harmonic motion with 15mm amplitude and 1Hz frequency
During the second moving test with 15mm expected but 8mm actualized amplitude and 5Hz frequency, in Fig. 7, the synchorinzation amd the amplitudes of the measured data seems much more better compared to first moving test. Particularly, the GPS and LVDT values are again in better correlation compared to the acceleration (ACC) and LVDT values.
Random (Moving) Test
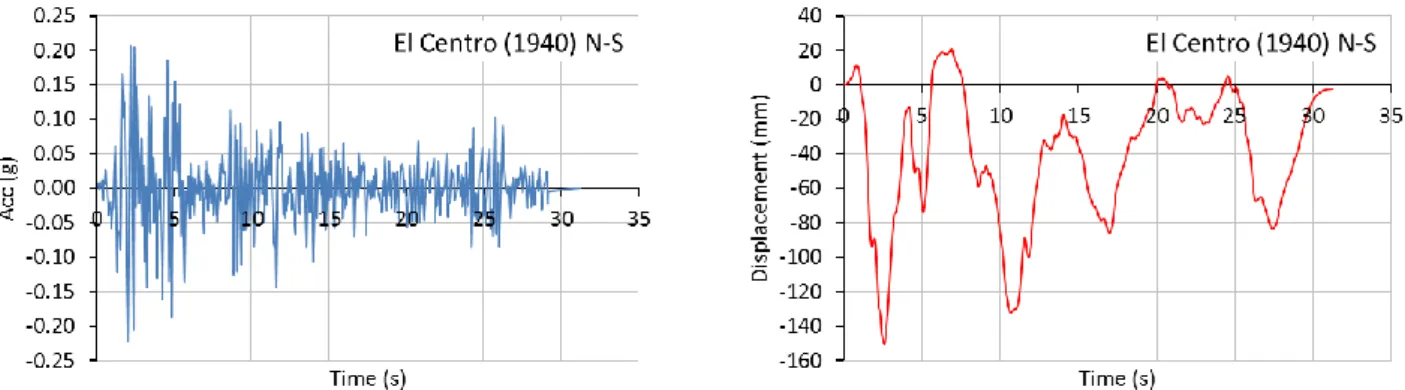
The last moving test (Test 4) was a random displacement motion that resembles the strong ground motion. The random motion data was selected as El Centro (1940) earthquake N-S acceleration record, Fig 8.
Figure 8. Test 4 Random motion acceleration and displacement pattern
The measured GNSS and LVDT data for the Test 4 were depicted in Fig. 9. Even if the sags and crests of the GNSS displacement data are consistent with the measured LVDT data, there are significant amplitude variations around the negative direction change areas. Even if the frequency of the random motion is about 0.2Hz (by counting the peaks throughout the duration), the amplitudes of the GNSS data is again less than the imposed data.
Figure 9. The GNSS and LVDT measured data in Test 4
CONCLUSIONS
Test for the performance comparison of the high-rate accelerometer and GNSS sensors during the dynamic motions were conducted on uniaxial shake tables as a part of research project. The followings are the summary and the conclusions of the experimental study.
The test instruments are LVDT, 3-axial accelerometer and a GNSS receiver with 50, 110 and 100Hz sampling frequencies.
The 3-axial accelerometer was produced for this study, hence both hardware and software was designed by the authors.
The time tagging for 3-axial accelerometer records were achieved by integrating a separate GPS module.
The GNSS receiver was set to observe the real-kinematic differential correction from the national CORS network.
One stationary and three moving motion test pattern used in the tests.
Two of the moving motion tests were realized for harmonic motions whereas the third test had random motion.
The harmonic motions were created for same amplitude (±15mm) with different forcing frequencies (1 and 5Hz). However, during the higher frequency test, the actual amplitude was recorded as ±8mm by LVDT sensor.
The comparison of the measured data from LVDT, 3-axial accelerometer and GNSS receiver reveals that the time synchronization has been successfully achieved.
The performance of measuring the dynamic motions for both 3-axial accelerometer and GNSS receiver is not adequate at low frequency tests compared to the high frequency test.
The form the displacement measurements of both 3-axial accelerometer and GNSS receiver are consistent with the LVDT. However, the amplitude of the GNSS receiver falls short in low frequency tests. This difference may arise from the inherent horizontal measurement error. This study shows that the high-rate GNSS receivers have great potential in the determination of the dynamic motions either harmonic of random form. However, there is a need to do more tests in order to examine performance of the high-rate GNSS receivers.
ACKNOWLEDGMENT
This study presented in this paper is part of a research project “Application of Dynamic Motion Measurement GNSS Systems” funded by Istanbul Kultur University (Project number: IKUARP111201010103).
REFERENCES
Brownjohn J, Rizos C, Tan GH and Pan T C (2004), “Real-time long-term monitoring of static and dynamic displacement of an office tower, combining RTK GPS and accelerometer data”, Proceedings of the 1st FIG International Symposium on Engineering Surveys for Construction Works and Structural Engineering, Nottigham,U.K., 28 June–1 July
Bock Y, Melgar D and Crowell BW, (2011), “Real-time strong-motion broadband displacements from 204 collocated GPS and accelerometers”, Bulletin of the Seismological Society America, 101(6), 2904–2925 Celebi M and Sanli A (2002) “GPS in Pioneering Dynamic Monitoring of Long-Period Structures”. Earthquake
Spectra, 18(1), 47-61
Chan W, Xu Y, Ding X, Xiong Y and Dai W (2006). ”Assessment of Dynamic Measurement Accuracy of GPS in Three Directions” J. Surv. Eng., 132(3), 108–117
Eren K., Uzel T., Gulal E., Yildirim O., Cingoz O (2009), “Results from a Comprehensive Global Navigation Satellite System Test in the CORS-TR Network: Case Study”, ASCE Journal of Surveying Engineering, 135(1), 10–18
Hartinger H, Brunner FK (1998), “Experimental detection of deformations using GPS”, Proceedings of IAG Special Commission 4 Symposium Eisenstadt, pp 145-152
Grazier V.,(1979), “Determination of the True Ground Displacements by using Strong Motion Records”, Izvestiya Phys Solid Earth, 15, 875-885
Gurkan K, Gurkan G, Dindar A.A., Akpinar B, Gulal E (2013), "Wireless 3-axis accelerometer system for measurement of structural displacement," Proceedings of the 8th International Conference on Electrical and Electronics Engineering (ELECO) , 28-30 November, 403-406
Kijewski-Correa T, Kilpatrick J, Kareem A, Kwon DK, Bashor R, Kochly M, Young BS, Abdelrazaq A, Galsworthy J, Isyumov N, Morrish D, Sinn RC and Baker WF (2006), “Validating the wind-induced response of tall buildings: a synopsis of the Chicago full-scale monitoring program”, J. Struct. Eng., 132 (10), 1509–1523
Kuang CL,Kwok KCS, Hitchcock PA and Ding XL, (2011), “Wind-Induced Response Characteristics of a Tall Building from GPS and Accelerometer Measurements”, Positioning, 2, 1-13
Langbein J, Evans JR , Blume F and Johanson I,(2013), “Response of Global Navigation Satellite System Receivers to Known Shaking between 0.2 and 20 Hertz”, U.S. Geological Survey Open-File Report 2013-1308
Li X, Linlin G, Ambikairajah E, Rizos C, Tamura Y and Yoshida A (2006), “Full-scale structural monitoring using an integrated GPS and accelerometer system”, GPS Solutions, 10(4), 233-247
Lovse JW , Teskey WF, Lachapelle G, and Cannon ME, (1995), “ Dynamic Deformation Monitoring of Tall Structure Using GPS Technology”, ASCE Journal of Surveying Engineering, 121(1), 16–22
Nickitopoulou A, Protopsalti K and Stiros A (2006), “Monitoring dynamic and quasi-static deformations of large flexible engineering structures with GPS: Accuracy, limitations and promises”, Engineering Structures, 28(10), 1471–1482
Park H, Shon H, Kim I, Park J, (2007), “Monitoring of structural behavior of high-rise buildings using GPS”, Proceedings of the 2004 Council on Tall Buildings and Urban Habitats Conference, 1064–1071
Roberts GW, Dodson AH, Cosser E, Barnes J and Rizos C (2004), “Impact of GPS satellite and pseudolite geometry on structural deformation monitoring: analytical and empirical studies”, Journal of Geodesy, 2, 809-822
Tamura Y, Matsui M, Pagnini L-C, Ishibashi R and Yoshida A,(2002). “Measurement of wind-induced response of buildings using RTK-GPS”, J. Wind Eng. and Industrial Aerodynamics, 90, 1783-1793
Önen YH, Gülal E, Dindar AA, Gürkan G, Gürkan K, Tiryakioğlu İ, “GNSS Esaslı Deplasman Ölçüm Yöntemlerinin Dinamik Sistemlerde Uygulanması (GNSS_ShakeTable)”, İKÜ Bilimsel Araştırma Projesi (IKUARP111201010103), (2012).
Uzel T, Eren K, Gulal E, Tiryakioglu İ, Dindar AA, Yilmaz H (2012), “Monitoring the tectonic plate movements in Turkey based on the national continuous GNSS network”, Arabian Journal of Geosciences, 6(9), 3573-3580
Wang G, Blume F, Meertens F, Ibanez P and Schulze M (2012), “Performance of High-Rate Kinematic GPS During Strong Shaking: Observations from Shake Table Tests and the 2010 Chile Earthquake”, Journal of Geodetic Science, 2(1), 15-30