Tamarindus indica L. Seed: Optimization of Maceration Extraction
Recovery of Tannins
Aleksandra Cvetanović1
&Sengul Uysal2,3 &Branimir Pavlić1 &
Kouadio Ibrahime Sinan4&Eulogio J. Llorent-Martínez5&Gokhan Zengin4
Received: 25 September 2019 / Accepted: 31 October 2019
# Springer Science+Business Media, LLC, part of Springer Nature 2019
Abstract
The seeds of Tamarindus indica L., classified as bio-waste, are powerful sources of bioactive compounds, especially tannins. In order to use its full potential, extraction of such bioactive constituents should be done under the optimized conditions. In the frame of this paper, central-composite experimental design and RSM (response surface methodology) were applied in order to investigate the impact of the maceration parameters on target responses and to optimize extraction process. Extraction was performed under the different levels of extraction solvent (methanol), temperature, and solvent-to-sample ratio. Obtained extracts were evaluated in terms of total phenols, flavanols, and tannin yield and in vitro antioxidant activity (DPPH, FRAP, CUPRAC). Experimental results were fitted to a second-order polynomial model where regression analysis and analysis of variance were used to determine model fitness and optimal extraction conditions. Optimized extraction conditions determined by RSM were methanol concentration of 69.99%, extraction temperature of 23.38 °C, solvent-to-sample ratio of 1:20. Chemical characteriza-tion of the extract obtained under the optimized condicharacteriza-tions was done by using HPLC-ESI-MS/MS technique. The study could provide a scientific baseline for designing novel functional products from T. indica seeds in further studies.
Keywords Tamarind . RSM . HPLC-ESI-MS/MS . Antioxidant . Bioactive compounds
Introduction
Tannins are natural polyphenolic compounds present in plants and are significant for food, leather industry, environmental, and medicinal applications. These compounds are classified into two groups namely hydrolysable and condensed tannins
(Shirmohammadli et al.2018). Previous research reported that Quercus sp. (oak bark), Castanea sativa Mill. (chestnut wood), Acacia mearnsii De Wild. (black mimosa bark), and Schinopsis balansae Engl. (quebracho wood) are the main sources of tannins for industrial purposes (Arbenz and Avérous 2015; Bele et al.2010; Lochab et al. 2014; Pizzi 1980). In addition, some agricultural wastes such as tea (Chowdhury et al.2016), coffee (Janissen and Huynh2018), grapes skin (Ricci et al.2017), and pomegranate peel (Ben-Ali et al.2018) are potential sources of tannins. In this sense, new studies on unexplored waste products for tannins recovery are of the utmost importance.
Tamarindus indica L., a member of Fabaceae family also known as Tamarind, is widely spread through tropical zones (Dey et al.2011). Various studies acknowledged that tamarind possesses numerous pharmacological properties namely anti-oxidant, antidiabetic, anti-inflammatory, and antimutagenic properties (Mahomoodally et al. 2016; Maiti et al. 2004; Martinello et al. 2006; Mootoosamy and Mahomoodally 2014; Ramos et al.2003; Rimbau et al.1996). Furthermore, several uses for Tamarind have been reported. For example, the leaves can be eaten as salads (Bhadoriya et al.2011) and the fruit is used as flavoring and ingredients in food products
Aleksandra Cvetanović and Sengul Uysal contributed equally to this work. * Sengul Uysal
1
Department of Biotechnology and Pharmaceutical Engineering, Faculty of Technology, University of Novi Sad, Novi Sad, Republic of Serbia
2
Erciyes University, Halil Bayraktar Health Services Vocational College, Kayseri, Turkey
3 Ziya Eren Drug Application and Research Center, Erciyes
University, Kayseri, Turkey
4
Department of Biology, Science Faculty, Selcuk University, Konya, Turkey
5
Faculty of Experimental Sciences, Department of Physical and Analytical Chemistry, University of Jaén, Jaen, Spain
including drinks (Van der Stege et al.2011). However, the tamarind seeds which are discarded during processing of fruit (Oluseyi and Temitayo2015) are a rich source of nutritional components such as proteins, minerals (e.g., calcium and magnesium), and amino acids (Olagunju et al.2018). In addi-tion to these nutriaddi-tional components, tamarind seeds are an excellent source of phenolic compounds (Brain and John 2014), especially tannins (Sudjaroen et al.2005). Several studies reported that the fruit wastes including peels and seeds contained a higher level of bioactive compounds compared to the edible parts (Ayala-Zavala et al.2011; Rudra et al.2015). Therefore, tamarind seeds have become one of the most at-tractive natural material in the scientific area (Doughari2006). The response surface methodology (RSM) is an effective technique for optimizing the process parameters (Pasandide et al. 2017; Uysal et al. 2019b), which is extensively employed in optimizing the extraction of phytochemical com-pounds including phenolic, tannin, and flavonoid from several plant samples (Krakowska et al.2018; Nabet et al. 2019; Pandey et al.2018). Many researches have used tools such as central composite design (CCD), Box Behnken design (BBD), Doehlert matrix (DM), and three-level factorial (3K) for RSM. Among these mentioned tools, central composite design (CCD) is most commonly used in food analysis (Ferreira et al.2019). Inspired by the above observation, the aim of the present study was to optimize the effect solvent, temperature, and solvent to sample ratio for maximizing the extraction of phenolic compound (especially tannin) of tama-rind seed.
Material and Methods
Plant Material
Tamarindus indica was purchased from the local market in Ivory Coast. Then, the seed was separated and dried naturally for 10 days. Dried seed was then powdered with a laboratory mill (Retsch SM 200). These seed samples (1 g) were macer-ated by methanol for 24 h (Mollica et al.2018). Extraction was done by using three parameters of solvent concentration, tem-perature, and solvent to sample ratio as independent variables, while other extraction parameters were held constant. The values of solvent concentration, extraction temperature, and solvent to sample ratio are summarized in Table1. Obtained extracts were filtered (by Whatman blue band) and evaporated in vacuum at 40 °C. All extracts were stored in a refrigerator for further analysis.
Experimental Design and Statistical Analysis
In this study, three levels, three-variable full factorial design (FFD) was employed to investigate and validate
the extraction parameters affecting the extraction of polyphenols content and antioxidant activity from Tamarindus indica seed. For the optimization of extrac-tion parameters, design consisted of 31 experiments with five replicates at central point. The parameters employed in the experimental design were in the ranges: temperature from 20 to 60 °C; sample-to-solvent ratio from 1:20 (w/v) to 1:40 (w/v); methanol concentration from 30 to 70%. Variables were coded according to the following Baş and Boyacı equation (Baş and Boyacı 2007). Used independent variables are presented in Table 1.
Obtained results were fitted to the second order polynomial model (Eq. (1)): Y¼ β0þ ∑4 i¼1βiXiþ ∑ 4 i¼1βiiX 2 iþ ∑ 3 i¼1 ∑ 4 j¼iþ1βijXiXj ð1Þ
where Y is the response variable, Xiand Xjare independent variables andβi,βii, andβijare the regression coefficients for intercept, linear, quadratic, and interception terms, respectively.
Design Expert software v. 10 (State-Ease, Minneapolis, Minnesota, USA) was used for the analysis of obtained experimental data. Statistical significance of the used model and lack of fit was determined by analysis of var-iance (ANOVA) and response surface analysis with the significance level of 0.05. Coefficient of determination (R2) and coefficient of variance (CV) were used as de-scriptive measure of the model adequacy, while response surface plot was used to describe the relationship between the response and independent variables.
Determination of Total Phenol Content
Total phenol content was measured using colorimetric assay according to the Folin–Ciocalteu reagent method (Mollica et al. 2017; Zengin et al. 2019). The results were expressed as milligram gallic acid equivalent per gram of extract (mg GAE/g extract).
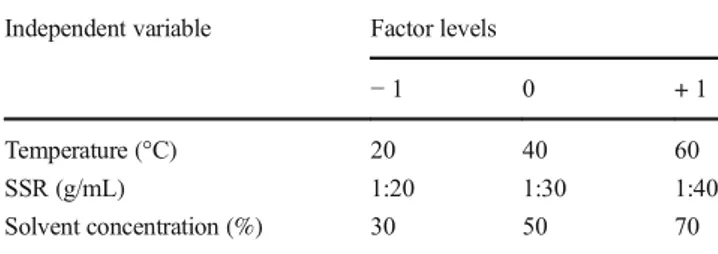
Table 1 The independent variables used in response surface methodology
Independent variable Factor levels
− 1 0 + 1
Temperature (°C) 20 40 60
SSR (g/mL) 1:20 1:30 1:40
Determination Total Flavanol Content
Total flavanol content was detected with DMACA (pdimethylaminocinnamaldehyde) method as described by (Zengin et al.2015). The results were evaluated as the equiv-alents of (+)-catechin equivequiv-alents (mg CE/g extract).
Determination of Total Condensed Tannin Content
Vanillin/H2SO4method was used to determine total con-densed tannin content with slight modifications (Zengin et al.2015). The results were expressed as equivalents of (+)-catechin (CEs) according to the equation obtained from the standard (+)-catechin graph (mg CE/g).
Determination of Antioxidant Activity
Antioxidant activity of the obtained Tamarindus indica ex-tracts was measured by using three different antioxidant as-says: DPPH (1,1-diphenyl-2-picrylhydrazyl), FRAP (ferric re-ducing antioxidant power), and CUPRAC assays carried out according to the (Uysal et al.2019a) procedure. Antioxidant activity was expressed as trolox equivalents (mmol TE/g).
HPLC-ESI-MS
nThe phytochemical profile was studied by means of an Agilent Series 1100 with a G1315B diode array detector and an ion trap mass spectrometer (Esquire 6000, Bruker
Table 2 Full factorial design with actual values of extraction conditions and experimentally obtained output values Independent variables Measured response
Temperature SSR Solvent TPC (mgGAE/g) TFC (mgCE/g) TTC (mgCE/g) DPPH (mmolTE/g) CUPRAC (mmolTE/g) FRAP (mmolTE/g) 60 1:30 50% 324.84 47.80 134.46 3.17 4.17 2.05 60 1:30 30% 310.66 70.26 219.62 2.10 4.05 2.09 40 1:20 30% 341.30 77.32 232.44 3.24 4.47 2.33 60 1:40 70% 341.32 94.07 270.06 3.42 5.04 2.57 60 1:20 30% 289.93 64.98 222.68 3.17 4.35 2.34 60 1:30 70% 351.08 86.50 282.47 3.74 5.45 2.92 20 1:40 50% 334.45 42.95 137.39 3.16 4.92 2.45 40 1:20 70% 346.84 74.61 274.24 3.67 5.24 2.85 40 1:20 50% 324.59 54.05 153.89 3.12 4.63 2.40 20 1:30 30% 244.55 55.39 181.62 2.63 3.81 2.09 40 1:40 70% 350.32 91.54 248.62 3.47 4.83 2.60 60 1:40 30% 283.83 76.09 188.54 3.04 4.23 2.19 40 1:40 50% 301.81 44.52 109.15 2.95 4.90 2.38 20 1:20 50% 341.08 58.86 160.08 3.38 5.17 2.93 40 1:30 70% 350.77 70.32 259.79 3.59 5.64 2.98 60 1:20 70% 353.22 73.79 279.92 3.87 5.61 2.97 20 1:40 70% 332.39 73.66 243.58 3.53 5.24 2.71 20 1:30 70% 357.34 81.29 263.68 3.78 5.73 2.89 40 1:40 30% 260.67 55.80 164.74 2.75 4.01 2.02 20 1:20 70% 292.95 99.33 149.87 3.86 5.93 3.16 60 1:20 50% 328.37 55.53 163.59 3.52 4.98 2.55 20 1:30 50% 309.29 47.44 123.29 3.14 4.77 2.35 40 1:30 50% 311.45 53.74 124.69 3.10 4.74 2.25 40 1:30 30% 243.87 54.47 163.46 2.10 3.78 1.93 20 1:20 30% 232.44 64.65 165.41 2.67 3.71 2.05 20 1:40 30% 227.16 43.92 89.12 2.31 3.75 1.92 60 1:40 50% 297.56 49.09 134.33 2.97 4.67 2.56 40 1:30 50% 351.77 43.87 177.67 3.64 4.91 2.33 40 1:30 50% 343.92 42.55 169.49 3.77 5.08 2.23 40 1:30 50% 361.25 44.32 190.01 3.64 4.95 2.53 40 1:30 50% 350.12 44.73 179.06 3.52 4.69 2.22
Daltonics) with an electrospray interface operating in negative mode. The separation of the compounds was performed using a Luna Omega Polar C18 analytical column of 150 × 3.0 mm and 5μm particle size (Phenomenex). Chromatographic con-ditions are detailed in a previous paper (Llorent-Martínez et al. 2018). Mass spectrometry was used for identification pur-poses, whereas quantitation was carried out by UV using suit-able analytical standards for each chemical family.
Results and Discussion
Influence of Independent Variables on Investigated
Outputs
With the aim to get Tamarindus indica seed extracts rich in bioactive compounds, in the first place polyphenol, flavanols, and tannins, and with high antioxidant capacity, the influence of extraction parameters (solvent concentration, temperature, and solvent-to-sample ratio) on aforementioned responses was investigated. For this purpose, f independent experiments were done, and the obtained results are presented in Table2.
Depending on the extraction conditions, total phenolic con-tent was in the range from 227.16 to 361.25 mg GAE/g representing the richness of the extracts in bioactive com-pounds. The lowest yield of TPC was achieved at temperature of 20 °C, using SSR of 1:40 (unit) and methanol in the con-centration of 30%. Increasing in extraction temperature (40
°C) and methanol concentration (50%) with decreasing in SSR (1:30) led to obtaining extract with the highest TPC. Significant and highly significant influence on TPC has qua-dratic and linear term of methanol concentration, respectively (Table3). The fitness of the model was confirmed by relative-ly low value of the coefficient of variance (CV = 7.61%), while the proper fitting of experimental and theoretical values was established by the moderately high value of the coeffi-cient of multiple determination (0.7413). Adequacy of the applied model was further suggested by significant p values (< 0.01) for the model and insignificant lack of fit (p > 0.05) (Table4). According to the determined values of regression coefficients, the polynomial model for TPC was given by the following equation: TPC¼ 338:33 þ 11:62X1−6:73X2þ 35:65X3−6:36X1X2 −9:78X1X3þ 10:25X2X3−12:13X21−7:50X 2 2−19:10X 2 3 ð2Þ
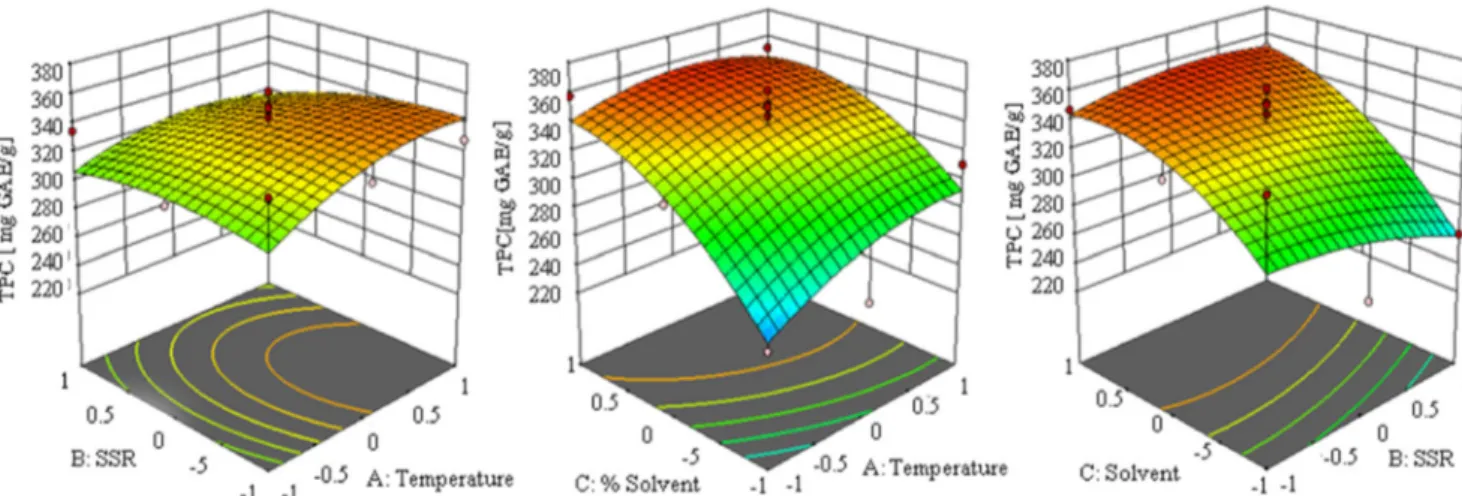
In order to illustrate the influence on investigated parameters on TPC, three-dimensional (3D) plots were constructed (Fig.1). As can be seen from Fig.1, increasing in extraction temperature and solvent concentration has a positive influence on TPC. However, the influence of temperature is weaker comparing to the influence of solvent concentration. Positive impact of tem-perature could be explained by direct improvement of mass trans-fer by increased diffusion and causing degradation of the com-pact cell wall structure of raw material, as well as improved penetration and solubility power of the applied solvent
Table 3 Regression coefficients of the predicted second-order model for the response variables
Regression coeficient TPC TFC TTC DPPH CUPRAC FRAP
β0 338.33* 45.40* 161.94* 3.32* 4.79* 2.32* Linear β1 11.62 2.81 21.20* 0.03 − 0.03 − 0.02 β2 − 6.73 − 2.86 − 12.03 − 0.16** − 0.14** − 0.12* β3 35.66* 10.12* 35.81* 0.50* 0.70* 0.37* Cross product β12 − 6.36 7.27* − 5.67 − 0.02 − 0.01 0.04 β13 − 9.78 − 3.94** − 1.61 − 0.07 − 0.18** − 0.07 β23 10.25 3.56 19.70** 0.00 − 0.09 − 0.04 Quadratic β11 − 12.13 2.51 − 10.51 − 0.06 0.01 0.07 β22 − 7.50 4.03 − 14.19 0.05 0.03 0.10 β33 − 19.10** 22.91* 71.18* − 0.15 − 0.11 0.04 Descriptive statistics R2a 0.741 0.910 0.809 0.715 0.864 0.849 CVb 7.61 9.64 15.32 9.70 5.66 6.56
*Highly significant p value (< 0.01) **Significant p value (0.01 < p < 0.05)
a
Coefficient of multiple determination
(Zeković et al.2017). Small changes in solvent concentration led to sharp increase in TPC which could be explained by improved selectivity of solvent towards moderately polar polyphenols. On the other hand, utilization of high SSR offers extracts with lower yield of phenols which was also confirmed with negative values of linear term of this parameter. Application of low SSR could also be beneficial from economical point of view that demands lower solvent consumption and provides production concentrat-ed liquid extract leading to further cost-effective processing into powder form (Pavlić et al.2017). In the case of total flavanols, the yield was in the range of 42.55 to 99.33 mg QE/g which was directly influenced by combination of extraction parameters. Namely, by combining temperature of 40 °C, SSR of 1:30 and
50% methanol extract with the lowest yield of flavanols was obtained. On the other hand, utilization of higher solvent concen-tration (70%) and lower SSR (1:20 m/v) with lower temperature (20 °C) offers extract with much higher flavanol content. Statistical analysis showed that content of flavanols was highly influenced by linear term of solvent concentration, quadratic term of solvent concentration, and cross product term of temperature and SSR (p < 0.01), while cross product term of temperature and solvent concentration expressed significant influence on TF. Descriptive statistical parameters confirmed fitness of the model (CV = 9.64%) and good fitting among theoretical and experi-mental values (R2= 0.910). ANOVA results confirmed good accordance between the model and experimental data according
Table 4 Analysis of variance (ANOVA) of the fitted second-order polynomial model for ex-traction yields and total phenol content
Source Sum of squares Degrees of freedom Mean of square F- value p - value Total phenolic content
Model 34,755.33 9 3861.70 6.687 0.00017
Residual 12,126.89 21 577.47
Lack of fit 10,672.52 17 627.80 0.31826
Pure error 1454.37 4 363.59
Total 46,882.23 30
Total flavanol content
Model 7733.42 9 859.27 23.667 4.74 × 10⁻⁹
Residual 762.45 21 36.31
Lack of fit 681.73 17 40.10 1.987 0.266125
Pure error 80.73 4 20.18
Total 8495.87 30
Total tannin content
Model 74,469.09 9 8274.34 9.878 9.15 × 10⁻⁶ Residual 17,591.02 21 837.67 Lack of fit 15,013.16 17 883.13 1.370 0.416049 Pure error 2577.86 4 644.47 Total 92,060.12 30 DPPH Model 5.17 9 0.57 5.868 0.00041 Residual 2.06 21 0.10 Lack of fit 1.79 17 0.11 1.579 0.35434 Pure error 0.27 4 0.07 Total 7.23 30 CUPRAC Model 9.69 9 1.08 14.854 3.11 × 10⁻⁷ Residual 1.52 21 0.07 Lack of fit 1.42 17 0.08 3.384 0.12320 Pure error 0.10 4 0.02 Total 11.21 30 FRAP Model 3.03 9 0.34 13.109 9.04 × 10⁻⁷ Residual 0.54 21 0.03 Lack of fit 0.47 17 0.03 1.685 0.32780 Pure error 0.07 4 0.02
to significant p value for the model (< 0.05) and insignificant lack of fit (p > 0.05) (Table4). According to the calculated values of regression coefficients, the polynomial model for TFC was given by the equation: TFC¼ 45:40 þ 2:81X1−2:86X2þ 10:12X3þ 7:27X1X2 −3:94X1X3þ 3:56X2X3þ 2:51X21þ 4:03X 2 2þ 22:91X 2 3 ð3Þ
Additionally, the influence of all three investigated parameters on TFC was presented graphically in Fig.2. It could be observed that 3D plots were noticeably different comparing to TPC; how-ever, influence of linear terms of extraction parameters of TFC was similar (Table3). Linear and quadratic term of solvent con-centration impact was the most prominent suggesting that higher TFC would be achieved by application of 70% methanol. However, it should be highlighted that temperature-solvent con-centration cross products exhibited significant negative impact on this response (Table3).
The third observed group of bioactive constituents in Ta m a r i n d u s i n d i c a s e e d e x t r a c t s w e r e t a n n i n s . Spectrophotometrically measured minimal content of total
tannins was 89.12 mg CE/g, and it was measured in the extract obtained at 20 °C, by using methanol in concentration of 30% applying SSR of 1:40 which was the same point where minimal TPC was achieved as well. Higher temperature and solvent centration with lower SSR led to extract in which maximal con-tent of tannins was measured, even 282.47 mg CE/g. Calculated p values of regression coefficients showed that total tannins yield was highly significant influenced by linear terms of temperature and solvent concentration as well as by quadratic term of meth-anol concentration (p < 0.01), while cross product term of SSR and solvent concentration had significant influence on TTC (0.01 < p < 0.05).
Behaviors of the system could be described by the polyno-mial model given in Eq. (4):
TTC¼ 161:94 þ 21:20X1−12:03X2 þ 35:81X3−5:67X1X2−1:61X1X3
þ 19:70X2X3−10:51X21−14:19X22þ 71:18X23 ð4Þ The values of two calculated descriptive parameters— coefficients of variance (15.32%) and coefficient of
Fig. 1 Influence of investigated inputs on total phenolic content in T. indica seed extracts
determination (0.809)—showed the confirmed fitness of the model and good matching of theoretical and exper-imental values, respectively.
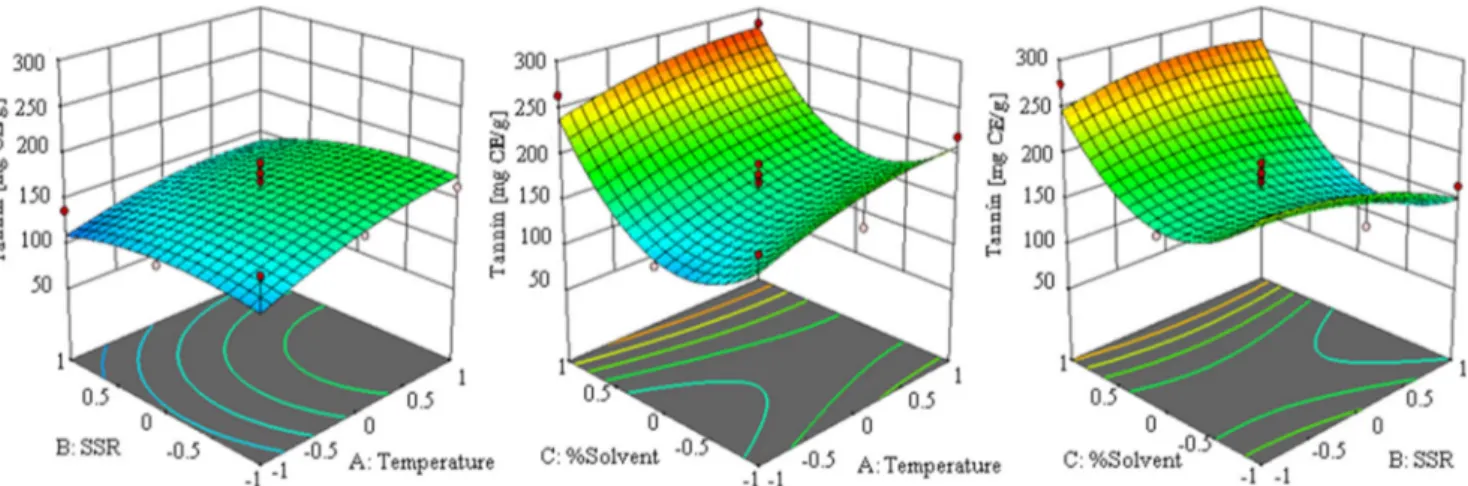
Simultaneous influence of different parametric combina-tions is graphically described in Fig.3. It was proven that increasing the methanol concentration up to certain level of degree had negative impact on TTC, but further increases have opposite effect. In the same time, it can be seen that by increasing SSR, the lower TTC could be obtained. On the other hand, increasing the temperature had positive impact on TTC increasing their yield. Since tannins contributed with high ratio in TPC, it could be expected that extraction param-eters would similarly affect these responses and that was the case with linear terms (Table3). Besides solvent concentra-tion, significant positive impact of temperature on TTC was observed which could be potentially explained by release of bound tannins due to rupture of plant matrix which occurs at elevated temperatures.
Bioactivity of the tested extracts was estimated by three different antioxidant tests: DPPH, CUPRAC, and FRAP whereby the influence of operational conditions on the activity was observed and established. Minimal
scavenger activity of the tested extracts against DPPH free radicals (2.10 mmol TE/g) was obtained in two points where under the SSR and methanol concentration had the values of 1:30 and 30%, respectively. On the other hand, the maximal ability of the extract to neutralize DPPH radicals was 3.87 mmol TE/g and was expressed by the extract obtained under the temperature of 60 °C, using SSR of 1:20 and methanol concentration of 70%. In the case of reduction capacity measured by CUPRAC as-say, the lowest activity (3.71 mmol TE/g) was expressed by the sample obtained under the following conditions: temperature 20°, SSR 1:20, and methanol concentration 30%. By keeping the same extraction temperature and SSR and applying higher methanol concentration (70%), the sample with the highest reduction capacity was ob-tained (5.93 mmol TE/g). These conditions also provide the extract with the highest reduction ability measured by FRAP assay (3.16 mmol TE/g). Simultaneously, in this point, the highest flavanol content was measured as well. On the other hand, using higher SSR (1:40) in a combi-nation with lower solvent concentration (30%) offers ex-tract with minimal FRAP activity (1.92 mmol TE/g).
Fig. 3 Influence of investigated inputs on total tanins content in T. indica seed extracts
The parameters of statistical significance of the models for DPPH, CUPRAC, and FRAP are given in the Tables 3 and 4. ANOVA results suggested good adequacy between the quadratic model and experimental results due to significant p value for the model (< 0.05) and insignificant lack of fit (p > 0.05) in all three cases. The p values of calculated regression coefficients showed that linear product terms of methanol concentra-tion and SSR had highly significant and significant influ-ence on DPPH extract’s activity, respectively. Appropriate matching of theoretical and experimental values was con-firmed by high value of coefficient of determination (0.715), while calculated value of coefficient of variance (9.70%) supports fitness of the model. The polynomial model for DPPH activity was described by the equation: DPPH¼ 3:32 þ 0:03X1−0:16X2
þ 0:50X3−−0:02X1X2−0:07X1X3 þ 0:06X2
1−0:05X22−0:15X23 ð5Þ
Combination of each two extraction parameters on DPPH activity of the obtained extracts is presented by 3D plots in Fig.4.
The plots from the Fig.4 clearly show that increasing in methanol concentration and temperature led to increasing of DPPH activity of the extracts. Significant negative impact of liner term of SSR singled out in the case of DPPH, CUPRAC, and FRAP (Table3) suggesting that low SSR would be opti-mal for improved activity. It is assumed that increase of SSR could cause extraction of concomitant compounds with low bioactivity reducing the content of antioxidants in obtained extracts.
The coefficients of determination of both reduction capac-ity assays (CUPRAC and FRAP) were high (0.864 and 0.849, respectively) which confirms good fit among experimental and theoretical values. In both cases, quite low values of co-efficients of variance (5.66 and 6.56%, respectively) confirm the fitness of the model. According to the results from the ANOVA test, polynomial models for CUPRAC and FRAP were obtained and are given in Eqs.6and7:
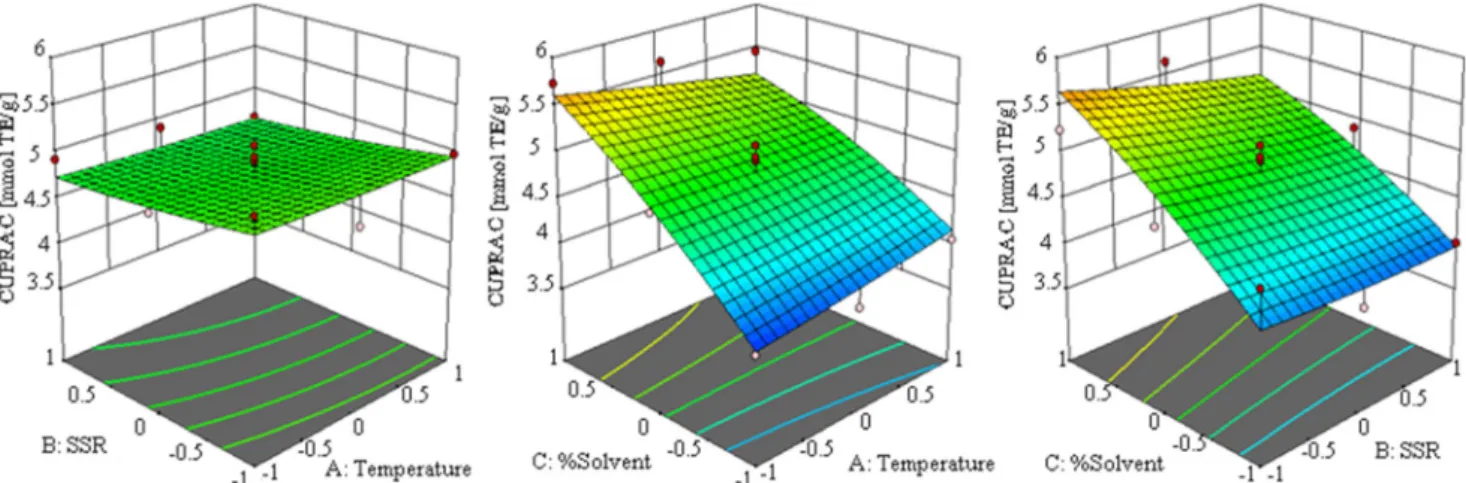
Fig. 5 Influence of investigated inputs on CUPRAC activity of T. indica seed extracts
CUPRAC¼ 4:79−0:03X1−0:14X2þ 0:70X3−0:01X1X2 −0:18X1X3−0:09X13þ 0:01X21þ 0:03X22−0:11X23 ð6Þ FRAP¼ 2:32−0:02X1−0:12X2þ 0:37X3þ 0:04X1X2−0:07X1X3 −0:04X13þ 0:07X2 1þ 0:10X22þ 0:04X23 ð7Þ A:Temperature = -0.830884 -1 1 B:SSR = -0.999978 -1 1 C:% Solvent = 0.999998 -1 1 TP [mg GAE/g] = 330.814 227.16 357.34 Flavonol [mg CE/g] = 90.2333 42.95 99.33 Tannin [mg CE/g] = 221.56 89.12 282.47 DPPH [mmol TE/g] = 3.9029 2.1 3.87
CUPRAC [mmol TE/g] = 5.83743
3.71 5.93
FRAP [mmol TE/g] = 3.16
1.92 3.16
Fig. 7 Numerical multi-response optimization results obtained to achieve maximal response values
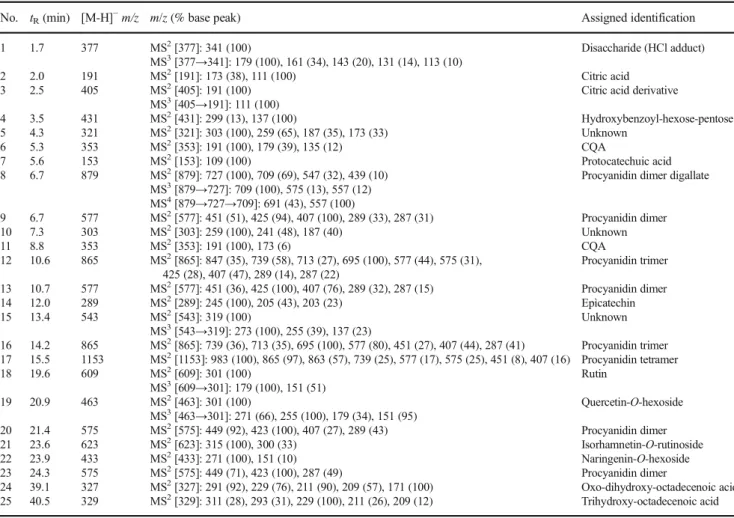
Table 5 Characterization of the compounds found in the analyzed extract of T. indica
No. tR(min) [M-H]−m/z m/z (% base peak) Assigned identification 1 1.7 377 MS2[377]: 341 (100) MS3[377→341]: 179 (100), 161 (34), 143 (20), 131 (14), 113 (10) Disaccharide (HCl adduct) 2 2.0 191 MS2[191]: 173 (38), 111 (100) Citric acid 3 2.5 405 MS2[405]: 191 (100) MS3[405→191]: 111 (100)
Citric acid derivative
4 3.5 431 MS2[431]: 299 (13), 137 (100) Hydroxybenzoyl-hexose-pentose 5 4.3 321 MS2[321]: 303 (100), 259 (65), 187 (35), 173 (33) Unknown 6 5.3 353 MS2[353]: 191 (100), 179 (39), 135 (12) CQA 7 5.6 153 MS2[153]: 109 (100) Protocatechuic acid 8 6.7 879 MS2[879]: 727 (100), 709 (69), 547 (32), 439 (10) MS3[879→727]: 709 (100), 575 (13), 557 (12) MS4[879→727→709]: 691 (43), 557 (100)
Procyanidin dimer digallate
9 6.7 577 MS2[577]: 451 (51), 425 (94), 407 (100), 289 (33), 287 (31) Procyanidin dimer 10 7.3 303 MS2[303]: 259 (100), 241 (48), 187 (40) Unknown 11 8.8 353 MS2[353]: 191 (100), 173 (6) CQA 12 10.6 865 MS2[865]: 847 (35), 739 (58), 713 (27), 695 (100), 577 (44), 575 (31), 425 (28), 407 (47), 289 (14), 287 (22) Procyanidin trimer 13 10.7 577 MS2[577]: 451 (36), 425 (100), 407 (76), 289 (32), 287 (15) Procyanidin dimer 14 12.0 289 MS2[289]: 245 (100), 205 (43), 203 (23) Epìcatechin 15 13.4 543 MS2[543]: 319 (100) MS3[543→319]: 273 (100), 255 (39), 137 (23) Unknown 16 14.2 865 MS2[865]: 739 (36), 713 (35), 695 (100), 577 (80), 451 (27), 407 (44), 287 (41) Procyanidin trimer 17 15.5 1153 MS2[1153]: 983 (100), 865 (97), 863 (57), 739 (25), 577 (17), 575 (25), 451 (8), 407 (16) Procyanidin tetramer 18 19.6 609 MS2[609]: 301 (100) MS3[609→301]: 179 (100), 151 (51) Rutin 19 20.9 463 MS2[463]: 301 (100) MS3[463→301]: 271 (66), 255 (100), 179 (34), 151 (95) Quercetin-O-hexoside 20 21.4 575 MS2[575]: 449 (92), 423 (100), 407 (27), 289 (43) Procyanidin dimer 21 23.6 623 MS2[623]: 315 (100), 300 (33) Isorhamnetin-O-rutinoside 22 23.9 433 MS2[433]: 271 (100), 151 (10) Naringenin-O-hexoside 23 24.3 575 MS2[575]: 449 (71), 423 (100), 287 (49) Procyanidin dimer 24 39.1 327 MS2[327]: 291 (92), 229 (76), 211 (90), 209 (57), 171 (100) Oxo-dihydroxy-octadecenoic acid 25 40.5 329 MS2[329]: 311 (28), 293 (31), 229 (100), 211 (26), 209 (12) Trihydroxy-octadecenoic acid
Illustration of the influence of each parameter as well as their combination on CUPRAC and FRAP activities is given in Figs.5and6, respectively.
Data from the Fig.5 shows that in the beginning, the in-creasing in SSR led to slight decreases in reduction activity, but after some points, the opposite effect has occurred; thus, the further increase in SSR led to increasing in reduction activity measured by CUPRAC assay. In the case of solvent concen-tration, it was noticed that increasing in methanol concentra-tion led to increase in the activity of the extracts. Statistical analysis implies that linear term of methanol concentration had highly significant impact on CUPRAC activity, which is illustrated in Fig.5where it can be seen that by increasing the solvent concentration, the CUPRAC activity sharply increases. Additionally, ANOVA results showed that cross product term of temperature and methanol concentration possess significant influence on CUPRAC. Similar cross product effect was ob-served in the case of TFC suggesting that elevated temperature combined with high solvent concentration would decrease of bioactivity and milder temperature should be used to prevent this.
In the case of FRAP activity, highly significant influence was expressed by both SSR and solvent concentration (p < 0.01). Both influences are clearly visible in 3D plots at Fig.6, where it can be also seen a positive impact of temperature on FRAP activity.
Optimization of Extraction Process
In order to find extraction conditions which will ensure extract with the highest of TPC, TFC, and TTC but also with the highest DPPH, CUPRAC, and FRAP ability, the optimization process was done. Previously used range of the parameters’ values was used for the optimization process as well. The obtained results suggest the following conditions: temperature of 23.38 °C, SSR of 1:20, and methanol concentration of 69.99%. Predicted values of the responses are given in Fig.7.
Phytochemical Characterization
Mass fragmentation data, used for individual phytochemicals characterization, is shown in Table5. Twenty-one compounds were identified or tentatively characterized in the obtained optimum conditions. Most of the identified compounds were procyanidins, along with epicatechin and glycosides of quer-cetin, isorhamnetin, and naringenin. These results are in agree-ment with previous studies in T. indica, in which a small number of phenolics have been previously reported (Razali et al. 2012; Sudjaroen et al. 2005). A brief explanation of the identification follows.
Compound 1 suffered the neutral loss of 36 Da (HCl) to yield the base peak at m/z 341, which exhibited the fragmentation
pattern typical of a disaccharide compound of two hexoses, most probably glucose. Compound 2, with [M-H]- at m/z 191 and base peak at m/z 111, corresponded to citric acid, whereas compound 3 was a derivative. Compound 4 displayed neutral losses of 132 Da (431→ 299) and 162 Da (299 → 137), so it was tenta-tively characterized as hydroxybenzoyl-hexose-pentose.
Compounds 6 and 11 presented deprotonated molecular ions at m/z 353 and base peak at m/z 191, characteristic of caffeoylquinic acids. Their mass spectra and retention times were compared with those of analytical standards, unequivo-cally identifying compounds 6 and 11 as neochlorogenic acid and chlorogenic acid, respectively. Compounds 7, 14, and 18 were also identified by comparison with the corresponding analytical standards of protocatechuic acid, epicatechin, and rutin, respectively.
Eight proanthocyanidins, all of them procyanidins (com-posed of (epi)catechin units), were characterized in the ana-lyzed extract of T. indica. Compound 8 was characterized as a procyanidin dimer digallate (Rockenbach et al.2012); com-pounds 9, 13, 20, and 23 were procyanidin dimers, whereas compounds 12 and 16 were trimers (Sarnoski et al.2012) and compound 17 a tetramer (Kajdžanoska et al.2010).
Compounds 19, 21, and 22 were flavonoid O-glycosides, displaying neutral losses of 162 Da (hexoside) and 308 Da (rutinoside) to yield quercetin (m/z 301), isorhamnetin (m/z
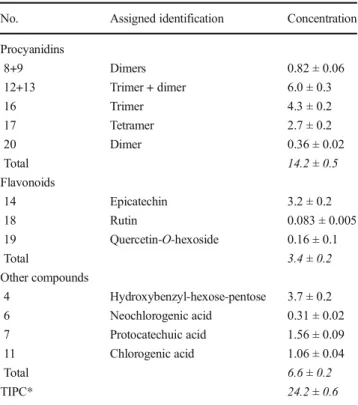
Table 6 Quantitation of the main phytochemicals in the analyzed extract of T. indica (mg g−1DE; n = 3)
No. Assigned identification Concentration Procyanidins 8+9 Dimers 0.82 ± 0.06 12+13 Trimer + dimer 6.0 ± 0.3 16 Trimer 4.3 ± 0.2 17 Tetramer 2.7 ± 0.2 20 Dimer 0.36 ± 0.02 Total 14.2 ± 0.5 Flavonoids 14 Epicatechin 3.2 ± 0.2 18 Rutin 0.083 ± 0.005 19 Quercetin-O-hexoside 0.16 ± 0.1 Total 3.4 ± 0.2 Other compounds 4 Hydroxybenzyl-hexose-pentose 3.7 ± 0.2 6 Neochlorogenic acid 0.31 ± 0.02 7 Protocatechuic acid 1.56 ± 0.09 11 Chlorogenic acid 1.06 ± 0.04 Total 6.6 ± 0.2 TIPC* 24.2 ± 0.6
TIPC total individual phenolic content.
315), and naringenin (m/z 271). The mass fragments were compared with both analytical standards and scientific literature.
Finally, compounds 24 and 25 were characterized as oxylipins (Van Hoyweghen et al.2014), a group of biologi-cally active compounds coming from the oxidative metabo-lism of polyunsaturated fatty acids.
Phenolic Quantification
Calibration graphs (0.5–100 mg mL−1) were prepared with the following analytical standards: chlorogenic acid, epicatechin, neochlorogenic acid, procyanidin B2, procatechuic acid, querce-tin, and rutin. Repeatability (n = 9) and intermediate precision (n = 9, three consecutive days) were lower than 3 and 8%, respec-tively. Thirteen compounds were individually quantified, and TIPC (total individual phenolic content) was defined as the sum of all the quantified compounds. Results are shown in Table6.
Procyanidins (dimers and trimers) accounted for approxi-mately 59% of TIPC, whereas compounds 4 (hydroxybenzyl-hexose-pentose) and 14 (epicatechin) were also abundant, representing 15 and 13% of TIPC, respectively. In a previous report in seeds and pericarp of T. indica fruits (Sudjaroen et al. 2005), authors also reported epicatechin and procyanidins as the main compounds, although in lower amounts than the ones here found: approximately 44% and 10% of the concentra-tions here observed for procyanidins and epicatechin, respec-tively. This result is due to the different morphological parts analyzed, although the trend in the main compounds is the same.
Acknowledgments Technical and human support provided by CICT of Universidad de Jaén (UJA, MINECO, Junta de Andalucía, FEDER) is gratefully acknowledged.
Compliance with Ethical Standards
Conflict of Interest Cvetanović, A. declares that she has no conflict of interest. Uysal, S. declares that she has no conflict of interest. Pavlić, B. declares that he has no conflict of interest. Sinan, K.I. declares that he has no conflict of interest. Llorent-Martínez, E.J. declares that he has no conflict of interest. Zengin, G. declares that he has no conflict of interest. Ethical Approval This article does not contain any studies with human or animal subjects.
Informed Consent Informed consent is not applicable in this study.
References
Arbenz A, Avérous L (2015) Chemical modification of tannins to elabo-rate aromatic biobased macromolecular architectures. Green Chem 17:2626–2646
Ayala-Zavala J et al (2011) Agro-industrial potential of exotic fruit byproducts as a source of food additives. Food Res Int 44:1866– 1874
Baş D, Boyacı İH (2007) Modeling and optimization II: comparison of estimation capabilities of response surface methodology with artifi-cial neural networks in a biochemical reaction. J Food Eng 78:846– 854.https://doi.org/10.1016/j.jfoodeng.2005.11.025
Bele AA, Jadhav VM, Kadam V (2010) Potential of tannnins: a review. Asian J Plant Sci 9:209–214
Ben-Ali S, Akermi A, Mabrouk M, Ouederni A (2018) Optimization of extraction process and chemical characterization of pomegranate peel extract. Chem Pap 8:2087–2100
Bhadoriya SS, Ganeshpurkar A, Narwaria J, Rai G, Jain AP (2011) Tamarindus indica: extent of explored potential. Pharmacogn Rev 5:73–81
Brain A, John M (2014) Phenolic content and antioxidant activity of selected Ugandan traditional medicinal foods. Afr J Food Sci 8: 427–434
Chowdhury A, Sarkar S, Chowdhury A, Bardhan S, Mandal P, Chowdhury M (2016) Tea waste management: a case study from West Bengal, India. Indian J Sci Technol 9:1–6
Dey S, Swarup D, Saxena A, Dan A (2011) In vivo efficacy of tamarind (Tamarindus indica) fruit extract on experimental fluoride exposure in rats. Res Vet Sci 91:422–425
Doughari J (2006) Antimicrobial activity of Tamarindus indica Linn. Trop J Pharm Res 5:597–603
Ferreira SL, Silva Junior MM, Felix CSA, da Silva DLF, Santos AS, Santos Neto JH, de Souza CT, Cruz Junior RA, Souza AS (2019) Multivariate optimization techniques in food analysis–A review. Food Chem 273:3–8
Janissen B, Huynh T (2018) Chemical composition and value-adding applications of coffee industry by-products: a review. Resour Conserv Recycl 128:110–117
Kajdžanoska M, Gjamovski V, Stefova M (2010) HPLC-DAD-ESI-MSn identification of phenolic compounds in cultivated strawberries from Macedonia. Maced J Chem Chem En 29:181–194
Krakowska A, Rafińska K, Walczak J, Buszewski B (2018) Enzyme-assisted optimized supercritical fluid extraction to improve Medicago sativa polyphenolics isolation. Ind Crop Prod 124:931– 940
Llorent-Martínez EJ, Zengin G, Lobine D, Molina-García L, Mollica A, Mahomoodally MF (2018) Phytochemical characterization, in vitro and in silico approaches for three Hypericum species. New J Chem 42:5204–5214
Lochab B, Shukla S, Varma IK (2014) Naturally occurring phenolic sources: monomers and polymers. RSC Adv 4:21712–21752 Mahomoodally MF, Mootoosamy A, Wambugu S (2016) Traditional
therapies used to manage diabetes and related complications in Mauritius: a comparative ethnoreligious study. Evid Based Complement Alternat Med 2016:1–25
Maiti R, Jana D, Das U, Ghosh D (2004) Antidiabetic effect of aqueous extract of seed of Tamarindus indica in streptozotocin-induced dia-betic rats. J Ethnopharmacol 92:85–91
Martinello F, Soares SM, Franco JJ, Santos AC, Sugohara A, Garcia SB, Curti C, Uyemura SA (2006) Hypolipemic and antioxidant activities from Tamarindus indica L. pulp fruit extract in hypercholesterol-emic hamsters. Food Chem Toxicol 44:810–818
Mollica A et al (2017) An assessment of the nutraceutical potential of Juglans regia L. leaf powder in diabetic rats. Food ChemToxicol 107:554–564
Mollica A et al (2018) Nutraceutical potential of Corylus avellana daily supplements for obesity and related dysmetabolism. J Funct Foods 47:562–574
Mootoosamy A, Mahomoodally MF (2014) Ethnomedicinal application of native remedies used against diabetes and related complications in Mauritius. J Ethnopharmacol 151:413–444
Nabet N, Gilbert-López B, Madani K, Herrero M, Ibáñez E, Mendiola JA (2019) Optimization of microwave-assisted extraction recovery of bioactive compounds from Origanum glandulosum and Thymus fontanesii. Ind Crop Prod 129:395–404
Olagunju OF, Ezekiel OO, Ogunshe AO, Oyeyinka SA, Ijabadeniyi OA (2018) Effects of fermentation on proximate composition, mineral profile and antinutrients of tamarind (Tamarindus indica L.) seed in the production of daddawa-type condiment. LWT-Food Sci Technol 90:455–459
Oluseyi EO, Temitayo OM (2015) Chemical and functional properties of fermented, roasted and germinated tamarind (Tamarindus indica) seed flours. Nutr Food Sci 45:97–111
Pandey A, Belwal T, Sekar KC, Bhatt ID, Rawal RS (2018) Optimization of ultrasonic-assisted extraction (UAE) of phenolics and antioxidant compounds from rhizomes of Rheum moorcroftianum using re-sponse surface methodology (RSM). Ind Crop Prod 119:218–225 Pasandide B, Khodaiyan F, Mousavi ZE, Hosseini SS (2017)
Optimization of aqueous pectin extraction from Citrus medica peel. Carbohydr Polym 178:27–33
Pavlić B, Naffati A, Hojan T, Vladić J, Zeković Z, Vidović S (2017) Microwave-assisted extraction of wild apple fruit dust— production of polyphenol-rich extracts from filter tea factory by-products. J Food Process Eng 40:e12508.https://doi.org/10.1111/ jfpe.12508
Pizzi A (1980) Tannin-based adhesives. J Macromol Sci A 18:247–315 Ramos A, Visozo A, Piloto J, Garcıa A, Rodrıguez C, Rivero R (2003)
Screening of antimutagenicity via antioxidant activity in Cuban me-dicinal plants. J Ethnopharmacol 87:241–246
Razali N, Mat-Junit S, Abdul-Muthalib AF, Subramaniam S, Abdul-Aziz A (2012) Effects of various solvents on the extraction of antioxidant phenolics from the leaves, seeds, veins and skins of Tamarindus indica L. Food Chem 131:441–448
Ricci A, Parpinello GP, Palma AS, Teslić N, Brilli C, Pizzi A, Versari A (2017) Analytical profiling of food-grade extracts from grape (Vitis vinifera sp.) seeds and skins, green tea (Camellia sinensis) leaves and Limousin oak (Quercus robur) heartwood using MALDI-TOF-MS, ICP-MS and spectrophotometric methods. J Food Compn Anal 59:95–104
Rimbau V, Risco E, Canigueral S, Iglesias J (1996) Antiinflammatory activity of some extracts from plants used in the traditional medicine of North-African countries. Phytother Res 10:421–423
Rockenbach II, Jungfer E, Ritter C, Santiago-Schübel B, Thiele B, Fett R, Galensa R (2012) Characterization of flavan-3-ols in seeds of grape pomace by CE, HPLC-DAD-MSn and LC-ESI-FTICR-MS. Food Res Int 48:848–855
Rudra SG, Nishad J, Jakhar N, Kaur C (2015) Food industry waste: mine of nutraceuticals. Int J Sci Environ Technol 4:205–229
Sarnoski PJ, Johnson JV, Reed KA, Tanko JM, O’Keefe SF (2012) Separation and characterisation of proanthocyanidins in Virginia type peanut skins by LC–MSn. Food Chem 131:927–939 Shirmohammadli Y, Efhamisisi D, Pizzi A (2018) Tannins as a
sustain-able raw material for green chemistry: a review. Ind Crop Prod 126: 316–332
Sudjaroen Y, Haubner R, Würtele G, Hull WE, Erben G, Spiegelhalder B, Changbumrung S, Bartsch H, Owen RW (2005) Isolation and struc-ture elucidation of phenolic antioxidants from Tamarind (Tamarindus indica L.) seeds and pericarp. Food Chem Toxicol 43:1673–1682
Uysal A, Ozer OY, Zengin G, Stefanucci A, Mollica A, Picot-Allain CMN, Mahomoodally MF (2019a) Multifunctional approaches to provide potential pharmacophores for the pharmacy shelf: Heracleum sphondylium L. subsp. ternatum (Velen.) Brummitt. Comput Biol Chem 78:64–73. https://doi.org/10.1016/j. compbiolchem.2018.11.018
Uysal S, Cvetanović A, Zengin G, Zeković Z, Mahomoodally MF, Bera O (2019b) Optimization of maceration conditions for improving the extraction of phenolic compounds and antioxidant effects of Momordica charantia L. leaves through response surface method-ology (rsm) and artificial neural networks (anns). Anal Lett 52: 2150–2163
Van der Stege C, Prehsler S, Hartl A, Vogl CR (2011) Tamarind (Tamarindus indica L.) in the traditional West African diet: not just a famine food. Fruits 66:171–185
Van Hoyweghen L, De Bosscher K, Haegeman G, Deforce D, Heyerick A (2014) In vitro inhibition of the transcription factor NF-κB and cyclooxygenase by Bamboo extracts. Phytother Res 28:224–230 Zeković Z, Bera O, Đurović S, Pavlić B (2017) Supercritical fluid
extrac-tion of coriander seeds: kinetics modelling and ANN optimizaextrac-tion. J Supercrit Fluids 125:88–95
Zengin G, Sarikurkcu C, Uyar P, Aktumsek A, Uysal S, Kocak MS, Ceylan R (2015) Crepis foetida L. subsp. rhoeadifolia (Bieb.) Celak. as a source of multifunctional agents: cytotoxic and phyto-chemical evaluation. J Funct Foods 17:698–708.https://doi.org/10. 1016/j.jff.2015.06.041
Zengin G, Stefanucci A, Rodrigues MJ, Mollica A, Custodio L, Aumeeruddy MZ, Mahomoodally MF (2019) Scrophularia lucida L. as a valuable source of bioactive compounds for pharmaceutical applications: in vitro antioxidant, anti-inflammatory, enzyme inhib-itory properties, in silico studies, and HPLC profiles. J Pharm Biomed Anal 162:225–233
Publisher’s Note Springer Nature remains neutral with regard to jurisdictional claims in published maps and institutional affiliations.