Journal Of European Social Policy
https://doi.org/10.1177/0958928717700565 Journal of European Social Policy 2018, Vol. 28(1) 86 –100 © The Author(s) 2017 Reprints and permissions:
sagepub.co.uk/journalsPermissions.nav DOI: 10.1177/0958928717700565 journals.sagepub.com/home/esp
Conceptualizing and
operationalizing social rights:
Towards higher convergent
validity in SCIP and CWED
H Tolga Bolukbasi
Bilkent University, Turkey
Kerem Gabriel Öktem
Bilkent University, Turkey; Bielefeld University, Germany
Abstract
There is widespread consensus in the comparative welfare state literature that the welfare state can be best conceptualized in terms of social rights of citizenship. The Social Citizenship Indicator Program (SCIP) and the Comparative Welfare Entitlements Dataset (CWED), which rely on operational definitions of quantified legislated social rights, constitute centrepieces of this thriving research. As leading state-of-the-art tools for capturing welfare stateness, these two datasets are being widely used. Scholars in general have also been treating them as interchangeable measurement tools. Upon closer inspection, however, we discover that the two datasets point to contrasting images of welfare state change for certain countries and time periods. This article aims to contribute to the scholarly exchange on the validity problem in measuring welfare state generosity. The exchange has hitherto been confined to problems of dataset choice with respect to only replacement rates, a set of key indicators included in both datasets. However, there are 11 key non-replacement rate indicators SCIP and CWED have in common, whose convergent validity has yet to be questioned. We thus explore the convergent validity of these non-replacement rate indicators across the two datasets. We then replicate the two leading composite indexes (Decommodification Index (DI) and Benefit Generosity Index (BGI)) constructed on the basis of these indicators. We identify problems of invalidity manifested in discrepancies in non-replacement rate indicator scores and index values for DI and BGI. We show how these discrepancies could lead to contrasting assessments of welfare state change. We then identify a set of potential sources for these discrepancies, most of which are related to different operationalizations of similar concepts. We conclude by calling for more dialogue among developers of SCIP and CWED to further clarify their conceptual and operational points of departure.
Keywords
Benefit Generosity Index, Comparative Welfare Entitlements Dataset (CWED), Decommodification Index, dependent variable problem, retrenchment, Social Citizenship Indicator Program (SCIP), social rights, validity, welfare state generosity
Corresponding author:
H Tolga Bolukbasi, Department of Political Science and Public Administration, Bilkent University, Ankara, 06800 Turkey. Email: [email protected]
Introduction
Welfare state generosity research has been a big suc-cess story in the comparative welfare state literature. One key source of its success has been its popular conceptual basis centring on T.H. Marshall’s formu-lation of ‘social rights of citizenship’. Many research-ers now assume that ‘social citizenship constitutes the core idea of a welfare state’ (Esping-Andersen, 1990: 21) and that the welfare state is a richly diverse catalogue of legislated social rights. Accordingly, conceptual definitions of the welfare state on the basis of social rights have ‘undoubtedly been the most influential conceptualization of the welfare state’ (Stephens, 2010: 511).
Although the Marshallian conceptualization of social rights dates back to the early postwar years, its widely popular operationalization emerged only in the 1980s. Walter Korpi and Gosta Esping-Andersen developed an operationalization aimed at gauging different dimensions through a set of indicators com-piled under the Social Citizenship Indicator Program (SCIP). In order to replicate these indicators which were not publicly available at the time, Lyle Scruggs constructed the Comparative Welfare Entitlements Dataset (CWED). These datasets provided research-ers with standardized measures enjoying high degrees of reliability when applied across countries and across time. Based on the indicators in the data-sets, their creators also developed composite indexes – the Decommodification Index (DI) and the Benefit Generosity Index (BGI) – aimed at capturing the multidimensional nature of social rights. In time, the research community came to treat these indicators and the composite indexes with increasingly sophis-ticated statistical techniques. They were also being used interchangeably in a growing literature. Thus, SCIP and CWED indicators, as well as DI and BGI, have emerged as standard state-of-the-art tools no welfare state specialist can afford to ignore.
Despite their wide popularity and their common points of departure, there have long been suspicions that the two datasets at times paint contrasting images of welfare state generosity (Scruggs and Allan, 2006). In response, the developers of SCIP and CWED have recently started a very fruitful con-versation in a symposium titled The Validity Problem
in Measuring Welfare State Generosity (henceforth,
the Symposium) where they discussed their respec-tive conceptual and operational definitions.1 The
Symposium largely centred on six replacement rates
datasets have in common. This exchange concluded that the two datasets, while departing from similar conceptual bases, pursued different operationaliza-tions for these indicators, and hence, any discrep-ancy would only be natural.
The Symposium, however, resolved the validity issues only partially. There are 11 non-replacement rate indicators on coverage, benefit eligibility, bene-fit duration, waiting days and sources of financing that SCIP and CWED have in common. Symposium participants, however, did not take up the issue of validity for these indicators. Although creators of CWED had suggested that at least for some coun-tries scores for non-replacement rate indicators were also different (Scruggs and Allan, 2006), Symposium participants assumed that these indicators ‘are likely to be more similar than the replacement rates data, since they come from similar sources and involve simpler coding decisions’. They also suggested that the ‘overall indexes using these additional data’, DI and BGI, ‘would be more similar across the two datasets than replacement rates alone’ (Danforth and Stephens, 2013: 1296).
In this article, we assess the empirical validity of these assumptions concerning the non-replacement rate indicators and the indexes. Methodologists have developed the term ‘convergent validity’ for examin-ing the degree to which different operationalizations constructed on the basis of identical conceptualiza-tions converge on one another. We evaluate whether these common indicators that SCIP and CWED share enjoy convergent validity, that is, whether the two measures developed to gauge the same concepts actually do so.
We find that the scores for some of these indica-tors are almost as disparate as those for replacement rates. Although we did not detect a systematic differ-ence across different welfare state programmes and across time, there are systematic differences across countries. Discrepancies in these indicators are not isolated cases; the indicators are used in constructing DI and BGI. These indexes are not only commonly used as dependent variables in comparative welfare
state research but are also increasingly used as inde-pendent variables in other bodies of literature explaining pressing social problems. Scholars, time and again, use these indicators as well as the indexes more or less interchangeably assuming that they gauge the same concept. Hardly any study uses these indicators at the same time or runs reliability checks against one another.2
In order to understand whether the discrepancies in the 11 indicators translate into differences in the composite indexes, we replicated DI and BGI on the basis of both SCIP and CWED data. In our analysis, we go beyond Scruggs and Allan’s seminal replica-tion in three ways: first, we rely on both SCIP and CWED data (both of which have been revised and updated since Scruggs and Allan’s replication); sec-ond, we include a time-series analysis; and, finally, we replicate both DI and an updated version of BGI. We found that the dataset choice in constructing each index does make a difference in overall index values. This is the case especially in time-series (and less so in cross-section) index values. These differences have serious ramifications for adjudicating between contending theoretical claims on welfare state change that are at the very heart of the perennial ‘dependent variable problem’ in the comparative lit-erature (Clasen and Siegel, 2007).
We build our argument through successive stages. Section ‘Social rights: state-of-the-art conceptualiza-tion of welfare stateness’ discusses the rise to promi-nence of social rights and introduces SCIP and CWED as state-of-the-art tools. Section ‘From con-ceptualizing to operationalizing social rights’ dis-cusses conceptualization and operationalization procedures in SCIP and CWED for their common indicators. After reviewing the recent debate on replacement rates, this section discusses whether the non-replacement rate indicators do follow similar conceptual and operational definitions. Section ‘Non-replacement rate indicators and convergent validity of SCIP and CWED’ compares the non-replacement rate scores across the datasets. Section ‘Comparing DI and BGI values: contrasting images of welfare state change’ replicates DI and BGI on the basis of SCIP and CWED data to verify whether differences in dataset scores actually suggest different assess-ments of welfare state change. Section ‘Potential
sources of discrepancies among the two datasets’ dis-cusses potential sources for the differences between the two datasets. Section ‘Conclusions’ concludes with a plea for a sustained conversation among the creators of both datasets to clarify further conceptual and operational differences.
Social rights: state-of-the-art
conceptualization of welfare
stateness
In conceptualizing ‘welfare stateness’, earlier stud-ies relied on ‘welfare effort’ measured through social expenditures side by side with detailed narratives relying on comparative historical methods during the 1970s (Amenta, 2003). While ‘welfare effort’ was a natural conceptual and operational definition for the more structural functionalist-oriented theo-ries of the time, scholars interested in more political conceptions (such as state redistribution and social citizenship) had been using social spending only as a second-best solution in the absence of ‘direct’ and ‘multidimensional’ measures for their conceptual definitions. The concept of the welfare state was all about power and contestation, and so its operation-alization had to reflect the very political nature of expanding the social rights of citizenship.
This new multidimensional conceptualization needed a new operationalization and the search began for new ways of measuring social rights directly (Stephens, 2010: 515). The solution was to construct different quantitative measures of social benefits provided through different welfare state programmes for regular workers. The original opera-tionalization was developed for the first time at the Swedish Institute for Social Research (SOFI) (Esping-Andersen, 1990; Korpi, 1989). The flagship of this research tradition, SCIP, was heavily influ-enced by the Marshallian notion of social citizenship (Korpi and Palme, 2008b: 2). The Program thus aimed to capture a variety of institutional character-istics of the key social security programmes that make up the welfare state: old age pensions, sick pay, unemployment and accident insurance. Based on this conceptualization focusing on entitlements, scholars with the Program operationalized social rights through quantifying essentially qualitative
social rights content in welfare state programmes. Although sometimes seen as ‘qualitative details’, such information is seen as ‘the institutional features that are the “rules of the game”’ themselves (Scruggs, 2008: 66). The underlying goal was to assign a score to what benefits a regular industrial worker would receive under existing social insurance legislation, the conditions under and the duration for which these benefits would be provided, and the potential and actual number of people who benefited from these programmes (Korpi and Palme, 2008b). In the literature that stemmed from this conceptualization and operationalization, much of the emphasis was placed on replacement rate indicators, which assess the degree to which social security programmes pro-vide benefits in proportion to wage levels. The use of other SCIP indicators has largely been limited to the construction of the DI.
It was with the aim of replicating this index that Lyle Scruggs created another dataset, CWED, in the early 2000s (Scruggs, 2004). Because Scruggs’ goal was to replicate the DI, CWED included only those indicators that were used to compute this index. Therefore, the first version of CWED contained some, but not all, indicators in SCIP. In time, CWED devel-oped as an increasingly independent dataset, especially after the revision and extension of the data published in CWED 2 (Scruggs et al., 2014a). In recent years, a number of new datasets extended the reach of the operationalizations based on social rights to other wel-fare state programmes, such as social assistance. These datasets include FLOOR (Financial Assistance, Land Policy and Global Social Rights) developed by Lutz Leisering and colleagues (Leisering, 2016) at Bielefeld University, SAMIP (Social Assistance and Minimum Income Protection Interim Data-Set) compiled by Kenneth Nelson (2007) at SOFI and EuMIN (Minimum Income Protection in Europe) developed by Thomas Bahle and colleagues (Bahle et al., 2011) at Mannheim University.
More than 25 years after their introduction, there has been emerging an implicit consensus on the superiority of conceptualizations and operationaliza-tions on the basis of social rights over those on wel-fare effort. This view has taken root in the literature such that ‘there has been a silent agreement that social rights-based measures are preferable for the
comparative analysis of welfare state generosity and change’ (Kühner, 2015: 202). This has been due less to the intrinsic pitfalls of social expenditures than the increasing sophistication and availability of quanti-fied social rights data. While these social rights– based summary measures shall not bring an ‘end to long-fought debates about best and second-best measures’ in comparative welfare state research, many researchers believe that they better reflect the ‘multidimensional character of the welfare state’ than any other measure (Kühner, 2015: 200). Moreover, quantified legislated social rights data provided researchers with measures enjoying high(er) validity (that may generally be associated with qualitative programme level data) and high(er) reliability (that social expenditure–based studies generally possess), hence capitalizing on the best of both possible worlds of measurement. Furthermore, these data lend themselves to making the most of them by using increasingly sophisticated statistical software packages. It is in this sense that these con-ceptualizations and operationalizations of welfare stateness on the basis of social rights emerge as the state-of-the-art tools in the comparative literature.
From conceptualizing to
operationalizing social rights
Shared conceptualizations, diverse
operationalizations: the case of
replacement rates
The increasing prominence of quantified legislated social rights datasets gave way to a recent debate on the ‘validity problem’ in this body of work. In the introductory article of the Symposium, Georg Wenzelburger et al. (2013) claimed that SCIP and CWED datasets do not measure their ‘dependent variable’ in the same way. When referring to the dependent variable, they confine their discussion only to replacement rates. They argue that the two datasets differ on both the level of and changes in replacement rates for many countries. Because of these differences, they warn, ‘not only diagnoses on the occurrence and intensity of welfare cutbacks vary considerably, but also the results on the deter-minants of welfare state change’ (Wenzelburger
et al., 2013: 1229). This led the authors to doubt whether these two leading operationalizations, SCIP and CWED, can overcome the ‘dependent variable problem’ in the literature altogether. Replying to Wenzelburger et al. (2013), the developers of both datasets concurred that the differences were largely rooted in different operationalizations of similar concepts, which reflected different but equally valid ways to measure replacement rates (Ferrarini et al., 2013; Scruggs, 2013). In terms of ‘central decisions and coding principles’, the creators of SCIP added that ‘datasets differ in their underlying theoretical framework for policy analysis and therefore capture different aspects of how welfare states secure the livelihood of citizens’ (Ferrarini et al., 2013: 1251, 1264).
This contention on replacement rates can more easily be followed with the help of Adcock and Collier’s (2001) classic framework on conceptualiza-tion, operationalization and measurement. When seen through this framework, social rights constitute what the authors (Adcock and Collier, 2001) call the ‘background concept’, which ‘encompasses the con-stellations of potentially diverse meanings associated with a given concept’ (p. 530). The two conceptual definitions under CWED and SCIP start from this same constellation of meanings. The conceptualiza-tion stage is not completed here, however. Next comes the ‘systematized concept’ which is the ‘spe-cific formulation of a concept adopted by a particular researcher or group of researchers’ (Adcock and Collier, 2001: 530). This is where SCIP and CWED seem to diverge. While SCIP prefers to systematize social rights through the Marshallian concept of ‘social citizenship’ (Korpi and Palme, 2008b: 2), CWED prefers to systematize them through ‘institu-tional commitments’ (Scruggs, 2008) or ‘institu‘institu-tional features of social insurance programs’ (Scruggs et al., 2014b: 2). Based on these different systematized con-cepts, SCIP and CWED use ‘replacement rates’ as what Adcock and Collier call ‘indicators’. However, their operationalizations of the seemingly same indi-cator essentially differ. For instance, the operational definitions of ‘type cases’ in SCIP and CWED are different, in terms of, among others things, age and work history of the ‘notional worker’ (Scruggs, 2013: 1270). In addition, Adcock and Collier (2001) add
that generating indicators involves ‘any systematic scoring procedure from simple measures to complex aggregated indexes’ (p. 530). Accordingly, based on different operational definitions of replacement rates, SCIP research group developed DI and CWED research group constructed BGI. When it came to the ‘scores for cases’ (applying indicators to produce scores), therefore, research groups follow different procedures and arrive at different results.
Shared conceptualizations and
operationalizations, but diverse scoring?
The case of non-replacement rate
indicators
The indicators SCIP and CWED have in common are not confined to replacement rates, however. There are other indicators both datasets cover on the dimensions of coverage, benefit eligibility, benefit duration and waiting days of the unemployment and sick pay programmes and on the dimensions of cov-erage, benefit eligibility and sources of financing of the old age pensions. On these indicators, however, there exists surprisingly no debate in the Symposium. Despite the fact that Scruggs and Allan (2006) sug-gested that at least for some countries scores for non-replacement rate indicators were also different, Danforth and Stephens assumed that non-replace-ment rate indicators in SCIP and CWED are more similar than replacement rate indicators. By implica-tion, they also assume that the widely popular DI and BGI ‘would be more similar across the two datasets than replacement rates alone’ (Danforth and Stephens, 2013: 1296). Unlike the case for replace-ment rates, therefore, there do not seem any differ-ences in the ‘background concept’, the ‘systematized concept’ and ‘indicators’ themselves. Identical con-ceptualization and operationalization processes for these indicators as such would suggest identical ‘scores for cases’. However, differences in opera-tionalization, as in the case of type cases mentioned above, might also lead to differences in these other indicators. Therefore, we believe that the assumed identity of these less often used indicators should be verified – as it was for the case for replacement rates. This issue is not a technicality. Differences in these
other indicators translate into differences in DI and BGI – indexes that directly shape our understanding of structure and change in welfare regimes. This arti-cle sets out to verify this issue. Are the scores for non-replacement rate indicators SCIP and CWED have in common actually identical or at least more similar than those for the replacement rates? And accordingly, would DI and BGI report similar values when calculated on the basis of indicator scores of both datasets?
Non-replacement rate indicators
and convergent validity of SCIP
and CWED
In this section, we begin with a brief discussion on ‘convergent validity’ we borrow from the research design literature. We then provide the operational definitions of non-replacement rate indicators in CWED and SCIP. Finally, we evaluate the conver-gent validity of these indicators by comparing the indicator scores in SCIP and CWED.
Convergent validity is ‘the degree to which [an] operationalization is similar to (converges on) other operationalizations to which it theoretically should be similar’. Thus, two indicators enjoy convergent validity ‘if measures of constructs that theoretically should be related to each other are, in fact, observed to be related to each other’ (Trochim et al., 2015: 132). In more technical terms, convergent validity is high ‘if the correlations of independent measures of the same trait (monotrait–heteromethod correla-tions) are significantly different from 0 and suffi-ciently large’ (Eid, 2010: 255). To this end, we examine whether there are similarities in the scoring for these 11 non-replacement rate indicators across SCIP and CWED, which supposedly share the same conceptualization and operationalization. These data represent 11 indicators that are beyond the replace-ment rates: coverage, qualification period, benefit duration, waiting days, and sources of financing.3
Three of the indicators represent the institutional characteristics of the unemployment programme, and another three represent the sickness insurance programme. Two indicators capture characteristics of the pension system. Finally, for each of the three social security branches, there is a coverage
indicator. These 11 non-replacement rate indicators, together with the replacement rate indicators, make up DI and BGI (Scruggs, 2014).
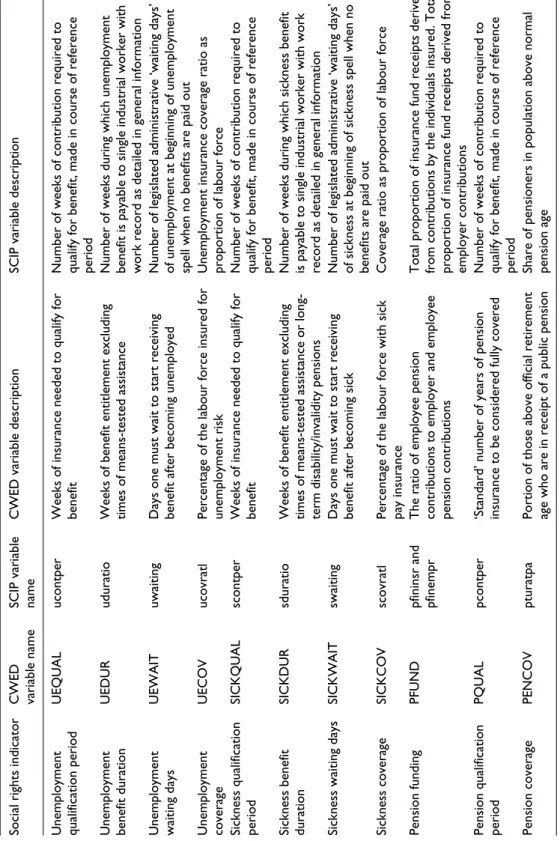
Before comparing the data points for these non-replacement rate indicators, we needed to make sure that they are indeed comparable, that is, that there are no significant differences in conceptualization and operationalization. Table 1 provides a list of non-replacement rate indicator descriptions for this purpose. The table shows that at least in one case – pension funding – SCIP and CWED operationalize the same concept in different ways. CWED defines this as an indicator capturing the degree to which the employee finances his pension himself, by dividing employee contributions to the sum of employee and employer contributions. SCIP, on the other hand, defines it as the share of employee contributions by dividing employee contributions to the sum of the contributions from employees, employers, the state and others. These different operationalizations natu-rally produce different results, and the indicators are therefore not directly comparable. In order to be able to compare these two pension funding indicators, we computed an indicator for SCIP that is equivalent to the CWED’s definition of pension funding.4
Judging by the descriptions of these indicators in SCIP and CWED codebooks, it appears that the oper-ationalizations for all the indicators (except for the pension funding indicator) are identical. Given this information, one could assume that these indicators are indeed comparable. There is a parameter which may lead to differences in scores for these indicators: the type cases. The notional worker in SCIP is assumed to be 30 years old (with 10 years of work history), whereas in CWED he is 40 years old (with 20 years of work history) (Scruggs, 2013: 1270).
We now turn to verify whether the scores for indi-cators in Table 1 are indeed ‘more similar than the replacement rates’ (Danforth and Stephens, 2013: 1296). In order to do so, first, we compare the data for each of these indicators for all common data points for 18 countries (Australia, Austria, Belgium, Canada, Denmark, Finland, France, Germany, Ireland, Italy, Japan, the Netherlands, New Zealand, Norway, Sweden, Switzerland, United Kingdom and United States). Because CWED reports yearly data from 1970 onwards and SCIP reports data in 5-year intervals, we
Table 1.
CWED and SCIP non-replacement rate indicators.
Social rights indicator
CWED variable name SCIP variable name
CWED variable description
SCIP variable description
Unemployment qualification period
UEQUAL
ucontper
Weeks of insurance needed to qualify for benefit Number of weeks of contribution required to qualify for benefit, made in course of reference period
Unemployment benefit duration
UEDUR
uduratio
Weeks of benefit entitlement excluding times of means-tested assistance Number of weeks during which unemployment benefit is payable to single industrial worker with work record as detailed in general information
Unemployment waiting days
UEWAIT
uwaiting
Days one must wait to start receiving benefit after becoming unemployed Number of legislated administrative ‘waiting days’ of unemployment at beginning of unemployment spell when no benefits are paid out
Unemployment coverage
UECOV
ucovratl
Percentage of the labour force insured for unemployment risk Unemployment insurance coverage ratio as proportion of labour force
Sickness qualification period
SICKQUAL
scontper
Weeks of insurance needed to qualify for benefit Number of weeks of contribution required to qualify for benefit, made in course of reference period
Sickness benefit duration
SICKDUR
sduratio
Weeks of benefit entitlement excluding times of means-tested assistance or long- term disability/invalidity pensions Number of weeks during which sickness benefit is payable to single industrial worker with work record as detailed in general information
Sickness waiting days
SICKWAIT
swaiting
Days one must wait to start receiving benefit after becoming sick Number of legislated administrative ‘waiting days’ of sickness at beginning of sickness spell when no benefits are paid out
Sickness coverage
SICKCOV
scovratl
Percentage of the labour force with sick pay insurance
Coverage ratio as proportion of labour force
Pension funding
PFUND
pfininsr and pfinempr The ratio of employee pension contributions to employer and employee pension contributions Total proportion of insurance fund receipts derived from contributions by the individuals insured. Total proportion of insurance fund receipts derived from employer contributions
Pension qualification period
PQUAL
pcontper
‘Standard’ number of years of pension insurance to be considered fully covered Number of weeks of contribution required to qualify for benefit, made in course of reference period
Pension coverage
PENCOV
pturatpa
Portion of those above official retirement age who are in receipt of a public pension Share of pensioners in population above normal pension age
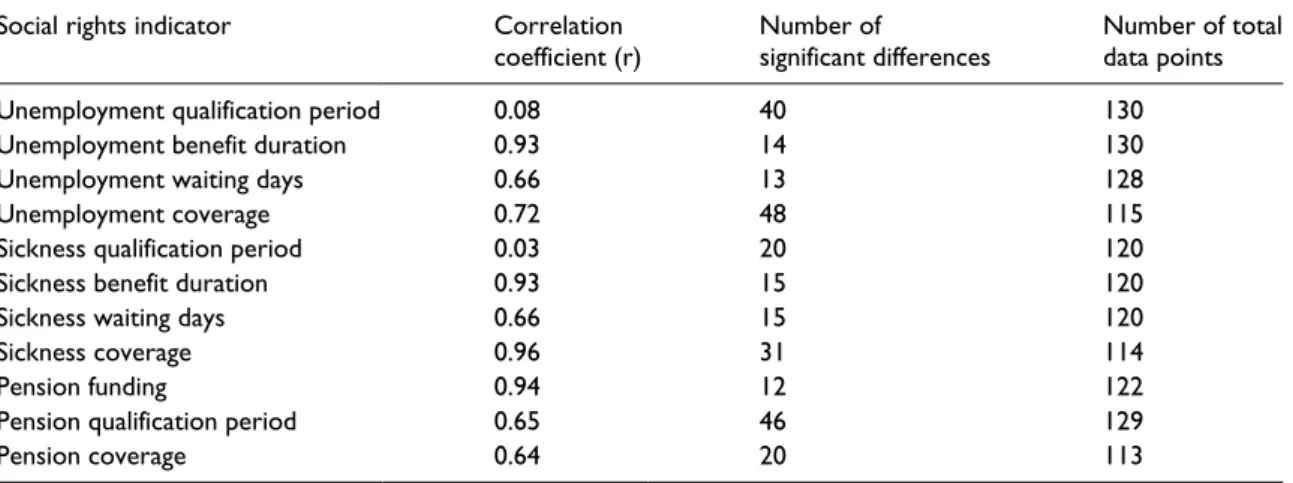
can only compare data points for the following years: 1970, 1975, 1980, 1985, 1990, 1995, 2000 and 2005. This gives us 1341 ([11 indicators × 18 coun-tries × 8 years] − 243 missing data points) common data points in SCIP and CWED. We compared all these common data points across SCIP and CWED, and our comparison shows that the degree to which these data-sets differ changes from indicator to indicator. In order to show these differences, we report the correlation coefficient and the number of data points that are sig-nificantly different in SCIP and CWED in Table 2.5
The largest discrepancies across the datasets in Table 2 are those in the unemployment qualification period (r = 0.08) and sickness qualification period (r = 0.03). Although these very low correlations point to significant discrepancies, Column 2 shows that they are concentrated in a few data points only for sickness qualification period indicator. For other indicators, the differences, while not as significant, are more widely distributed. Most strikingly, around a third of the data points for unemployment coverage and pension qualification period indicators are sig-nificantly different.
When we take a closer inspection at these differ-ences programme-by-programme, we come across some striking examples. For instance, while the CWED score for sick pay benefit duration in France in 2005 was 3 years, it was just 1 year in SCIP. This difference could stem from differences in operational
definitions, inadequately detailed coding instructions or simply coding mistakes. In any case, it is obvious that this difference would seriously influence any assessment of the extent to which France’s sick pay scheme in fact provided these social rights in 2005. When we examine data country-by-country, we corroborate the findings in previous research that CWED and SCIP data are more similar for some countries than for others (Scruggs and Allan, 2006; Wenzelburger et al., 2013). While CWED and SCIP largely agree on data points for Australia, New Zealand and Norway, the datasets report significantly different scores for Austria, Belgium, Ireland and Switzerland. Strikingly, the differences among programmes and countries follow a somewhat sys-tematic pattern when we examine observations
year-by-year.
In sum, there are significant differences between SCIP and CWED scores for all 11 indicators we ana-lyse. Around half of the data points, which the data-sets have in common, are coded differently. However, some of these differences are clearly minor. Although the differences affect all countries and all indicators, they are not spread uniformly. Given the number of significantly different data points for these pro-grammes across these countries for all these years, it is rather likely that there may be some differences in operationalization that are not clearly visible in the codebook.
Table 2. Correlation of non-replacement rate indicators between SCIP and CWED. Social rights indicator Correlation
coefficient (r) Number of significant differences Number of total data points
Unemployment qualification period 0.08 40 130
Unemployment benefit duration 0.93 14 130
Unemployment waiting days 0.66 13 128
Unemployment coverage 0.72 48 115
Sickness qualification period 0.03 20 120
Sickness benefit duration 0.93 15 120
Sickness waiting days 0.66 15 120
Sickness coverage 0.96 31 114
Pension funding 0.94 12 122
Pension qualification period 0.65 46 129
Pension coverage 0.64 20 113
Comparing DI and BGI values:
contrasting images of welfare
state change
This section analyses the extent to which the differ-ences in non-replacement rate indicators in SCIP and CWED do in fact lead to different values in DI and BGI. We compute the aggregate scores of DI and BGI based on SCIP and CWED data, respectively, for 18 countries for 5-year intervals between 1970 and 2005. Due to the missing data points, we obtained around 100 common data points ([18 coun-tries × 8 years] − missing data points) for each of these indexes.6 We then compare index values for
1980 and 2000 for these countries in order to see whether the two datasets corroborate one another in assessing welfare state change.7 Each of these
indexes is constructed on the basis of replacement rate and non-replacement rate data for unemploy-ment, sickness and pension programmes. The indexes follow different procedures in standardizing and aggregating these different indicators (Esping-Andersen, 1990; Scruggs, 2014). In order to com-pare whether the choice of dataset affects DI and BGI values, we compute these indexes both with SCIP and with CWED data. We thus compute DI twice – once with SCIP data and once with CWED data – and then compare whether the resulting values are similar. Likewise, we compute BGI twice8 – once
with SCIP data and once with CWED data – and
compare the scores. In this comparison, we explore three questions: To what extent are the index values similar? To what extent are the country rankings in the indexes similar? And, perhaps most importantly in substantive terms, to what extent is the direction of welfare state change (i.e. expansion or retrench-ment) each index shows for each country similar?
We first computed DI on the basis of over 100 common data points in SCIP and CWED. The very high overall correlation between DI constructed on the basis of SCIP and CWED scores (r = 0.89) shows that the index values are rather similar. However, this high correlation of the scores masks significant differences across the two indexes in terms of the cross-section of country rankings and longitudinal welfare state change. We observe that for the year 1980, Austria, Belgium, Finland, France, the Netherlands and Switzerland are ranked quite differ-ently in both datasets.9 In the case of Austria, Finland
and Switzerland, the differences in ranking continue well into 2000. Despite these differences, the rank-ings in DI constructed with both SCIP and CWED more or less do reflect the patterns depicted in the comparative literature. For example, while the United States and Australia appear as welfare lag-gards, the Scandinavians lead the league in social rights.
Now let us turn to the extent to which there has been welfare state retrenchment in the age of ‘per-manent austerity’. If we use DI as the yardstick, we
Figure 1. Direction of welfare state change in DI: CWED and SCIP compared.
find that the answer to this question depends very much on the dataset used to construct the index. Comparing the 1980 and 2000 scores, Figure 1 shows that the direction of change DI reports is dif-ferent for 6 (Belgium, Switzerland, Canada, Denmark, Japan and Austria) of the 17 countries. This means that DI constructed on CWED and SCIP data shows contrasting images of welfare state change in a third of all the countries in the datasets. The most striking case in Figure 1 is Belgium, which, according to DI based on CWED data, registers the largest expansion among advanced industrialized countries. However, according to the same index, this time based on SCIP data, Belgium seems to have undergone the largest retrenchment among the same group of countries. It is also striking that whereas DI based on SCIP data shows retrenchment in a major-ity of 11 cases, the same index based on CWED reports only 5 cases.10
These differences between DI values computed on the basis of SCIP and CWED may have stemmed from the index formula (Bambra, 2006; Scruggs and Allan, 2006). BGI follows a different formula in treating the same indicators. In order to isolate the effects of the index formula, we computed BGI based on both SCIP and CWED data again. The overall cor-relation between BGI computed with CWED and SCIP data is again very high (r = 0.89). In the rank-ings, there are again some notable differences across
BGI computed on the basis of the two datasets. When computed on the basis of SCIP and CWED, BGI val-ues for Belgium, Finland and Switzerland are ranked very differently for 1980. For the year 2000, how-ever, these differences in rankings across BGI values are limited to only Austria and Belgium.
It is again the question of welfare state change that gives us the more striking results. As Figure 2 shows, BGI values computed on the basis of SCIP and CWED show contrasting images of welfare state change for 6 (Belgium, Ireland, Japan, France, Switzerland and the United States) of the 17 coun-tries. Like DI, BGI reports clearly more cases of retrenchment for SCIP data (11 countries) than for CWED data (7 countries).
When we compare the two sets of findings for DI and BGI values across time presented in Figures 1 and 2, some striking patterns emerge. First, we find that both DI and BGI (based both on SCIP and CWED data) indicate contrasting images of welfare state change in Belgium, Japan and Switzerland. What lies behind these contrasts? In the case of Belgium, this is largely due to differences among SCIP and CWED in coverage and replacement rate indicators for unemployment and pension pro-grammes. For Japan, the difference is mainly due to differences in SCIP and CWED on pension coverage and replacement rates. For this country, for example, whereas CWED data point to an increase in pension
Figure 2. Direction of welfare state change in BGI: CWED and SCIP compared.
replacement rates, SCIP data register a decrease. In the case of Switzerland, the difference is mainly due to differences in SCIP and CWED in pension replacement rates.
Second, in 8 of the 17 cases (Finland, Norway, the Netherlands, Australia, New Zealand, Germany, United Kingdom and Sweden), both indexes based on both SCIP and CWED point to the same direction of welfare state change. For some of these cases, however, the magnitudes of change are reported to be different. For instance, DI and BGI based on SCIP data report deeper retrenchment in the case of New Zealand than DI and BGI based on CWED data. A significant reason for this is that whereas SCIP reports that unemployment and sick pay waiting days increased from 1 to 3 weeks, CWED reports no change.
Third, in the remaining six cases (Ireland, Canada, Denmark, France, Austria and United States), the direction of welfare state change is similar in one index but different in the other index. This contrast between DI and BGI is likely to be related to the par-ticular ways in which DI and BGI standardize indica-tor scores. The standardization method employed in DI produces ‘discontinuities in scoring’ and poten-tially magnifies small changes while underemphasiz-ing larger changes in relative terms (Scruggs, 2007; Scruggs and Allan, 2006). BGI’s standardization method, however, does not result in similar effects.
In this section, we showed that for both DI and BGI, correlation coefficients are rather high across SCIP and CWED data. This means that the overall summary statistics for both indexes point to more similar distributions than those for individual indi-cators alone. Moreover, in terms of country rank-ings, our analysis shows that only some countries are ranked in significantly different ways by SCIP and CWED. This implies that the main findings of comparative welfare state research on welfare lag-gards and welfare leaders are corroborated in our analysis regardless of the dataset we use in replicat-ing DI and BGI.
In sum, aside from these two pieces of good news, this section showed that the ‘dependent variable problem’ in welfare state change still persists. Our analysis points to two systematic findings in this regard. First, regardless of the index we employ,
SCIP data report categorically more cases of retrenchment than CWED data. Second, both DI and BGI report contrasting images of welfare state change for three countries depending on the dataset used. Given how central these indexes are in portray-ing welfare state change in the literature, these find-ings suggest that we need to explore ways for improving convergent validity. As a first stab at this, we now explore below a set of potential sources of discrepancies among the datasets.
Potential sources of discrepancies
among the two datasets
Based on our close reading of the codebooks of SCIP and CWED, we identify five potential sources of dis-crepancies. First, in defining the ‘notional worker’, the type case differences among the datasets (as mentioned in Section ‘Non-replacement rate indica-tors and convergent validity of SCIP and CWED’) may translate into differences in indicator scores (Scruggs, 2013). For example, in the case of Austria, unemployment benefit duration is 30 weeks for the notional worker at age 30, but this parameter is 39 weeks if the worker is aged 40 or older. For this case, therefore, CWED codes 39 weeks and SCIP codes 30 weeks (Social Security Administration (SSA), 2004: 37). Second, the coding decision for some of the programmes in some countries may sim-ply be too difficult to make given the inevitable ina-bility of any codebook to reflect the overwhelmingly complex nature of the programmes. In some cases, it may be too difficult to decide on which of the exist-ing programmes to use for codexist-ing an indicator. Switzerland’s sick pay insurance is an example of these: Whereas SCIP uses the nationally legislated minimum as the basis for coding the indicators, CWED relies on a non-mandatory programme (Ferrarini et al., 2013: 1259). In fact, in their replica-tion of the DI, Scruggs and Allan (2006: 66–7) explained that they consciously chose to code some programmes they assumed were not coded in SCIP.
While these first two issues had been discussed in the literature, we identified a third one related particu-larly to the operationalization of the 11 indicators we analyse. One example of the different operationaliza-tion of an indicator is pension funding where both
datasets operationalize the share of employee contri-butions differently. Even when we re-constructed an indicator with SCIP data to be able to compare it with the CWED indicator, we still found that some scores for this indicator are different. Another example is the case of qualification period indicators in sickness and unemployment programmes. Although the codebook descriptions for qualification period indicators appear to be similar, the scores for many data points are not. Having rolled these scores, we have come to the con-clusion that SCIP and CWED mean different things when they speak of qualification periods. SCIP appears to measure the period one has to contribute in order to be eligible for any kind of benefit stipulated in the legislation concerned. CWED, however, appears to measure the period one has to contribute in order to be eligible for the kind of benefits that the notional worker receives.
A fourth potential reason for different indicator values may be using different sources for coding. In fact, Scruggs and Allan (2006: 66) suggested this long ago as an explanation for different coverage rates appearing for Ireland. The same issue may also explain other differences in indicator scores. However, since it is not always clear which source had been used for coding which data point, we can-not conclude how prevalent this problem is. Even if SCIP and CWED had used the same source, the actual score may differ if the same indicator is coded on the basis of different interpretations of the same source. For example, both SCIP and CWED rely on
Social Security Programs Throughout the World
(SSPTW), which summarizes social security legistla-tion, at times, in adequate detail. Therefore, when coding a particular indicator, a high level of inter-coder reliability may not always be achieved. Moreover, since SSPTW is published biannually, coders may code the values of years where data are unavailable differently. Finally, another potential source may always be random coding errors in the scoring stage that inflicts any large-scale dataset (Wenzelburger and Zohlnhöfer, 2014: 314).
Conclusion
In the comparative welfare state literature, a consen-sus emerged that quantified social rights indicators
provided by SCIP and CWED are ‘best’ measures for capturing the multidimensional character of welfare states. This consensus remains solid despite concerns over validity in the most widely used indicators, replacement rates. A recent debate revealed that these discrepancies in the six replacement rate indicators analysed are natural as they are constructed on the basis of different operational definitions. However, there is much more to social rights data than replace-ment rates. Eleven other non-replacereplace-ment rate indi-cators appear in both SCIP and CWED. Together with replacement rates, these indicators constitute the backbone of the widely used DI and BGI. The
Symposium we drew heavily on suggested that scores
for these common indicators (as well as DI and BGI constructed on their basis) should be far more similar than those for replacement rates. In this article, we explored the empirical validity of this suggestion. By comparing the 1341 common data points for 11 indi-cators, we found that in a majority of cases SCIP and CWED data are very similar. However, significant differences existed in a substantial number of data points across these datasets.
The differences in operationalization and meas-urement concern not only the 11 indicators, but they are also directly consequential for DI and BGI values. The good news from our analysis is that the overall correlations between the scores computed with SCIP and CWED for these indexes are very high. Moreover, country rankings also show simi-larities across the datasets and they largely corrobo-rate the findings of the comparative literature. When it comes to measuring welfare state change, however, SCIP and CWED data often point to different directions. These differences are conse-quential not only for our debates on how much retrenchment we had, but they also directly affect our contending stories on what drives these changes.
These validity problems bring us back full circle to the ‘dependent variable problem’ in the compara-tive literature. The analysis of welfare state retrench-ment appears to depend much, alas, on dataset choice, yet again.11 Sustaining the very informative
conversation among developers of SCIP and CWED that began on replacement rates, we submit, ought to continue for non-replacement rate indicators. We
believe such conversation would help us verify whether the sources of differences we explored above are in fact consequential, and if so, what they mean in measuring social rights. We also believe this would also help us interpret the often contradictory findings on retrenchment in more nuanced ways.
Acknowledgements
The authors would like to thank Kenneth Nelson, Kati Kuitto, Carsten Jensen, Traute Meyer, Efe Savaş and two anonymous referees for very valuable comments and suggestions.
Funding
This research is supported by the Scientific and Technological Research Council of Turkey (TUBITAK) (Project No: 114K121, Mapping the Turkish Welfare State Through Original Data Generation: A Theoretical and Methodological Contribution to Comparative Welfare State Research) and European Commission FP7 (Grant Agreement No: 312691, InGRID – Inclusive Growth Research Infrastructure Diffusion].
Notes
1. Some of these issues were followed up in an InGrid workshop on ‘Development and dissemination of social policy indicators’ in Stockholm in November 2014. 2. An exception is Wincott (2013).
3. In terms of data sources, we use the most recent Comparative Welfare Entitlements Dataset (CWED) data (Scruggs et al., 2014a) and the most recent Social Citizenship Indicator Program (SCIP) files released before the re-launching of the data under the new Social Insurance Entitlements Dataset (SIED) (Korpi and Palme, 2008a).
4. A second difference between SCIP and CWED concerns sickness and unemployment benefit dura-tion indicators. Cases of unlimited benefit duradura-tion are coded differently in both datasets. To make the respective indicators comparable, we re-coded unlim-ited benefit duration in CWED the way it is coded in SCIP (260 weeks).
5. We defined ‘significant’ differences in data points as differences of at least 10 percentage points for coverage, and funding indicators, at least 10 years for pension qualification period, at least 7 days for unemployment and sickness waiting days and at least 52 weeks for unemployment and sickness benefit duration and qualification periods. The
numbers exclude the well-known coverage dif-ferences for Australia and New Zealand (Bambra, 2006). All coverage data points above 100 percent are capped at 100 percent. The data include the cod-ing of US sick pay coverage as 0 percent. The corre-lation coefficient for the pension funding indicator is r = 0.89 if the actual pension funding indicator in SCIP is used.
6. For missing data in CWED, we applied the formula described in Scruggs (2014) to increase the number of data points.
7. We analysed the time period 1980–2000 for mainly two reasons: (1) at the time of analysis, there were more missing data points for 1970, 1975 and 2005, so the comparison would be based on less number of countries had we analysed different years (1970, 1975 and 2005), and (2) the retrenchment debate mainly focuses on the period from 1980 onwards. In our analysis, we used the previous or following year’s data whenever data for 1980 or 2000 were unavailable.
8. We computed both the original Benefit Generosity Index (BGI) and the revised BGI II (Scruggs, 2014). We had to calculate BGI II without the index compo-nent on expected benefit duration for old age pension since this component is not available in SCIP. Since we believe BGI II calculated on the basis of SCIP is potentially misleading, we only present data for the original BGI (note that BGI II results are similar to those for the original BGI with a very high overall correlation (r = 0.91)).
9. We arbitrarily define ‘significant difference’ in rank as a difference between a country’s rank in SCIP and CWED by at least four ranks.
10. An important question is what drives the differences in index values across datasets. Is it differences in replacement rates or differences in the other indica-tors? To explore this issue, we computed DI and BGI values using SCIP data for replacement rates and CWED data for the other indicators and compared these values with the index values computed with SCIP data. In other words, we kept replacement rate data constant to control for differences in replacement rates. The correlation coefficient increased (r = 0.93 for DI, r = 0.96 for BGI) and the number of countries for which welfare state change was assessed radically different decreased. However, significant discrepan-cies remained. This indicates that the discrepandiscrepan-cies in index values are partly driven by differences in replacement rates and partly driven by differences in non-replacement rate indicators.
11. Readers may wonder which dataset they should choose, given the differences in indicator scores. At this point, we cannot decisively conclude which data-set is ‘better’ (compare Wenzelburger and Zohlnhöfer, 2014: 326). In some cases, there might be conceptual reasons for using one of these datasets. In other cases, a conservative advice would be to check whether findings obtained with one dataset also hold true for the other.
References
Adcock, R. and Collier, D. (2001) ‘Measurement Validity: A Shared Standard for Qualitative and Quantitative Research’, American Political Science Review 95(3): 529–46.
Amenta, E. (2003) ‘What We Know about the Development of Social Policy’, in J. Mahoney and D. Rueschemeyer (eds) Comparative Historical Analysis
in the Social Sciences, pp. 91–130. Cambridge; New
York: Cambridge University Press.
Bahle, T., Hubl, V. and Pfeifer, M. (2011) The Last Safety
Net: A Handbook of Minimum Income Protection in Europe. Bristol: Policy Press.
Bambra, C. (2006) ‘Research Note: Decommodification and the Worlds of Welfare Revisited’, Journal of
European Social Policy 16(1): 73–80.
Clasen, J. and Siegel, N.A. (2007) Investigating Welfare
State Change: The ‘Dependent Variable Problem’ in Comparative Analysis. Cheltenham: Edward
Elgar.
Danforth, B. and Stephens, J.D. (2013) ‘Measuring Social Citizenship: Achievements and Future Challenges’, Journal of European Public Policy 20(9): 1285–98.
Eid, M. (2010) ‘Convergent and Discriminant Validation by the Multitrait-Multimethod Matrix’, in N.J. Salkind (ed.) Encyclopedia of Research Design, pp. 850–855. Thousand Oaks, CA: Sage.
Esping-Andersen, G. (1990) The Three Worlds of Welfare
Capitalism. Cambridge: Polity Press.
Ferrarini, T., Nelson, K., Korpi, W. and Palme, J. (2013) ‘Social Citizenship Rights and Social Insurance Replacement Rate Validity: Pitfalls and Possibilities’, Journal of European Public Policy 20(9): 1251–66.
Korpi, W. (1989) ‘Power, Politics, and State Autonomy in the Development of Social Citizenship: Social Rights during Sickness in Eighteen OECD Countries since 1930’, American Sociological Review 54(3): 309–28.
Korpi, W. and Palme, J. (2008a) The Social Citizenship
Indicator Program (SCIP). Stockholm: SOFI,
Stockholm University.
Korpi, W. and Palme, J. (2008b) The Social Citizenship
Indicator Program (SCIP): General Coding Comments. Stockholm: SOFI, Stockholm University.
Kühner, S. (2015) ‘What If We Waited a Little Longer? The Dependent Variable Problem within the Comparative Analysis of the Welfare State Revisited’, Social
Policy Review 27: 199–224.
Leisering, L. (2016) FLOORCASH Database. Bielefeld: Bielefeld University.
Nelson, K. (2007) ‘Universalism versus Targeting: The Vulnerability of Social Insurance and Means-Tested Minimum Income Protection in 18 Countries, 1990– 2002’, International Social Security Review 60(1): 33–58.
Scruggs, L. (2004) Welfare State Entitlements Dataset:
A Comparative Institutional Analysis of Eighteen Welfare States, Version 1.1. Storrs: University of
Connecticut.
Scruggs, L. (2007) ‘Welfare State Generosity across Space and Time’, in J. Clasen and N.A. Siegel (eds)
Investigating Welfare State Change: The ‘Dependent Variable Problem’ in Comparative Analysis, pp.
133–65. Cheltenham: Edward Elgar.
Scruggs, L. (2008) ‘Social Rights, Welfare Generosity, and Inequality’, in P. Beramendi and C. Anderson (eds) Democracy, Inequality, and Representation:
A Comparative Perspective, pp. 62–90. New York:
Russell Sage Foundation.
Scruggs, L. (2013) ‘Measuring and Validating Social Program Replacement Rates’, Journal of European
Public Policy 20(9): 1267–84.
Scruggs, L. (2014) ‘Social Welfare Generosity Scores in CWED 2: A Methodological Genealogy’, CWED
Working Paper Series, Working Paper 1. Available
at: http://cwed2.org/Data/CWED2_WP_01_2014_ Scruggs.pdf (accessed 2 March 2017).
Scruggs, L. and Allan, J. (2006) ‘Welfare-State Decommodification in 18 OECD Countries: A Replication and Revision’, Journal of European
Social Policy 16(1): 55–72.
Scruggs, L., Jahn, D. and Kuitto, K. (2014a) Comparative
Welfare Entitlements Dataset 2: Version 2014-03.
University of Connecticut; University of Greifswald. Available at: http://cwed2.org (accessed 2 March 2017). Scruggs, L., Jahn, D. and Kuitto, K. (2014b) Comparative
Welfare Entitlements Dataset 2 Codebook: Version 2014-03. University of Connecticut; University of
Greifswald. Available at: http://cwed2.org (accessed 2 March 2017).
Social Security Administration (SSA) (2004) ‘Social Security Programs Throughout the World: Europe, 2004’, available at https://www.ssa.gov.
Stephens, J.D. (2010) ‘The Social Rights of Citizenship’, in F.G. Castles, S. Leibfried, J. Lewis, H. Obinger and C. Pierson (eds) The Oxford Handbook of the Welfare
State, pp. 511–25. Oxford: Oxford University Press.
Trochim, W., Donnelly, J.P. and Arora, K. (2015)
Research Methods: The Essential Knowledge Base.
Boston, MA: Cengage Learning.
Wenzelburger, G. and Zohlnhöfer, R. (2014) ‘Wohlfahrtsstaatlicher Wandel, Lohnersatzraten und das Problem der Validität – Ein kritischer Einwurf’,
Zeitschrift für Vergleichende Politikwissenschaft
8(3–4): 307–28.
Wenzelburger, G., Zohlnhöfer, R. and Wolf, F. (2013) ‘Implications of Dataset Choice in Comparative Welfare State Research’, Journal of European Public
Policy 20(9): 1229–50.
Wincott, D. (2013) ‘The (Golden) Age of the Welfare State: Interrogating a Conventional Wisdom’, Public