40
Evaluation of the Relationship between Self-Esteem and Risk-Taking
Behaviors of Students Who Taking Elective Physical Education Course
Merve Ceylan1
1 Lecturer, Mugla Sitki Kocman University, Turkey. Abstract
This research was carried out to examine the self-esteem and risk-taking levels of the university students taking elective physical education and sports courses. For this purpose, the self-esteem and risk-taking levels of the university students who participated in the study were examined according to different socio-demographic characteristics and the results obtained were interpreted. 101 students participated in the study who prefered physical education and sports courses as an elective course in Muğla Sıtkı Koçman University in 2018-2019 fall season. All participants were involved in the study voluntarily. A three-part questionnaire was used as data collection tool in the research. The first part of the research includes the personal information form about the participants, the second part of the research involves "Self-Esteem Scale" and the third part of the research includes the Risk-Taking Scale. Data were analyzed by using SPSS16.0 program. When the results of the research are generally evaluated, there is a significant and negative relationship between self-esteem and risk-taking behavior. It is possible to turn to risk behaviors in order to avoid or deal with negative emotions that arise from low self-esteem, such as feeling worthless and unimportant oneself and not being liked by others.
Keywords: Self- esteem,Risk taking,University student 1. Introduction
The socialization of the young people and the progress of the society formation depend on education and sports today, when technological developments are rapidly progressing and bilateral relations are being replaced by social media interactions.
Up until now, many studies have mentioned the importance of education and sports in the process of the society formation. Sports is an important factor for children and young people in gaining many characteristics such as controlling behavior and excitement, acting within a group and self-confidence, regardless of team or individual sports.
Education is a process that an individual makes a terminal change in her/his behavior through her/his experience or deliberately, i.e. enculturation. Generally speaking, the purpose of education is to enculturate, socialize, individualize and make an individual become prolific (21). Physical education and sports, painting, music, sculpture, folklore, science and technics, etc. can be handled as cultural values transferred through education. Students can take elective courses related to these values during their university education.
The World Health Organization (WHO) defines "youth" in the 15-24 years age group (20). According to the United Nations Population Fund (UNFPA) report, there are 1.8 billion people between 10-24 years of age in the world and these young people constitute one fourth of the world population. The young people between 10-24 years of age consist of one third of the population (25 million) in Turkey (19). This period is also the most active period of education. In particular, university education is an important period in the lives of the young people when they get new experiences, make judgments about themselves, try to make them accepted by the society, turn to some risky behaviors and try to be self-actualized. Maslow states that needs must be met in a hierarchal order in order to achieve a self-actualized and psychologically healthy individual. There is the need for respect, esteem and success in the fourth level of this order.
Feeling worthy oneself, adopting her/his own body and physical characteristics and being satisfied with them, her/his ability to exhibit her/his skills, being admired by the society and her/his ability to accomplish her/his goals are among the factors influencing the development of self-esteem (22). Self-esteem is a prerequisite for being a healthy individual and personal development. If the individual is self-satisfied, where s/he wants to be and feels confident, high self-esteem can be mentioned. However, low self-esteem is in question if s/he is not self-satisfied and is often self-critical.
The danger, fear and need to take a stand against fear for many of human existence have become part of our daily life. Although risk-taking behaviors are interdependent, they usually involve a period from adolescence to adulthood (9).
41
2. Literature ReviewThere are a number of studies that examine the risk-taking behaviors of the university students. The risky behaviors of the students were investigated in terms of health in a study conducted and the non-use of safety belt (25.4%), carrying a gun (5.2%), fighting (10%), smoking and alcohol consumption (22.9% - 24.2%) and sexual intercourse (21.6%) were significantly higher in males (8). Another study demonstrated that 10.5% of the participants were physically involved in a fight at least once, 11.1% used emotional, physical or sexual violence against their girlfriend or boyfriend and 12.8% were exposed to emotional, physical or sexual violence by their girlfriend or boyfriend (7). When the related literature is examined, it is seen that one of the personal factors related to risk taking behavior in adolescents is self esteem (15).
This research was carried out to examine the self-esteem and risk-taking levels of the university students taking elective physical education and sports courses. For this purpose, the self-esteem and risk-taking levels of the university students who participated in the study were examined according to different socio-demographic characteristics and the results obtained were interpreted.
3. Method 3.1. Participants
109 students participated in the study who prefered physical education and sports courses as an elective course in Muğla Sıtkı Koçman University in 2018-2019 fall season. All participants were involved in the study voluntarily.
3.2. Materials
A positivist quantitative research approach was selected for the purpose of the study.
A three-part questionnaire was used as data collection tool in the research. The first part of the research includes the personal information form about the participants' age, gender, place of residence, whom they live with, monthly income, their start time of branch of sports in which they are currently interested, and frequency of doing sports.
The second part of the research involves "Self-Esteem Scale" developed by Aricak (1999). The scale consists of 32 items and 5 (self-esteem, self-confidence, depressive affect, self-sufficiency, achievement and productivity) dimensions in the five-point likert type scale (1: I totally disagree, 5: I totally agree). 19 items (1, 3, 4, 6, 7, 9, 11, 13, 15, 16, 18, 19, 21, 23, 25, 27, 29, 31 and 32) with negative expression in the scale were reverse-coded. The obtained higher scores indicate higher self-esteem (2). For this study, the Cronbach Alpha coefficient of the scale was 0.94; the Cronbach Alpha coefficients of the sub-dimensions were determined as 0.83 / 0.84 / 0.70 / 0.71.
The third part of the research includes the Risk-Taking Scale developed by Weber, Blais and Betz (2002), revised by Weber and Blais (2006) and adapted to Turkish by Gursel (2010) following that the reliability-validity studies were conducted. The scale consists of 30 items and 5 (moral domain, social domain, health domain, recreation domain, financial domain) dimensions in the seven-point likert type scale (1: I certainly do not, 7: I certainly do). Higher scores in the scale and sub-dimensions represent high level of risky behaviors in moral, social, health, recreation, financial domains (11). For this study, the Cronbach Alpha coefficient of the scale was 0.90; the Cronbach Alpha coefficients of the sub-dimensions were determined as 0.72 / 0.71 / 0.74 / 0.87 and 0.87.
3.3. Procedure
First of all the participants were informed about the research. They were answered questions by providing a quiet classroom environment. When evaluating the data only the data of the 101 participants who answered all questions were evaluated.
Data were analyzed by using SPSS (Statistical Package Program for Social Science) 16.0 program. Demographic information of the participants was shown as frequency and percentage table. The Skewness coefficient was used in the normality test of the scale scores. The Skewness coefficient used in the normal distribution characteristics of the scores obtained from a continuous variable remained within ±1 limit, which can be interpreted that the scores did not show a significant deviation from the normal distribution. If the scores do not show normal distribution, square root, logarithmic and inverse transformation can be performed in order to apply parametric tests (5). The logarithmic transformations of the scores of self-esteem, personal development, socialization, physical benefit, integration, psychological development,
42
emotional development and social integration in sports which did not show normal distribution in the normality test were performed and the unpaired (two-sample) t test was used to compare them in terms of gender and place of residence variables, but ANOVA was used for their comparison in terms of age groups, whom they live with, monthly income, their start time of branch of sports in which they are currently interested and frequency of doing sports variables. When ANOVA test showed significant difference, LSD post hoc test was used to determine the difference between the groups. The Pearson correlation technique was used for the analysis of the relationship between the scale scores. The confidence interval was 95% (significance level 0.05 p < 0.05) in the analyses.4. Results
Table 1 shows the frequency and percentage distribution according to the demographic characteristics of the participants.
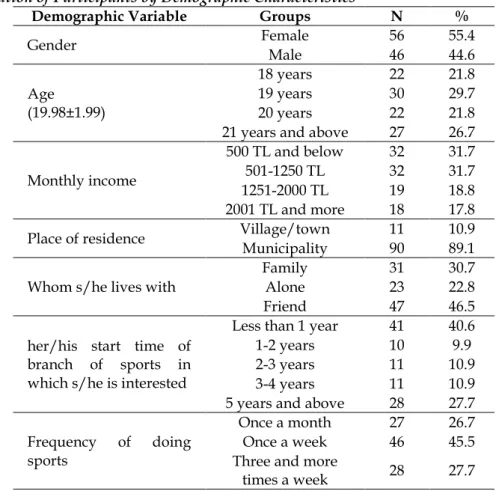
Table 1. Distribution of Participants by Demographic Characteristics
Demographic Variable Groups N %
Gender Female 56 55.4 Male 46 44.6 Age (19.98±1.99) 18 years 22 21.8 19 years 30 29.7 20 years 22 21.8
21 years and above 27 26.7
Monthly income
500 TL and below 32 31.7
501-1250 TL 32 31.7
1251-2000 TL 19 18.8
2001 TL and more 18 17.8
Place of residence Village/town 11 10.9
Municipality 90 89.1
Whom s/he lives with
Family 31 30.7
Alone 23 22.8
Friend 47 46.5
her/his start time of branch of sports in which s/he is interested
Less than 1 year 41 40.6
1-2 years 10 9.9
2-3 years 11 10.9
3-4 years 11 10.9
5 years and above 28 27.7
Frequency of doing sports
Once a month 27 26.7
Once a week 46 45.5
Three and more
times a week 28 27.7
55.4% of 101 participants were female and 44.6% were male. The mean age of the participants was 19.98±1.99 and 21.8% were 18 years, 29.7% were 19 years, 21.8% were 20 years and 26.7% were 21 years and above. The monthly income of 31.7% of the participants was 500 TL and less, of 31.7% was 501-1250 TL, of 18.8% was 1251-2000 TL and of 17.8% was 2001 TL and more. 10.9% of the participants live in village/town and 89.1% live in municipality or city. 30.7% of the participants live with their family, 22.8% live alone and 46.5% live with their friends. 40.6% of the participants are interested in their sports branch for less than 1 year, 9.9% for 1-2 years, 10.9% for 2-3 years, 10.9% for 3-4 years, 27.7% for 5 years and more. 26.7% of the participants spare time for the sports branch in which they are interested once a month, 45.5% spare time for it once a week and 20.8% spare time for it three and more times a week (Table 1).
Table 2 shows the descriptive statistics of the average, standard deviation and Skewness information of the scale and its sub-dimensions.
Table 2: Descriptive Statistics of Scales
43
Scale and Sub-Dimension N Min. Max. SD Skewness
Self-Esteem 101 1.00 5.00 3.65 0.81 -0.061
Self-Confidence 101 1.22 5.00 3.91 0.69 -0.91
Depressive Affect 101 1.00 5.00 2.27 0.93 0.89
Self-Sufficiency 101 1.80 5.00 4.00 0.68 0.011
Achievement and Productivity 101 1.00 5.00 3.94 0.67 0.161
SELF-ESTEEM 101 1.19 5.00 3.84 0.65 -0.041 Moral Domain 101 1.00 5.50 2.26 1.04 0.79 Social Domain 101 1.00 7.00 5.02 0.96 -0.96 Health Domain 101 1.00 7.00 3.63 1.29 0.23 Recreation Domain 101 1.00 7.00 4.39 1.42 -0.20 Financial Domain 101 1.00 7.00 3.35 1.50 0.61 RISK-TAKING 101 1.20 5.70 3.73 0.90 0.00
According to the score range (1-5) that can be taken from the self-esteem scale, it can be said that the self-esteem (3.65±0.81), self-confidence (3.91±0.69), self-sufficiency (4.00±0.68), achievement and productivity (3.94±0.67) sub-dimension scores and the self-esteem scale scores (3.84±0.5) were "high level"; the depressive affect sub-dimension scores (2.27±0.93) were "low level" (5-1=4/5=0.80; 1.00-1.80: very low; 1.81-2.60: low; 2.61-3.40: medium; 3.41-4.20: high; 4.21-5.0) (Table 2).
According to the score range (1-7) that can be taken from the risk-taking scale, it can be said that the social domain (2.26±1.04) and financial domain (3.35±1.50) risk-taking scores of the participants were "low level"; their health (3.63±1.29), recreation (4.39±1.42) and general risk-taking (3.73±0.90) scores were "medium level"; their social domain scores (5.02±0.96) were "high level" (7-1=6/5=1.20; 1.00-2.20: very low; 2.21-3.40: low; 3.41-4.60: medium; 4.61-5.80: high; 5.81-7.0) (Table 2).
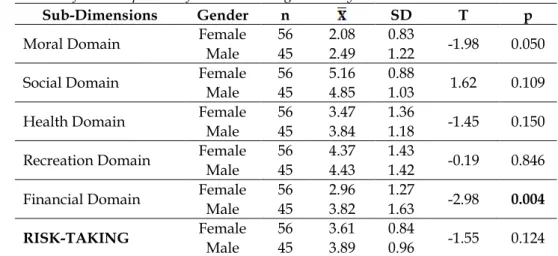
Table 3 shows the unpaired (two-sample) t test results of the comparison of the risk-taking scores by the gender of the participants.
Table 3: t Test Results of the Comparison of the Risk-Taking Scores By Gender
Sub-Dimensions Gender n SD T p
Moral Domain Female 56 2.08 0.83 -1.98 0.050
Male 45 2.49 1.22
Social Domain Female Male 56 45 5.16 4.85 0.88 1.03 1.62 0.109 Health Domain Female Male 56 45 3.47 3.84 1.36 1.18 -1.45 0.150
Recreation Domain Female 56 4.37 1.43 -0.19 0.846
Male 45 4.43 1.42
Financial Domain Female 56 2.96 1.27 -2.98 0.004
Male 45 3.82 1.63
RISK-TAKING Female 56 3.61 0.84 -1.55 0.124
Male 45 3.89 0.96
It was determined that the risk-taking scores of the financial domain showed a significant difference in terms of gender (t=-2.98; p<0.05). The risk-taking scores of the financial domain of the male participants were significantly higher than those of the female participants (Table 3).
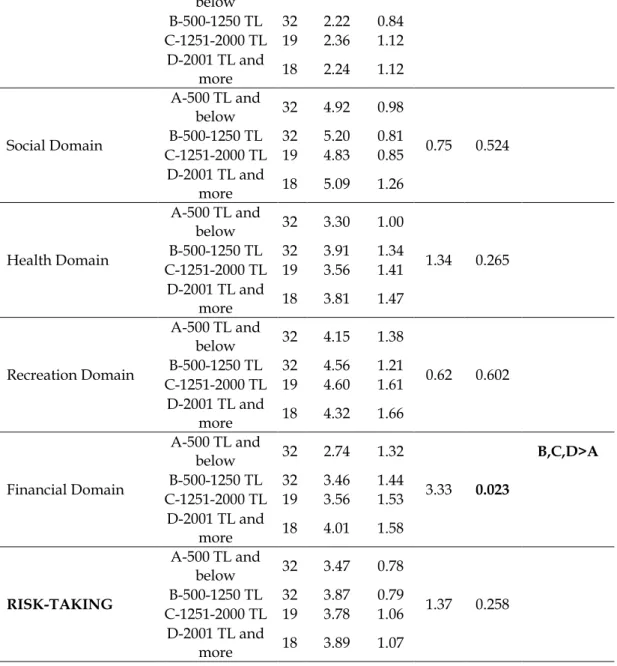
It was determined that the risk-taking scale score and the risk-taking scores of the moral, social, health and recreation domains did not show a significant difference in terms of gender (p>0.05) (Table 3). Table 4: ANOVA Test Results of the Comparison of the Risk-Taking Scores By Monthly Income
Sub-Dimension Monthly Income N SD F p Significant Difference
Moral Domain A-500 TL and 32 2.26 1.16 0.07 0.975
X
X
X
44
below B-500-1250 TL 32 2.22 0.84 C-1251-2000 TL 19 2.36 1.12 D-2001 TL and more 18 2.24 1.12 Social Domain A-500 TL and below 32 4.92 0.98 0.75 0.524 B-500-1250 TL 32 5.20 0.81 C-1251-2000 TL 19 4.83 0.85 D-2001 TL and more 18 5.09 1.26 Health Domain A-500 TL and below 32 3.30 1.00 1.34 0.265 B-500-1250 TL 32 3.91 1.34 C-1251-2000 TL 19 3.56 1.41 D-2001 TL and more 18 3.81 1.47 Recreation Domain A-500 TL and below 32 4.15 1.38 0.62 0.602 B-500-1250 TL 32 4.56 1.21 C-1251-2000 TL 19 4.60 1.61 D-2001 TL and more 18 4.32 1.66 Financial Domain A-500 TL and below 32 2.74 1.32 3.33 0.023 B,C,D>A B-500-1250 TL 32 3.46 1.44 C-1251-2000 TL 19 3.56 1.53 D-2001 TL and more 18 4.01 1.58 RISK-TAKING A-500 TL and below 32 3.47 0.78 1.37 0.258 B-500-1250 TL 32 3.87 0.79 C-1251-2000 TL 19 3.78 1.06 D-2001 TL and more 18 3.89 1.07It was determined that the risk-taking scores of the financial domain showed a significant difference in terms of monthly income (F=3.33; p<0.05). According to LSD post hoc test results performed to determine the difference between the groups, the risk-taking scores of the financial domain of the participants with a monthly income of 500 TL and less were significantly lower than those of the participants in the other income groups (Table 4).
It was determined that the risk-taking scale score and the risk-taking scores of the moral, social, health and recreation domains did not show a significant difference in terms of monthly income (p>0.05) (Table 4).
Table 5 shows the unpaired (two-sample) t test results of the comparison of the risk-taking scores by place of residence.
Table 5: t Test Results of the Comparison of the Risk-Taking Scores by Place of Residence
Sub-Dimensions Residence Place Of n SD t p
Moral Domain Village/Town 11 2.90 1.34 2.21 0.029
Municipalit 90 2.18 0.97
X
45
y Social Domain Village/To wn 11 4.69 0.94 -1.21 0.229 Municipalit y 90 5.06 0.96 Health Domain Village/To wn 11 3.91 0.99 0.74 0.458 Municipalit y 90 3.60 1.32 Recreation Domain Village/To wn 11 4.29 1.15 -0.26 0.793 Municipalit y 90 4.41 1.45 Financial Domain Village/To wn 11 3.48 1.62 0.31 0.760 Municipalit y 90 3.33 1.49 RISK-TAKING Village/To wn 11 3.85 0.84 0.47 0.637 Municipalit y 90 3.72 0.91It was determined that the risk-taking scores of the moral domain showed a significant difference in terms of place of residence (t=2.21; p<0.05). The risk-taking scores of the moral domain of the participants living in municipality/cities were significantly higher than those of the participants living in village/town (Table 5).
It was determined that the risk-taking scale score and the risk-taking scores of the social, health, recreation and financial domains did not show a significant difference in terms of place of residence (p>0.05) (Table 5).
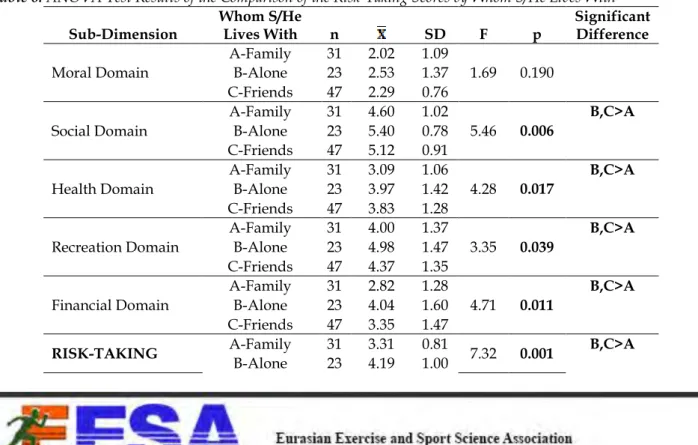
Table 6 shows the one-way analysis of variance (ANOVA) results of the comparison of the risk-taking scores by whom s/he lives with.
Table 6: ANOVA Test Results of the Comparison of the Risk-Taking Scores by Whom S/He Lives With Sub-Dimension Whom S/He Lives With n SD F p Significant Difference Moral Domain A-Family 31 2.02 1.09 1.69 0.190 B-Alone 23 2.53 1.37 C-Friends 47 2.29 0.76 Social Domain A-Family 31 4.60 1.02 5.46 0.006 B,C>A B-Alone 23 5.40 0.78 C-Friends 47 5.12 0.91 Health Domain A-Family 31 3.09 1.06 4.28 0.017 B,C>A B-Alone 23 3.97 1.42 C-Friends 47 3.83 1.28 Recreation Domain A-Family 31 4.00 1.37 3.35 0.039 B,C>A B-Alone 23 4.98 1.47 C-Friends 47 4.37 1.35 Financial Domain A-Family 31 2.82 1.28 4.71 0.011 B,C>A B-Alone 23 4.04 1.60 C-Friends 47 3.35 1.47
RISK-TAKING A-Family 31 3.31 0.81 7.32 0.001 B,C>A
B-Alone 23 4.19 1.00
X
46
C-Friends 47 3.79 0.79
It was determined that the risk-taking scores of the moral domain did not show a significant difference in terms of whom s/he lives with (p>0.05) (Table 6).
It was determined that the risk-taking scores of the social (F=5.46; p<0.05), health (F=4.28; p<0.05), recreation (F=3.35; p<0.05) and financial (F=4.71; p<0.05) domains and the general risk-taking scores (F=7.32; p<0.05) did not show a significant difference in terms of whom s/he lives with. According to LSD post hoc test results performed to determine the difference between the groups, the risk-taking scores of the social, health, recreation and financial domains, and general risk-taking scores of the participants living alone and with their friends were significantly higher than those of the participants living with their families (Table 6).
Table 7 shows the one-way analysis of variance (ANOVA) results of the comparison of the risk-taking scores by time of their interest in their sports branch.
47
Table 7: ANOVA Test Results of the Comparison of the Risk-Taking Scores By Time of Their Interest in Their Sports BranchSub-Dimension Time of Interest n SD F p Significant Difference
Moral Domain A-Less than 1 year 41 2.23 1.00 0.86 0.489 B-1-2 Years 10 2.79 1.23 C-2-3 Years 11 2.10 0.82 D-3-4 Years 11 2.03 1.35
E-5 years and
more 28 2.28 0.98 Social Domain A-Less than 1 year 41 4.98 0.93 0.39 0.812 B-1-2 Years 10 4.76 1.67 C-2-3 Years 11 5.03 1.18 D-3-4 Years 11 5.27 0.68
E-5 years and
more 28 5.07 0.68 Health Domain A-Less than 1 year 41 3.49 1.10 1.00 0.411 B-1-2 Years 10 4.26 1.33 C-2-3 Years 11 3.31 1.72 D-3-4 Years 11 3.89 1.18
E-5 years and
more 28 3.65 1.40 Recreation Domain A-Less than 1 year 41 4.23 1.30 0.42 0.797 B-1-2 Years 10 4.54 1.76 C-2-3 Years 11 4.19 1.60 D-3-4 Years 11 4.55 1.68
E-5 years and
more 28 4.61 1.33 Financial Domain A-Less than 1 year 41 2.83 1.25 2.48 0.049 D,E>A B-1-2 Years 10 3.64 1.41 C-2-3 Years 11 3.47 2.02 D-3-4 Years 11 4.12 1.29
E-5 years and
more 28 3.64 1.56 RISK-TAKING A-Less than 1 year 41 3.55 0.73 0.99 0.418 B-1-2 Years 10 4.00 1.26 C-2-3 Years 11 3.62 0.98 D-3-4 Years 11 3.97 0.99
E-5 years and
more 28 3.85 0.92
It was determined that the risk-taking scores of the financial domain showed a significant difference in terms of time of their interest in their sports branch (F=2.48; p<0.05). According to LSD post hoc test results performed to determine the difference between the groups, the risk-taking scores of the financial domain of the participants interested in their sports branch for 3-4 years and 5 years and more were significantly higher than those of the participants interested in their sports branch for less than 1 year (Table 7).
X
48
It was determined that the risk-taking scale score and the risk-taking scores of the moral, social, health and recreation domains did not show a significant difference in terms of time of their interest in their sports branch (p>0.05) (Table 7).Table 8 shows the one-way analysis of variance (ANOVA) results of the comparison of the risk-taking scores by frequency of doing sports.
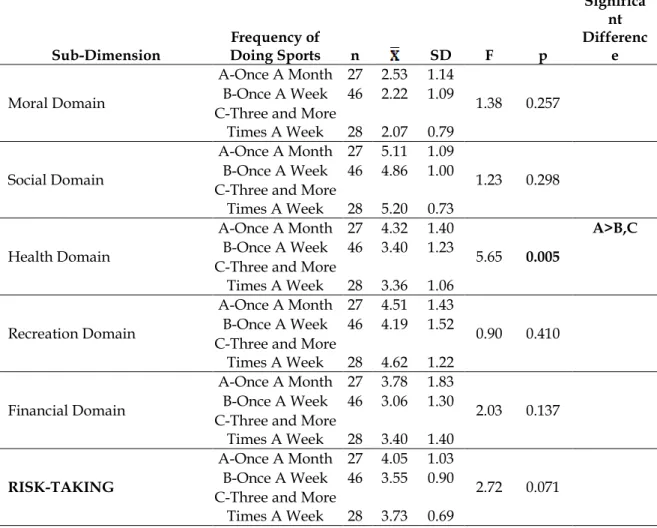
Table 8: ANOVA Test Results of the Comparison of the Risk-Taking Scores by Frequency of Doing Sports
Sub-Dimension Doing Sports Frequency of n SD F p
Significa nt Differenc e Moral Domain A-Once A Month 27 2.53 1.14 1.38 0.257 B-Once A Week 46 2.22 1.09
C-Three and More
Times A Week 28 2.07 0.79
Social Domain
A-Once A Month 27 5.11 1.09
1.23 0.298 B-Once A Week 46 4.86 1.00
C-Three and More
Times A Week 28 5.20 0.73 Health Domain A-Once A Month 27 4.32 1.40 5.65 0.005 A>B,C B-Once A Week 46 3.40 1.23
C-Three and More
Times A Week 28 3.36 1.06
Recreation Domain
A-Once A Month 27 4.51 1.43
0.90 0.410 B-Once A Week 46 4.19 1.52
C-Three and More
Times A Week 28 4.62 1.22
Financial Domain
A-Once A Month 27 3.78 1.83
2.03 0.137 B-Once A Week 46 3.06 1.30
C-Three and More
Times A Week 28 3.40 1.40
RISK-TAKING
A-Once A Month 27 4.05 1.03
2.72 0.071 B-Once A Week 46 3.55 0.90
C-Three and More
Times A Week 28 3.73 0.69
It was determined that the risk-taking scores of the health domain showed a significant difference in terms of frequency of doing sports (F=5.65; p<0.05). According to LSD post hoc test results performed to determine the difference between the groups, the risk-taking scores of the health domain of the participants doing sports once a month were significantly higher than those of the participants doing sports once a week, three and more times a week (Table 8).
It was determined that the risk-taking scale score and the risk-taking scores of the moral, social, recreation and financial domains did not show a significant difference in terms of frequency of doing sports (p>0.05) (Table 8).
Moreover, the self-esteem scores did not show a significant difference in terms of demographic characteristics (p<0.05).
Table 9 includes the results of Pearson correlation analysis showing the relationship between the scale scores.
Table 9: Results of Pearson Correlation Analysis Between Self-Esteem and Risk-Taking
Variables 2 3 4 5 6 7 8 9 10 11 12
1.Self-Esteem 0.80** -0.71** 0.60** 0.67** 0.91** -0.21* 0.14 -0.17 -0.06 -0.12 -0.13 X
49
2.Self-Confidence 1 -0.59** 0.55** 0.68** 0.87** -0.31** 0.17 -0.13 0.04 -0.11 -0.10 3.Depressive Affect 1 -0.49** -0.70** -0.82** 0.12 0.14 0.32** 0.18 0.31** 0.31** 4.Self-Sufficiency 1 0.58** 0.73** -0.16 0.11 -0.11 0.00 -0.09 -0.08 5.Achievement and Productivity 1 0.84** -0.24* -0.04 -0.22* -0.04 -0.14 -0.19 6. SELF-ESTEEM 1 -0.25* 0.07 -0.22* -0.05 -0.17 -0.18 7. Moral Domain 1 -0.07 0.47** 0.25* 0.47** 0.58** 8. Social Domain 1 0.34** 0.48** 0.22* 0.52** 9. Health Domain 1 0.54** 0.56** 0.83** 10. Recreation Domain 1 0.49** 0.79** 11.Financial Domain 1 0.80** 12. RISK-TAKING 1 *p<0.05 **p<0.01A negative and significant relationship was determined between the self-esteem scores and the risk-taking scores of the moral domain (r=0.21; p<0.05). Individuals with high self-esteem had low risk-risk-taking behaviors of the moral domain (Table 9). There was not any significant relationship between the self-esteem scores and the taking scores of the social, recreation, health, financial domains, and the general risk-taking scores (p<0.05) (Table 9).
A negative and significant relationship was determined between the self-confidence scores and the taking scores of the moral domain (r=0.31; p<0.05). Individuals with high self-confidence had low risk-taking behaviors of the moral domain (Table 9). There was not any significant relationship between the self-confidence scores and the risk-taking scores of the social, recreation, health, financial domains, and the general risk-taking scores (p<0.05) (Table 9).
A positive and significant relationship was determined between the depressive affect scores and the health (r=0.32; p<0.05), financial (r=0.31; p<0.05) sub-dimension and risk-taking scale (r=0.31; p<0.05) scores of the moral domain. Individuals with high depressive affect had high risk-taking behaviors in general and in terms of health and financial domains (Table 9). There was not any significant relationship between the depressive affect scores and the moral, social and recreation domain scores (p>0.05) (Table 9).
There was not any significant relationship between the self-sufficiency scores and the risk-taking scale and sub-dimension scores (p>0.05) (Table 9).
A negative and significant relationship was determined between the achievement and productivity scores and the risk-taking scores of the moral (r=-0.24; p<0.05) and health (r=-0.22; p<0.05) domains. Individuals with high level of achievement and productivity had low risk-taking behaviors of the moral and health domains (Table 9). There was not any significant relationship between the achievement and productivity scores and the risk-taking scores of the social, recreation, financial domains, and the general risk-taking scores (p<0.05) (Table 9).
A negative and significant relationship was determined between the self-esteem scores and the risk-taking scores of the moral (r=-0.25; p<0.05) and health (r=-0.22; p<0.05) domains. Individuals with high self-esteem had low risk-taking behaviors of the moral and health domains (Table 9). There was not any significant relationship between the self-esteem scores and the risk-taking (r=-0.22; p<0.05) scores of the social, recreation, financial domains, and the general risk-taking scores (p<0.05) (Table 9).
A negative and significant relationship was determined between the depressive affect scores and the socialization (r=-0.23; p<0.05), psychological development (r=-0.20; p<0.05), moral development (r=-0.22; p<0.05), emotional development (r=-0.22; p<0.05), social integration in sports scale (r=-0.20; p<0.05) scores. Individuals with high depressive affect had low level of perception that sports provides socialization, psychological development, moral development, emotional development and integration in sports (Table 9). There was not any significant relationship between the depressive affect scores and the personal development, physical benefit and integration sub-dimension scores (p>0.05) (Table 9).
5. Discussion and Conclusion
When the data obtained from the research were examined;
1. When the self-esteem scores of the participating students were examined, they were "high" level (Table 2),
2. The participating students showed "medium level" of the risk-taking behavior (Table) according to their scores of the risk-taking scale; the risk-taking scores of the financial domain of the male participants were
50
significantly higher than those of the female participants (Table 3) and the risk-taking scores of the financial domain of the students with a monthly income of 500 TL and less were significantly lower than the participants in the other group (Table 4). However, the risk-taking scores of the moral domain showed a significant difference in terms of place of residence; the risk-taking scores of the moral domain of the participants living in municipality/cities were significantly higher than those of the participants living in village/town (Table 5); the risk-taking scores of the social, health, recreation, financial domains, and the general risk-taking scores showed a significant difference in terms of whom s/he lives with; the risk-taking scores of the social, health, recreation and financial domains, and general risk-taking scores of the participants living alone and with their friends were significantly higher than those of the participants living with their families (Table 6),3. The risk-taking scores of the health domain showed a significant difference in terms of frequency of doing sports; the risk-taking scores of the health domain of the participants doing sports once a month were significantly higher than those of the participants doing sports once a week, three and more times a week (Table 8),
4. A negative and significant relationship was determined between the self-esteem scores and the risk-taking scores of the moral domain. Individuals with high self-esteem had low level of the risk-risk-taking behaviors of the moral domain (Table 9),
5. A negative and significant relationship was determined between the self-confidence scores and the risk-taking scores of the moral domain. Individuals with high self-confidence had low level of the risk-risk-taking behaviors of the moral domain (Table 9),
6. A positive and significant relationship was determined between the depressive affect scores and the health and financial sub-dimensions and risk-taking scale scores of the moral domain. Individuals with high depressive affect had high level of the risk-taking behaviors in general and in terms of health and financial domains (Table 9),
7. A negative and significant relationship was determined between the achievement and productivity scores and the risk-taking scores of the moral and health domains. Individuals with high level of achievement and productivity had low level of the risk-taking behaviors of the moral and health domains (Table 9),
8. A negative and significant relationship was determined between the self-esteem scores and the risk-taking scores of the moral and health domains. Individuals with high self-esteem had low level of the risk-taking behaviors of the moral and health domains (Table 9),
9. A negative and significant relationship was determined between the depressive affect scores and the scores of the socialization, psychological development, moral development, emotional development and social integration in sports. Individuals with high depressive affect had low level of perception that sports provides socialization, psychological development, moral development, emotional development and integration in sports (Table 9).
The research was conducted on the university students by Baskara (4) and found that students in the 20-25 age groups had high self-esteem. The result of current study indicated that male students have high level of self-esteem than female students (3) but in this research not found any differences between gender.
Similarly, it was observed that students had generally high level of self-esteem, there was not any significant difference between the self-esteem of the female and male university students and there was not any significant relationship between their self-esteem and their departments and class levels as a result of Odaci' s research (14) on the levels of loneliness, self-esteem and close relationships of the university students.
When the studies on the risk-taking behavior were examined, the young people exhibited higher risky behaviors due to their increased autonomy generally in their late adolescence compared to their mid-adolescence period (6).
Many studies demonstrated that gender was an important determinant and men showed more risk-taking behaviors than women (16,18).
Irmak et.all (13) states that university students, who are separated from their families and begin to take decisions on many issues (choice of friends, time to go home, not using alcohol and drugs, etc.), have the opportunity to try various risk taking behaviors in different friend settings and men have a lower risk perception than women, they evaluate the results of risk behaviors more positively and parents approve the risk behaviors of men more.
Camur et al. (7) indicated in their research that the risky behaviors of the people are influenced by
51
their place of residence and those living alone, with their friends or in a dormitory showed more risky behaviors than those living with their families or relatives. Then, the people with whom they share their living space have been seen effective in directing risky behavior. Moreover, it has been also considered that the young people who grew in places where more traditional lifestyles such as village/town were dominated turned to risky behaviors to prove themselves and be accepted by new friends when they started their university life and left the house. Karahan et al. (12) listed the reasons of the risk-taking and pawning behavior as being able to participate in groups of friends, opposing family pressure and traditional social structure, desire to control their own life, waiting for approval of their identity and being able to cope with emotions such as anxiety, inadequacy and failure.As the time spent with peers increases, the opportunity and time for performing risk taking behaviors are increasing. Also peer pressure increases risk-taking behavior (10).
Aktas and Erhan (1) compared the groups that did or did not regularly sports according to their risk-taking scores in their research and indicated that the scores of the group doing sports were significantly higher than those of the group not doing sports. This result conflicts with the results from our research. Doing regularly sports is an important factor in creating awareness of the risks involved in sports. However, it has been considered that doing sports once a month does not raise awareness about the risks that may arise and thus, leads to taking the risk that will provide a basis for the emergence of dangerous results.
When the results of the research are generally evaluated, there is a significant and negative relationship between self-esteem and risk-taking behavior. It is possible to turn to risk behaviors in order to avoid or deal with negative emotions that arise from low self-esteem, such as feeling worthless and unimportant oneself and not being liked by others. When the literature is examined, one of the personal variables associated with the risk-taking behavior has been stated as self-esteem (17).
According to the results obtained from the research, considering that the university is an important turning point in the lives of young people, elective courses should be diversified to help them to know themselves, to meet other people and to increase their self-confidence, and socio-cultural activities should be organized to take important opportunities for self-acceptance and making themselves accepted, and to contribute to their socialization, thereby increasing self-esteem and causing to decrease in risk-taking behaviors.
References
1. Aktaş İ, Erhan SE. Spor Yapan ve Spor Yapmayan Bireylerin Benlik Saygısı ve Risk Alma Düzeylerinin İncelenmesi (Erzurum İli Örneği). Sportif Bakış: Spor ve Eğitim Bilimleri Dergisi, 2015; 2 (2), 40-51, 2015 2. Arıcak T. Grupla psikolojik danışma yoluyla benlik saygısının geliştirilmesi (Yayımlanmamış doktora
tezi). Marmara Üniversitesi, 1999; İstanbul
3. Arshad M., Haider Zaidi SMI, Mahmood K. Self-Esteem & Academic Performance among University Students. Journal of Education and Practice www.iiste.org ISSN 2222-1735 (Paper) ISSN 2222-288X (Online) 2015; Vol.6, No.1, 2015.
4. Başkara SV. Özsaygının Bazı Değişkenler Açısından İncelenmesi, Yüksek Lisans Tezi, Ankara Üniversitesi.Sosyal Bilimler Enstitüsü.2002; Ankara
5. Büyüköztürk Ş. Sosyal Bilimler İçin Veri Analizi El Kitabı (14. Baskı). Ankara. 2011. PEGEM Akademi. 6. Byrnes JP, Miller DC, Schafer WD. Gender differences in risk taking: A meta-analysis. Psychol Bull 1999 ;
125: 367-383.
7. Çamur D, Üner S, Çilingiroğlu N, Özcebe H. Bir üniversitenin bazı fakülte ve yüksekokullarında okuyan gençlerde bazı risk alma davranışları. Toplum Hekimliği Bülteni, 2007; 26(3), 32-38. [66].
8. Dabak, Ş, Suenter AT, Canbaz S, Pekşen Y. Risky Behavior Prevalence Among Ondokuz Mayıs University Students. Turkiye Klinikleri Journal of Medical Sciences, 2010; 30(3), 838- 846. DOI: 10.5336/medsci.2008-9668
9. Grunbaum JA, Kann L, Kinchen S, Ross J, Hawkins J, Lowry R, Harris WA, McManuts T, Chyen D, Collins J. Youth risk behavior surveillance--United States, 2003. Morbidityand Mortality Weekly Report. 2004; 53(2), 1-96.
10. Güney KN. Investigation of motives for adolescent risk taking in terms of egocentrism, peer pressure, ses and gender. Ilkogretim Online, 2013; 12(2), 445-460.
11. Gürsel S. Tehlikeyi kanıksama ve risk alma arasındaki ilişkinin özel güvenlik personeli üzerinde incelenmesi. (Yayımlanmamış yüksek lisans tezi). Kara Harp Okulu, Savunma Bilimleri Enstitüsü, 2010.
52
Ankara.12. Karahan TF, Sardoğan ME, Gençoğlu C, Yılan G. Lise öğrencilerinde trafik, madde kullanımı ve toplumsal konumla ilgili risk alma davranışı. Eğitim ve Bilim, 2007; 31(142), 72-79.
13. Irmak TY, Kızıltepe R, Gümüşten D, Çengelci Özekes B. Üniversite Öğrencilerinde Risk Alma Davranışlarının Yordayıcıları. Türk Psikolojik Danışma ve Rehberlik Dergisi. 2008; 8(51), 29-52.
14. Odacı H. Karadeniz Teknik Üniversitesi Fatih Eğitim Fakültesi Öğrencilerinin yalnızlık, benlik saygısı ve yakın ilişkiler kurabilme düzeylerinin ve bu düzeyler arasındaki ilişkilerin incelenmesi. Yüksek Lisans Tezi. 1994. Karadeniz Teknik Üniversitesi Sosyal Bilimler Enstitüsü.
15. Oktan V. Ergenlerde Kendine Zarar Verme Davranışının Risk Alma Davranışı ve Benlik Saygısı Açısından İncelenmesi. Eğitim ve Bilim. 2014; Cilt 39, Sayı 175, 183-191.
16. Özkan, MS, Dündoğan S, Eldeleklioğlu J. An Analysis of Risk Taking Behaviors of High School Students in Terms of Their Decision Making Skills and Various Factors. Elementary Education Online, 2018; 17(3): pp. 1238-1251
17. Özmen O, Hatipoğlu Sümer Z. Predictors of risk-taking behaviours among Turkish adolescents. Pers Indiv Differ. 2011; 50: 4- 9. doi:10.1016/j.paid.2010.07.015
18. Refaal A. Practice and awareness of health risk behaviour among Egyptian university students. EMHJ. 2004; 10(1– 2):72–81.
19. United Nations Population Fund (UNFPA) Report (2014). https://www.unfpa.org/annual-report-2014
20. WHO Adolescent Friendly Health Services. Geneva: World Health Organization.2002
http://www.searo.who.int/en/section13/section1245_4980.htm. 21. Yetim A. Sosyoloji ve Spor. Topkar Matbaacılık, Trabzon. 2005; s.119 22. Yörükoğlu A. Gençlik Çağı,.Ankara: 1985. Tisa Matbaası.