Spectrum Measurement of Variable Irradiance
Controlled LED-Based Solar Simulator
Vedat Esen*
‡, Şafak Sağlam**, Bülent Oral**,Özge Ceylan Esen***
*Department of Electricity, Vocational School, İstanbul Arel University, Sefakoy Campus, 34295, İstanbul, Turkey **Department of Electrical-Electronics Engineering, Faculty of Technology, Marmara University, Göztepe Campus, 34722,
İstanbul, Turkey
***Department of Industrial Design, Faculty of Architecture, Mimar Sinan Fine Arts University, Fındıklı Campus, 34427, İstanbul, Turkey
([email protected], [email protected], [email protected], [email protected])
‡ Corresponding Author; Vedat Esen, İstanbul Arel University, Sefakoy Campus, 34295, İstanbul, Turkey,
Tel: +90 212 540 9696, Fax: +90 212 540 9797, [email protected]
Received: 23.12.2019 Accepted:03.02.2020
Abstract- Efficiency of photovoltaic devices are based on testing all equipment and systems used to produce devices in a healthy way, from electrical and optical points of view. Considering that photovoltaic devices which enable the generation of electric energy from solar energy as a renewable energy source are widely used solar simulators should be utilized to provide actual daylight spectrum distributions. The most considerable component of solar simulators in photovoltaic device research is the light sources they use. Due to their advantages over conventional light sources, such as compactness, low power consumption, and low cost, research and studies on solar simulators use LEDs took place as their illumination source. In this study, it is aimed to produce a low-cost Class A solar simulator with using six different type power LEDs, as specified in the IEC 60904-9 and ASTM E927-05 standards. At the end of the study with 24 power LEDs with six different wavelengths, the spectral match which is one of the three performance criteria of the solar simulator was obtained as Class A. This study shows that LED-based solar simulators provide great savings in terms of energy consumption as well as a huge advantage in cost, compared to the widely used xenon arc lamp solar simulators.
Keywords Solar energy; light emitting diodes; photovoltaic effects; simulation; spectroradiometers.
1. Introduction
The use of solar energy as a renewable energy source and of related photovoltaic systems is increasing day by day. Thus, to ensure the reliability of solar cells, testing their performance becomes the most important issue [1]. With rapidly developing technologies and studies, the transformation of photovoltaic solar cells into increasingly complex structures leads to difficulties in obtaining the current voltage (I-V) characteristics of solar panels. Therefore, the use of solar simulators, which have evolved in recent years, is inevitable to calibrate and test photovoltaic devices [2, 3]. The efficiency of photovoltaic devices depends on the electrical and optical testing of all equipment and systems used to produce cells [4]. Thus, considering the
world’s energy consumption, solar simulators that obtain the actual daylight irradiance are a necessity [5]. Photovoltaic panels convert solar energy to electric energy without frequent maintenance and have robust and uncomplicated designs that perform direct conversion. The most important characteristic parameters of photovoltaic devices, such as maximum power (PMAX), the current voltage (I-V) curve,
open circuit voltage (VOC) and short circuit current (ISC) are
built under real atmospheric circumstances [6-9]. Solar simulators ensure optical and spectral ranges with a similar intensity to sunlight, and they are capable of testing basic-purpose solar cells and photovoltaic devices in a controlled manner, under standard conditions: 1.5 G air mass (AM 1.5 G) spectrum, 1000 W/m2 solar irradiance, and 25 °C cell
photovoltaic devices are set out in a series of studies on two research lines supported by the Energy Research and Development Administration and the National Aeronautics and Space Administration. Standards for terrestrial photovoltaic measurement procedures were established after studies in the 1970s and include detailed descriptions of solar simulators [18-20]. These an air mass of 1.5 spectral parts when selecting a standard density of 1000 W/m2, and the
American Society for Testing and Materials (ASTM) standards use both values for commercial solar simulators [21]. The AM1.5 G spectral component is commonly used in concentrated solar system investigations (see Figure.1).
Solar simulators can simulate actual sunlight as terrestrial and out-of-atmosphere radiation [22]. The international standards for the solar simulation of photovoltaic tests (ASTM 927-05 [23], JIS C 8912 [24] and IEC 60904-9 [25]) are based on three criteria: temporal instability, spatial non-uniformity, and spectral match of the solar simulator [26, 27]. The amount of sunlight falling on the Earth’s surface depends on geographical impact and seasonal parameters [22]. For photovoltaic panel testing, the air mass is standardized as AM 0, AM 1D, AM 1G, AM 1.5 D, AM 1.5 G, AM 2D, or AM 2G [28,29]. According to Al- Ahmad et al., “Solar simulation can be broadly classified into the irradiance above the atmosphere, i.e., with zero air mass (AM), AM 0, and air mass 1.5, corresponding to an optical path through the atmosphere of 1.5 times the vertical path of AM 1. AM 1.5 is further separated into AM 1.5 D for direct illumination of solar concentrators and AM 1.5 G, an integrated irradiance of 100 mW/cm2 for global illumination
inclusive of sky emission and scatter” [30]. Table 1 shows the international standard references for tests performed with solar simulators.
The aim of this study is to produce a low-cost Class A solar simulator with power LEDs of 6 different wavelengths and the IEC 60904-9 and ASTM E927-05 standards. For this purpose, wavelengths were measured in a mirror-covered box with 24 power LEDs, by means of a spectroradiometer that could also measure ultraviolet (UV) and infrared (IR) wavelengths. At the end of the study, spectral match one of the requirements for solar simulators specified in the IEC 60904-9 and ASTM E927-05 standard with 24 power LEDs and 6 different wavelengths was obtained at Class A. However, the 1000 W/m2 requirement was not achieved.
Future studies with revised features and combinations of LEDs should obtain this value.
2. Solar Simulator for Photovoltaic Devices 2.1. Solar Simulator Classifications
A solar radiation level of 1000 W/m2 was chosen as a
unit (1 sun = 1000 W/m2). ASTM E927 and IEC 60904-9
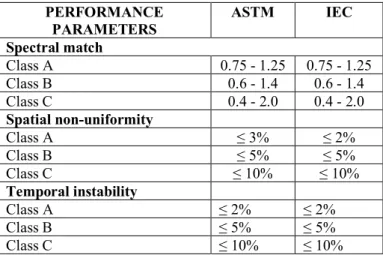
classify the simulated performance of solar simulators as Class A, Class B, or Class C [35, 36]. These classifications specify three main criteria: spectral match, spatial non-uniformity, and temporal instability [37]. Table 2 lists these criteria [38].
To measure spectral match, the wavelength region is restricted to between 400 nm and 1100 nm and is divided into six bands [1], [23]. Each of these bands includes a specific percentage of the total radiation, as listed in ASTM E927-05. Table 3 shows the required light source radiation ratios for solar simulators, as specified in the standards.
As a performance criterion for solar simulators, spectral match is extremely necessary to ensure that the real world situation and test conditions are identical [39]. Spectral match is the ratio of the required irradiation percentage to the real percentage of light falling along the respective wavelength interval (Eq. 1) [40].
(1) The “actual irradiance in the interval” required to find the spectral match is found by Equation 2:
(2) S(λ) in Eq. 2 is the light source’s spectral irradiation.
Spectral irradiation is the distribution of light as a function of wavelength. λn is the starting point of the corresponding
wavelength range, and λn+1 is the ending point. The spectral
matching is directly related to the light source used in the solar simulator. If the source’s spectral composition source matches the spectral glow of the AM 1.5G reference spectral glow, then the spectrum will be an exact match. The ability to simulate the expected spectral coherence will be of great help in designing a solar simulator.
Mohan et al. explain spatial non-uniformity (SNU) as “a
difficult property that minimizes hot spots due to condensation of light in certain points, especially in simulators with large surface areas, affecting photovoltaic cell performance tests. SNU is calculated in which Emax is the
maximum intensity on the given test section and Emin is the
minimum intensity” [40] (Eq. 3).
Table 1. International standards for solar simulator tests
The third criterion used in classifying simulators is temporal instability. Bazzi et al. explained this concept as follows; “the temporal instability of irradiance is calculated in a manner similar to SNU but with E measured at a particular point on the test plane during the time interval of data acquisition” [41].
Table 2. Classifications of solar simulator performance PERFORMANCE PARAMETERS ASTM IEC Spectral match Class A 0.75 - 1.25 0.75 - 1.25 Class B 0.6 - 1.4 0.6 - 1.4 Class C 0.4 - 2.0 0.4 - 2.0 Spatial non-uniformity Class A ≤ 3% ≤ 2% Class B ≤ 5% ≤ 5% Class C ≤ 10% ≤ 10% Temporal instability Class A ≤ 2% ≤ 2% Class B ≤ 5% ≤ 5% Class C ≤ 10% ≤ 10%
Table 3. Distribution of irradiance performance requirements WAVELENGTH (nm) PERCENTAGE OF TOTAL IRRADIANCE AM1.5G 400 – 500 18.4% 500 – 600 19.9% 600 – 700 18.4% 700 – 800 14.9% 800 – 900 12.5% 900 – 1100 15.9%
2.2. Light Sources Used in Solar Simulators
The most important part of a solar simulator’s design is the light source. The lighting pattern, light flux stability, and light interval’s spectral characteristics should be handled with precision when selecting the light source [42]. Different light sources are used to simulate sunlight according to ASTM standards [36]. Figure 2 shows the wavelengths of the light sources [22], [43–45].
Short and long arc xenon lamps are the most commonly used light sources in solar simulators. Some conventional solar simulator designs use metal halide arc lamps, carbon arc lamps, and quartz tungsten halogen lamps as light sources [29]. Nowadays, light-emitting diodes (LEDs) are used as light sources in solar simulator design due to their advantages over traditional light sources, such as their low cost, compactness, and lower power consumption [28, 46,47].
Fig. 2. The wavelength range of light sources Organization Standard Number Standard Name
IEC 60904-9 Solar Simulator Performance Requirements [25]
ASTM G173-03 Standard Tables for Reference Solar Spectral Irradiances: Direct Normal and Hemispherical on 37° Tilted Surface [31]. ASTM E927-05 Standard Specification for Solar Simulation for Terrestrial Photovoltaic Testing [23]. ASTM E927-10 Standard Specification for Solar Simulation for Photovoltaic Testing [32].
ASTM E948-16 Standard Test Method for Electrical Performance of Photovoltaic Cells Using Reference Cells Under Simulated Sunlight [33].
ASTM E973-16 Standard Test Method for Determination of the Spectral Mismatch Parameter between a Photovoltaic Device and a Photovoltaic Reference Cell [34].
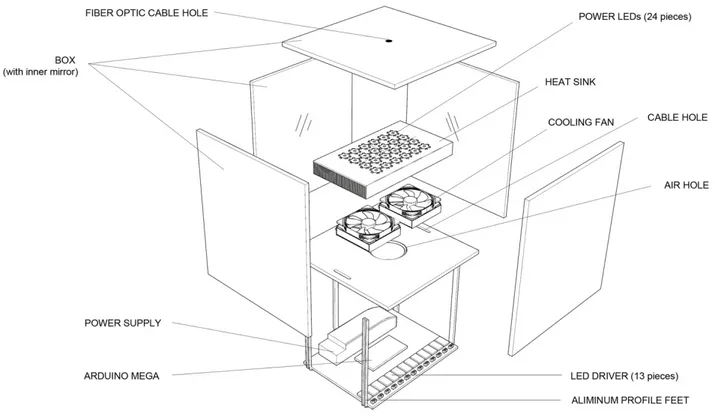
Fig. 3. Solar simulator main components 3. Experimental Setup
3.1. Solar simulator main components
The main components of the solar simulator designed for this study are:
Ø A laser-cut wooden box covered with an inner mirror,
Ø An aluminum heat sink, Ø Two cooling fans, Ø A 75 W power supply, Ø 13 LED drivers, Ø An Arduino Mega 2560,
Ø Four 5500 K (Kelvin) cool white LEDs, Ø Four 4000 K (Kelvin) warm white LEDs, Ø Four 470 nm blue LEDs,
Ø Four 740 nm red LEDs, Ø Four 850 nm infrared LEDs, Ø Four 940 nm infrared LEDs and Ø Aluminum profile feet.
A solar simulator was designed and manufactured using these materials. Figure 3 details all components of the solar simulator.
3.2. Experiment
A total of 24 LEDs in six different wavelengths were initially mounted with high sensitivity on single-star PCBs. The LEDs were then placed symmetrically on the aluminum heat sink. The heat transfer for the assembly process was high, and insulating tape was used (Figure 4). Two cooler fans were added under the aluminum heat sink and placed inside the main box. The LEDs, heat sink, and cooler fans were placed together, and the inner side of the box was covered with a mirror to allow for healthier wavelength measurement.
Appropriate LED drivers were chosen by considering the power and currents of the LEDs used. The LED drivers were regulated by an Arduino Mega 2560 microprocessor and software, so that the desired spectral values could be reached. The microprocessor, LED drivers, and power supply together formed a single power and control circuit in the lower part of the main box (Figure 5).
Fig. 5. LED driver board 3.3. Spectral Match
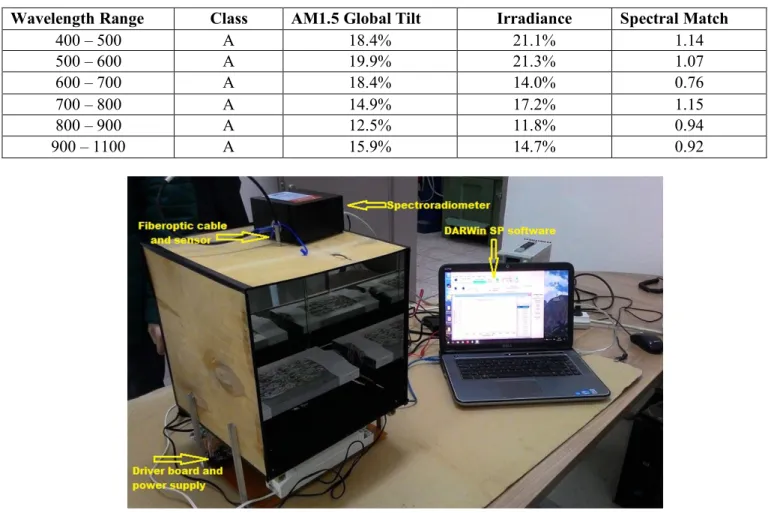
After the system components were assembled, the spectral match was tested. The IEC 60904-9 and ASTM E927-05 standards mandate the test described in the previous sections. For this reason, measurements were made with a Spectral Evolution SR-500 spectroradiometer. The fiber optic cable connected to the spectroradiometer was fixed to the other core, so that the LEDs outside the ceiling center of the main box containing the LEDs can be viewed at a 90° right angle. The test setup consisted of the solar simulator, a SR-500 Spectroradiometer, a fiber optic cable, and a laptop computer running DARWin SP software (Figure 6).
4. Result and Discussion
Using the measurements, the LEDs were driven with the drive circuit and the graphs and values in Figure 7 were obtained. According to the measurements, each LED has its own characteristic wavelength. Warm and cool white LEDs and blue LEDs obtained wavelengths between 400-700 nm. The 700-1100 nm chart was obtained with red, 850 and 940 nm IR LEDs. The comparison of the spectral match AM 1.5 G measured and calculated by the spectroradiometer is given in Table 4. Thus, the values obtained for all wavelength ranges expressed Class A, according to Table 1. The spectral matching value in the wavelength range of 600-700 nm was found to be at the boundary despite the Class A. In future work, it will be possible to obtain a more normal range by making appropriate changes to the number of warm white and red LEDs and their combinations. In Figure. 8, the orange lines show the range of Class A, and the dots show the range of the measured solar simulator values. Since the LEDs used in the study could only achieve an average light intensity of 350W/m2, the other two performance criteria
spatial non- uniformity and temporal instability were not calculated.
Table 4. Spectral match comparison for LED-Based Solar Simulator design (Using AM 1.5 global tilt)
Wavelength Range Class AM1.5 Global Tilt Irradiance Spectral Match
400 – 500 A 18.4% 21.1% 1.14 500 – 600 A 19.9% 21.3% 1.07 600 – 700 A 18.4% 14.0% 0.76 700 – 800 A 14.9% 17.2% 1.15 800 – 900 A 12.5% 11.8% 0.94 900 – 1100 A 15.9% 14.7% 0.92
Fig. 7. Relative spectral irradiation measurements of the solar simulator design
Fig. 8. IEC 60904-9 and ASTM E927-05 spectral match graph for the LED-based solar simulator design (using AM 1.5 global tilt)
5. Conclusions
In this study, a solar simulator was designed using LEDs with six wavelengths (cool white, warm white, 470 nm blue, 740 nm red, and 850 and 940 nm IR). The spectral match values obtained by spectroradiometer were as follows: 1.14 for 400-500 nm, 1.07 for 500-600 nm, 0.76 for 600-700 nm, 1.15 for 700-800 nm, 0.94 for 800-900 nm and 0.92 for 900-1100 nm. Based on these results, the designed LED-based solar simulator provided Class A for the spectral match, which is one of the three performance criteria according to IEC 60904-9 and ASTM E927-05. Thus, solar simulators designed for photovoltaic panel testing can achieve Class A spectral matching using LEDs of six wavelengths.
This study revealed the following:
Ø LED-based solar simulators provide great savings in
in cost, compared to the widely used xenon arc lamp solar simulators.
Ø LEDs reduce the cost of solar simulator production. Ø Spectral match which is indicated in the IEC and ASTM standards, can be obtained at the Class A level in the solar simulators using LEDs.
Ø In future studies, 1000 W / m2 irradiation intensity
specified in IEC and ASTM can be achieved in solar simulators by changing led varieties and combinations.
Ø Spatial non-uniformity and temporal instability, which are indicated in the IEC and ASTM standards, can be obtained at the Class A level in the solar simulators using LEDs.
Acknowledgment
This project is supported by the Marmara University Scientific Research Committee. Project No: FEN-E-120514-0149 and Project No: FEN-C-DRP120417-0174
References
[1] V. Esen, Ş. Sağlam, B. Oral, “Light sources of solar simulators for photovoltaic devices: A review”, Renewable and Sustainable Energy Reviews, vol. 77, pp. 1240-1250, 2017.
[2] R. Galleano, I. Kröger, F. Plag, S. Winter, H. Müllejans, “Traceable spectral irradiance measurements in photovoltaics: Results of the PTB and JRC spectroradiometer comparison using different light sources”, Measurement, vol. 124, pp. 549-559, 2018.
[3] H. Müllejans, A. Ioannides, R. Kenny, W. Zaaiman, H. A. Ossenbrink, E. D. Dunlop, “Spectral mismatch in calibration of photovoltaic reference devices by global sunlight method”, Measurement Science and Technology, vol. 16, no. 6, pp 1250-1254, 2005.
[4] T. Dennis, J.B. Schlager, “A Novel Solar Simulator Based on a Supercontinuum Laser for Solar Cell Device and Materials Characterization”, IEEE Journal of Photovoltaics, vol. 4, no. 4, pp. 1119-1127, 2014.
[5] M. Bliss, S. Wendlandt, T.R. Betts, R. Gottschalg, “Towards A High Power, All Led Solar Simulator Closely Matching Realistic Solar Spectra”, 24th European Photovoltaic Solar Energy Conference, pp. 3321- 3326, 2009.
[6] O. Henni, M. Belarbi, K. Haddouche, E. Belarb, “Design and Implementation of a Low-Cost Characterization System for Photovoltaic Solar Panels”, International Journal of Renewable Energy Research (IJRER), vol. 7, no. 4, pp. 1586–1594, 2017.
[7] A.R. Gxasheka, E.E. Van Dyk, E.L. Meyer, “Evaluation of performance parameters of PV modules deployed outdoors”, Renewable Energy, vol. 30, no. 4, pp. 611–20, 2005.
[8] F. Adamo, F. Attivissimo, A. Di Nisio, M. Spadavecchia, “Characterization and testing of a tool for photovoltaic panel modeling”, IEEE Transactions on Instrumentation and Measurement, vol. 60, no. 5. pp. 1613–22, 2011.
[9] B. Parida, S. Iniyan, R. Goic, “A review of solar photovoltaic Technologies”, Renewable and Sustainable Energy Reviews, vol. 15, no. 3, pp. 1625–36, 2011.
[10] P.S. Vicente, G.L. Reis, E.M. Vicente, “Development of a solid-state solar simulator to test PV modules”, IEEE 13th Brazilian Power
Electronics Conference and 1st Southern Power Electronics Conference (COBEP/SPEC), pp.1-4, 2015
[11] B.H. Hamadani, K. Chua, J. Roller, M.J. Bennahmias, B. Camp-bell, H.W. Yoon, B. Dougherty, “Towards realization of a large area light emitting diode based solar simulator”, Progress in Photovoltaics: Research and Applications, vol. 21, no. 4, pp. 779-789, 2013.
[12] X. Dong, Z. Sun, G.J. Nathan, P.J. Ashman PJ, D. Gu, “Time-resolved spectra of solar simulators employing metal halide and xenon arc lamps”, Solar Energy, vol. 115, pp. 613-620, 2015.
[13] H.B. Serreze, J.E. Burns, M. Stein, N. Chandrasekhar, “A new generation of compact solar simulators”, 38th IEEE Photo-voltaic Specialists Conference (PVSC), pp. 459-463, 2012
[14] S. H. Jang, M.W. Shin, “Fabrication and thermal optimization of LED solar cell simulator”, Current Applied Physics, vol. 10, no. 3, pp. 537-S539, 2010. [15] J. Dubard, J.R. Filtz, V. Cassagne, P. Legrain, “Photovoltaic module performance measurements traceability: Uncertainties survey”, Measurement, vol. 51, pp. 451-456, 2014.
[16] S. Winter, T. Fey, I. Kröger, D. Friedrich, K. Ladner, B. Ortel, F. Witt, “Design, realization and uncertainty analysis of a laser-based primary calibration facility for solar cells at PTB”, Meas-urement., vol. 51, pp. 457-463, 2014.
[17] T. Nakajima, K. Shinoda, T. Tsuchiya, “Single-LED solar simu-lator for amorphous Si and dye-sensitized solar cells”, Rsc Advances, vol. 4, no. 37, pp. 19165-19171, 2014.
[18] W. Wang, “Simulate a ‘sun’ for solar research: A literature review of solar simulator technology”, Department of Energy Technology, 2014.
[19] H. Brandhorst, J. Hickey, H. Curtis, E. Ralph, Interim solar cell testing procedures for terrestrial applications, NASA TM X-71771, 1975.
[20] ERDA/NASA, Terrestrial photovoltaic measurement procedures, NASA TM-73702, 1977. [21] M. G. Villalva, J. R. Gazoli, E. Ruppert Filho,
“Comprehensive approach to modeling and simulation of photovoltaic arrays”, IEEE Transactions on power electronics, vol. 24, no. 5, pp. 1198-1208, 2009.
[22] Q. Meng, Y. Wang, L. Zhang, “Irradiance characteristics and optimization design of a large- scale solar simulator,” Solar Energy, vol. 85, no. 9, pp. 1758–67, 2011.
[23] ASTM. E927-05, Standard Specification for Solar Simulation for Photovoltaic Testing, ASTM International, West Conshohocken, PA, USA.
[24] R.T. Chen, J. L. H. Chau, G.L. Hwang, “Design and fabrication of diffusive solar cell window”, Renewable energy, vol. 40, no. 1, pp. 24-28, 2012. [25] IEC 60904-9, International Electrotechnical
Commission Stand-ard for Solar Simulator Performance Requirements, 2007.
[26] H.B. Serreze, H.M. Sobhie, S.J. Hogan, “Solar simulators-beyond Class A”, 34th IEEE photovoltaic specialists conference (PVSC), pp. 100–5, 2009.
[27] C. Yang, J. Wang, X. Guo, Y. Wang, Z. Ding, “A Multisource regular dodecahedron solar simulator structure for uniform flux”, IEEE Journal of Photovoltaics, vol. 6, no. 2, pp. 516–21, 2016. [28] C.A. Gueymard, D. Myers, K. Emery, “Proposed
reference irradiance spectra for solar energy systems testing”, Solar energy, vol. 73, no. 6, pp. 443-467, 2002.
[29] N. Riedel, L. Pratt, A. Edler, F. Haas F, “Effects of a neutral density filter in measuring low- light performance with a pulsed light Xe arc solar simulator”, IEEE 42nd photovoltaic specialist conference (PVSC), pp. 1-4, 2015.
[30] A. Y. Al-Ahmad, J. Holdsworth, B. Vaughan, G. Sharafutdino-va, X. Zhou, W. J Belcher, P. C. Dastoor, “Modular LED arrays for large area solar simulation”, Progress in Photovoltaics: Re-search and Applications, pp. 1-11, 2018.
[31] ASTM Standard G173-03, Tables for reference solar spectral irradiances: Direct normal and hemispherical on 37° tilted surface, 2012.
[32] S.J. Polly, Z.S. Bittner, M.F. Bennett, R.P. Raffaelle, S.M. Hub-bard, “Development of a multi-source solar simulator for spatial uniformity and close spectral matching to AM0 and AM1.5.”, 37th IEEE Photovoltaic Specialists Conference (PVSC), pp. 1739-43, 2011.
[33] V. Shrotriya, G. Li, Y. Yao, T. Moriarty, K. Emery, Y. Yang, “Accurate measurement and characterization of organic solar cells,” Advanced Functional Materials, vol. 16, no. 15, pp. 2016–23, 2016.
[34] A.H. Fanney, M.W. Davis, B.P. Dougherty, D.L. King, W.E. Boyson, J.A. Kratochvil, “Comparison of photovoltaic module performance measurements,” Journal of Solar Energy Engineering, vol. 128, no. 2, pp. 152–9, 2006. [35] G. Leary, G. Switzer, G. Kuntz, T. Kaiser,
“Comparison of xenon lamp-based and led-based solar simulators”, IEEE 44th Photovoltaic Specialist Conference (PVSC), pp. 1-6, 2017.
[36] G. Grandi, A. Ienina, M. Bardhi, “Effective low-cost hybrid LED-halogen solar simulator”, IEEE Transactions on Industry Applications, vol. 50, no. 5, pp. 3055-3064, 2014.
[37] K.A. Kim, N. Dostart N, J. Huynh, P.T. Krein, “Low-cost solar simulator design for multi-junction solar cells in space applications,”, IEEE Power and Energy Conference at Illinois, PECI, 2014,
[38] G. Grandi, A. Ienina, “Analysis and realization of a low-cost hybrid LED-halogen solar simulator”, IEEE International Conference on Renewable Energy Research and Applications (ICRERA), pp. 794-799, 2013.
[39] A. Georgescu, G. Damache M.A. Gîrtu, “Class A small area solar simulator for dye-sensitized solar cell testing,” Journal of Optoelectronıcs and Advanced Materials, vol. 10, no.11, pp. 3003–7, 2008.
[40] A. Mohan, J. Pavithran, K.L. Osten, A. Jinumon, C.P. Mrinalini. “Simulation of spectral match and spatial non-uniformity for LED solar simulator”, IEEE global humanitarian technology conference South Asia satellite (GHTC-SAS), pp. 111–117, 2014.
[41] A.M. Bazzi, Z. Klein, M. Sweeney, K.P. Kroeger, P.S. Shenoy, P.T. Krein, “Solid-state solar simulator”, IEEE Transactions on Industry Applications, vol. 48, no. 4, pp. 1195-120, 2012. [42] P. Krusi, R. Schmid, “The csi 1000W lamp as
source for solar radiation simulation”, Solar Energy, vol. 30, no. 5, pp. 455–62. 1983.
[43] M. Stuckelberger, B. Perruche, M. Bonnet-Eymard, Y. Riesen, M. Despeisse, F. J. Haug, C. Ballif, “Class AAA LED-based so-lar simulator for steady-state measurements and light soaking” IEEE Journal of Photovoltaics, vol. 4, no. 5, pp.1282-1287, 2014. [44] R. Shankar, W.J. Shim, J.G. An, U.H. Yim, “A
practical review on photooxidation of crude oil: Laboratory lamp setup and factors affecting it,” Water Research, vol. 68, pp. 304–15, 2015.
[45] N.V. Joshi, Photoconductivity: Art: Science & Technology, Routhledge, CRC Press, pp. 60-74, 1990.
[46] S.H. Jang, M.W. Shin, “Fabrication and thermal optimization of LED solar cell simulator”, Current Applied Physics, vol. 10, no.3, pp. 537-539, 2010. [47] A. Namin A, C. Jivacate, D. Chenvidhya, K.
Kirtikara, J. Thongpron, “Determination of solar cell electrical parameters and resistances using color and white LED-based solar simula-tors with high amplitude pulse input voltages”, Renewable Energy, vol. 54, pp. 131-137, 2013.