NATURE OF OXYGEN SPECIES ON Au(111)
AND Ag(111) MODEL CATALYSTS AND
THEIR ROLE IN O-H, C-H, C-C, N-H BOND
ACTIVATION
a dissertation submitted to
the graduate school of engineering and science
of bilkent university
in partial fulfillment of the requirements for
the degree of
doctor of philosophy
in
chemistry
By
Mustafa Karatok
October 2017
NATURE OF OXYGEN SPECIES ON Au(111) AND Ag(111) MODEL CATALYSTS AND THEIR ROLE IN O-H, C-H, C-C, N-H BOND ACTIVATION
By Mustafa Karatok October 2017
We certify that we have read this dissertation and that in our opinion it is fully adequate, in scope and in quality, as a dissertation for the degree of Doctor of Philosophy.
Emrah ¨Ozensoy(Advisor)
S¸efik S¨uzer
O˘guz G¨ulseren
Ahmet Oral
Hande Toffoli
Approved for the Graduate School of Engineering and Science:
Ezhan Karasan
ABSTRACT
NATURE OF OXYGEN SPECIES ON Au(111) AND
Ag(111) MODEL CATALYSTS AND THEIR ROLE IN
O-H, C-H, C-C, N-H BOND ACTIVATION
Mustafa Karatok Ph.D. in Chemistry Advisor: Emrah ¨Ozensoy
October 2017
Metal-catalyzed heterogeneous oxidation reactions have high importance for the large-scale production of the commodity chemicals vastly used in the chemical industry. Controlling the selectivity in such processes to increase the product yield and minimize the production of undesired byproducts requires a molecular level understanding of the bond activation mechanisms. Thus, understanding the nature of oxygen species in various bond cleavage processes is critical. In the current work, nature of oxygen species was studied on the planar Au(111) and Ag(111) single crystal model catalyst surfaces via x-ray photoelectron spec-troscopy (XPS), temperature programmed desorption/ temperature programmed reaction spectroscopy (TPD/TPRS), low energy electron diffraction (LEED) and infrared reflection absorption spectroscopy (IRAS) techniques under ultra-high vacuum (UHV) conditions. Ozone (O3) was utilized as the oxygen delivery agent
providing atomic oxygen to the reacting surface. Various oxygen species were determined on both Au(111) and Ag(111) model catalysts and their role in O-H, C-H, C-C and N-H bond activation was investigated by using probe molecules such as methanol, acetaldehyde and ammonia. Three different oxygen species such as atomic oxygen (Oa), subsurface oxygen (Osub) and surface oxide (Oox)
were determined on Au(111) single crystal. Oxygen accumulation on Au(111) surface at 140 K for θO<1.0 MLE of oxygen coverage resulted in the surface
atomic oxygen (Oa) formation while 2D surface oxide (Oox) started to grow for
θO>1.0 MLE of oxygen coverage at the same temperature. It was also shown
that oxygen atoms dissolved (Osub) into the bulk of the Au(111) single crystal
when oxygen was accumulated at 473 K. Atomic oxygen species (Oa) on Au(111)
was found to be very active for the cleavage of O-H and C-H bonds in methanol; C-C bond in acetaldehyde; N-H bond in ammonia molecules. Surface oxide (Oox)
iv
selectivity towards CO2. Dissolved oxygen atoms (Osub) revealed almost no
ac-tivity in methanol oxidation reactions on Au(111). In a similar manner, three different oxygen species were determined on the Ag(111) surface such as surface atomic oxygen (Oa), surface oxide (Oox) and bulk-like oxide (Obulk) species.
Dis-ordered atomic oxygen (Oa) and surface oxide (Oox) overlayers prepared at 140
K on Ag(111) for θO ≤ 0.2 MLE were found to be very active for O-H and
C-H bond cleavage producing formaldehyde as the dominant product. Increasing oxygen quantity for both oxygen species (0.7 MLE ≤ θO ≤ 1.3 MLE) resulted
mostly CO2 formation. Oa (θO < 1.10 MLE) was also found to be highly active
in N-H bond cleavage for ammonia and selective to N2 as the dominant product.
On the other hand, ordered p(5×1) and c(4×8) surface oxide (Oox) overlayers
on Ag(111) prepared 473 K were found to be almost entirely inactive for N-H cleavage. Extreme oxygen exposures on Ag(111) (θO > 1.93 MLE ) at 140 K
led to bulk-like silver oxide (Obulk) species with poor N2 selectivity in ammonia
oxidation and increasing extent of formation of toxic pollutants such as NO and N2O.
Keywords: Oxidation Catalyst, Bond Activation, Model Catalyst, Au(111), Ag(111).
¨
OZET
OKS˙IJEN T ¨
URLER˙IN˙IN Au(111) VE Ag(111) MODEL
KATAL˙IZ ¨
ORLER˙I ¨
UZER˙INDEK˙I DO ˘
GASI VE O-H,
C-H, C-C, N-H BA ˘
G AKT˙IVASYONUNDAK˙I ROLLER˙I
Mustafa Karatok Kimya, Doktora
Tez Danı¸smanı: Emrah ¨Ozensoy Ekim 2017
Metal katalizli heterojen oksidasyon reaksiyonları, kimya end¨ustrisinde b¨uy¨uk ¨
ol¸cekli olarak ¨uretilen ¨ur¨unlerin ¨uretiminde b¨uy¨uk ¨onem ta¸sımaktadır. Ur¨¨ un verimini arttırmak ve istenmeyen yan ¨ur¨unlerin ¨uretimini en aza indirmek i¸cin bu t¨ur proseslerde se¸cicili˘gin kontrol¨u, molek¨ul seviyesinde ba˘g aktive etme mekanizmalarının anla¸sılmasını gerektirmektedir. Bu nedenle, ¸ce¸sitli ba˘g kırılma s¨ure¸clerinde oksijen t¨urlerinin do˘gasını anlamak kritik ¨onem ta¸sımaktadır. Mev-cut ¸calı¸smada, x-ı¸sını fotoelektron spektroskopisi (XPS), sıcaklık programlı des-orpsiyon / sıcaklık programlı reaksiyon spektroskopisi (TPD / TPRS), d¨u¸s¨uk en-erjili elektron kırınımı (LEED) ve kızıl¨otesi yansıma absorpsiyon spektroskopisi (IRAS) teknikleri kullanılarak d¨uzlemsel Au(111) ve Ag(111) tek kristal model kataliz¨or y¨uzeyleri ¨uzerindeki oksijen t¨urlerinin do˘gası ultra-y¨uksek vakum (UHV) ko¸sulları altında incelenmi¸stir. Atomik oksijeni sa˘glaması bakımından oksijen kayna˘gı olarak ozon (O3) kullanılmı¸stır. Au(111) ve Ag(111) model
kataliz¨orler ¨uzerindeki ¸ce¸sitli oksijen t¨urleri belirlenip, bu t¨urlerin metanol, ase-taldehit ve amonyak gibi molek¨uller kullanılarak O-H, C-H, C-C ve N-H ba˘g ak-tivasyonlarındaki rol¨u ara¸stırılmı¸stır. Au(111) tek kristali ¨uzerinde y¨uzey atomik oksijen (Oa), y¨uzey altı oksijen (Osub) ve y¨uzey oksit (Oox) olmak ¨uzere ¨u¸c farklı
oksijen t¨ur¨u belirlenmi¸stir. Au(111) ¨uzerinde 140 K sıcaklıkta, 1 tek katman e¸sde˘geri (MLE) ve daha az miktarda oksijen birikimi, atomik y¨uzey oksijeni (Oa) olu¸sumuyla sonu¸clanırken, aynÄś sıcaklıkta 1 MLE’den daha fazla oksijen
birikimiyle birlikte 2 boyutlu y¨uzey oksit olu¸smaya ba¸sladı˘gı saptanmı¸stır. Ayrıca oksijenin 473 K sıcaklıktaki y¨uzeye g¨onderilmesiyle oksijen atomlarının Au(111) tek kristalinin i¸cerisinde ¸c¨oz¨und¨u˘g¨u (Osub) g¨osterilmi¸stir. Y¨uzeyde bulunan
oksi-jen atomlarının (Oa) metanoldeki O-H ve C-H; asetaldehitteki C-C; amonyaktaki
N-H ba˘glarının kırılmasında ¸cok aktif oldu˘gu g¨or¨ulm¨u¸st¨ur. Y¨uzeydeki oksit kat-manının (Oox) da metanol ile tepkimeye girdi˘gi, fakat bu tepkime sonucunda CO2
vi
olu¸smasına kar¸sı ¸cok y¨uksek se¸cicilikte oldu˘gu g¨or¨ulm¨u¸st¨ur. Au(111) tek kristali i¸cerisinde ¸c¨oz¨unm¨u¸s olan oksijen atomları (Osub) metanol oksidasyon
reaksiyon-larında neredeyse hi¸c aktivite g¨ostermemi¸stir. Benzer ¸sekilde Ag(111) tek kristali ¨
uzerinde y¨uzey atomik oksijen (Oa), y¨uzey oksit (Oox) ve balk oksit (Obulk)
ol-mak ¨uzere ¨u¸c farklı oksijen t¨ur¨u belirlenmi¸stir. 140 K sıcaklıkta 0.2 MLE ve daha az oksijen ile olu¸sturulan d¨uzensiz dizilmi¸s atomik oksijen (Oa) ve y¨uzey
oksit (Oox) katmanlarının metanoldeki O-H ve C-H ba˘glarının kırılmasında aktif
oldu˘gu ve baskın ¨ur¨un olarak formaldehit olu¸sturdu˘gu g¨or¨ulm¨u¸st¨ur. Artan ok-sijen miktarıyla birlikte (0.7 MLE ≤ θO ≤ 1.3 MLE), bahsedilen her iki t¨ur
de ¸co˘gunlukla CO2 olu¸sumuna sebep olmaktadır. Ayrıca Oa t¨ur¨un¨un (θO <
1.10 MLE) amonyak molek¨ul¨undeki N-H ba˘g kırılmasında aktif oldu˘gu ve baskın ¨
ur¨un olarak N2 olu¸sturdu˘gu saptanmı¸stır. Di˘ger taraftan, Ag(111) tek kristali
¨
uzerinde 473 K sıcaklıkta olu¸sturulan p(5×1) ve c(4×8) y¨uzey dizilimindeki y¨uzey oksit (Oox) katmanının N-H ba˘g kırılmasında neredeyse tamamen pasif oldu˘gu
g¨or¨ulm¨u¸st¨ur. Ag(111) ¨uzerinde 140 K sıcaklıkta y¨uksek oksijene (θO> 1.93 MLE)
maruz bırakılarak olu¸sturulan balk g¨um¨u¸s oksit (Obulk) t¨ur¨un¨un ise amonyak
ok-sidasyonu tepkimesinde N2 olu¸sumuna kar¸sı d¨u¸s¨uk se¸cicilik g¨osterdi˘gi ve NO, N2O
gibi toksik kirleticilerin olu¸sumunu artırdı˘gı saptanmı¸stır.
Anahtar s¨ozc¨ukler : Oksidasyon Kataliz¨or¨u, Ba˘g Aktivasyonu, Model Kataliz¨or, Au(111), Ag(111).
Acknowledgements
First of all, I would like to express my sincere gratitude to my advisor, Dr. Emrah ¨Ozensoy for his patience, motivation and immense knowledge. I deeply appreciated that he believed in my potential and gave me an opportunity to be part of his team. His guidance helped me all throughout my research and he has become my role model with his scientific enthusiasm and vision.
Besides my advisor, I would like to thank the rest of my thesis committee, Dr. S¸efik S¨uzer, Dr. Co¸skun Kocaba¸s, Dr. Hande Toffoli, Dr. O˘guz G¨ulseren and Dr. Ahmet Oral for their insightful comments and invaluable time.
My sincere thanks goes to my former lab mate, Dr. Evgeny Vovk, for his patience and support in the first few tough years of my graduate work. I also thank to my lab mates Asad Shah, Ali Vˆalˆa Ko¸c and Bartu Karakurt for their collaboration, companionship and for all the fun we have had in the lab.
I owe my deepest gratitude to a spectacular craftsman, Ethem Anber, not only for his help in technical problems and for giving useful design ideas, but also for sharing his life experiences and for his advice.
I would like to thank to Sean McWhorter for his friendship and for encouraging me in my desperate times. I would also like to thank to other group members that I worked with in different projects: Dr. Zafer Say, Dr. Deniz Erdo˘gan, Kerem Emre Ercan, Merve Kurt, Aybeg¨um Samast, Elif Per¸sembe, Merve Balcı, and one of my lunch partner in the last months, Mohammed Irfan, for their cooperation and friendship.
I also would like to acknowledge Dr. Mehmet Erbudak from ETH Zurich for his contributions regarding the construction of the UHV experimental setup.
I would like to thank to the Scientific and Technological Research Council of Turkey (TUBITAK) (Project code: 112T589) for the financial support.
I would like to offer my special thanks to my mom and dad, for their love and support during my education.
Finally my deepest appreciation goes to my wife, Dr. Zahide Pamir Kara-tok, who was very patient and thoughtful although she was conducting her own stressful research. She supported me all the time and deserves all the credit for encouraging me to apply to Bilkent in the first place.
Contents
1 Introduction 1
1.1 Motivation of the Study . . . 1
1.2 Nature of Oxygen on Au(111) Single Crystal . . . 3
1.3 Nature of Oxygen on Ag(111) Single Crystal . . . 5
2 Experimental 8 2.1 Temperature Programmed Desorption/ Reaction Spectroscopy . . 9
2.2 X-ray Photoemission Spectroscopy . . . 13
2.3 Infrared Reflection Absorption Spectroscopy . . . 15
2.4 Low Energy Electron Diffraction . . . 19
2.5 Atomic Oxygen Accumulation Methods . . . 21
2.5.1 NO2 and water co-adsorption . . . 22
2.5.2 Ozone Decomposition . . . 24
3 Bond Activation on Gold 26 3.1 Characterization of the Au(111) Single Crystal Surface . . . 26
3.2 Oxygen Behavior on Au(111) Single Crystal . . . 29
3.2.1 Examination of the Activity of Oxygen Overlayers on Au(111) by Titration with CO Molecules . . . 37
3.3 C-H and O-H Activation on Au(111) Single Crystal . . . 38
3.3.1 Methanol on Clean Au(111) Single Crystal . . . 39
3.3.2 Methanol on Oxygen pre-covered Au(111) Single Crystal . 41 3.4 C-C Activation on Au(111) Single Crystal . . . 45
3.4.1 Acetaldehyde and Methyl Formate on Clean Au(111) Single Crystal . . . 45
CONTENTS ix
3.4.2 Acetaldehyde on Oxygen Pre-covered Au(111) . . . 49
3.5 N-H Activation on Au(111) . . . 52
3.5.1 Ammonia adsorption on clean Au(111) . . . 52
3.5.2 Ammonia on Oxygen Pre-covered Au(111) . . . 53
4 Bond Activation on Silver 56 4.1 Characterization of the Ag(111) Single Crystal Surface . . . 56
4.2 Oxygen Behavior on Ag(111) Single Crystal . . . 58
4.3 C-H and O-H Activation on Ag(111) . . . 65
4.3.1 Methanol on Clean Ag(111) . . . 66
4.3.2 Methanol on oxygen pre-covered Ag(111) . . . 68
4.3.3 The Effect of Methanol Dosage Temperature to the Methanol Oxidation Reaction Pathways . . . 75
4.4 N-H Activation on Ag(111) . . . 77
4.4.1 Ammonia on Clean Ag(111) . . . 77
4.4.2 Ammonia on Oxygen Pre-covered Ag(111) . . . 81
5 Conclusions 87 5.1 Bond Activation by Au(111) . . . 87
5.2 Bond Activation by Ag(111) . . . 89 A Diagram of the IRAS Setup 108 B QMS Fragmentation Patterns of the Chemicals 109 C Infrared Frequencies and Mode Assignments for Methanol and
Methoxy Species on Ag(111) 110 D Alternative depiction of TPRS data for ammonia SCO reaction111 E TPRS profiles for NH3 and H2O during ammonia SCO reaction112
List of Figures
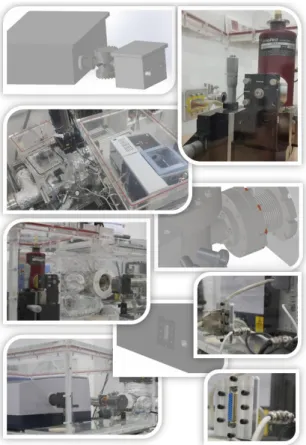
1.1 (100), (110) and (111) fcc crystal surfaces. Adapted from Ref. [14] (All atoms are identical, color coding for different layers are for visualization only) . . . 3 2.1 Pictures of the multicomponent UHV system . . . 9 2.2 Schematic setup for TPD experiments under UHV conditions.
Adapted from Ref. [65] . . . 10 2.3 Representative TPD spectra for (a) zeroth, (b) first and (c) second
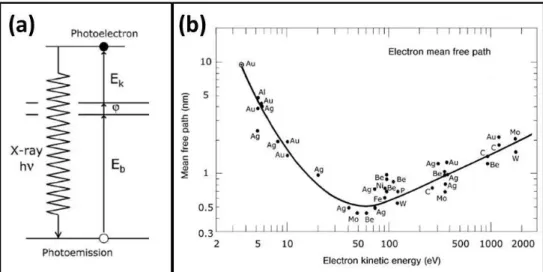
order desorption kinetics. Adapted from Ref. [68] . . . 12 2.4 (a) Diagram of the photoemission process. (b) Universal curve that
is plot of IMFP values of the metals as a function of the kinetic energy of electrons. Figures were adapted from Ref. [65] . . . 14 2.5 (a) A dual anode x-ray source configuration. Adapted from
Ref. [72] (b) A double-pass cylindrical Mirror Energy Analyzer. Adapted from Ref. [73] . . . 15 2.6 (a) Phase shifts of IR light components as a function of the angle
of incidence on a metal surface. Adapted from Ref. [74]. (b) A schematic representation of dipole moments of a diatomic molecule located perpendicular and parallel to the metal surface and their image dipoles on the surface. (c) Electric field and intensity func-tions of p-polarized light in copper surface as a function of the angle of incidence. Adapted from Ref. [74] . . . 17 2.7 Scaled-drawings and final view of the IRAS chamber that was
LIST OF FIGURES xi
2.8 Scaled-drawings and final view of the IRAS setup that was designed and manufactured in the current work . . . 19 2.9 (a) Constructive interference phenomena and the relationship
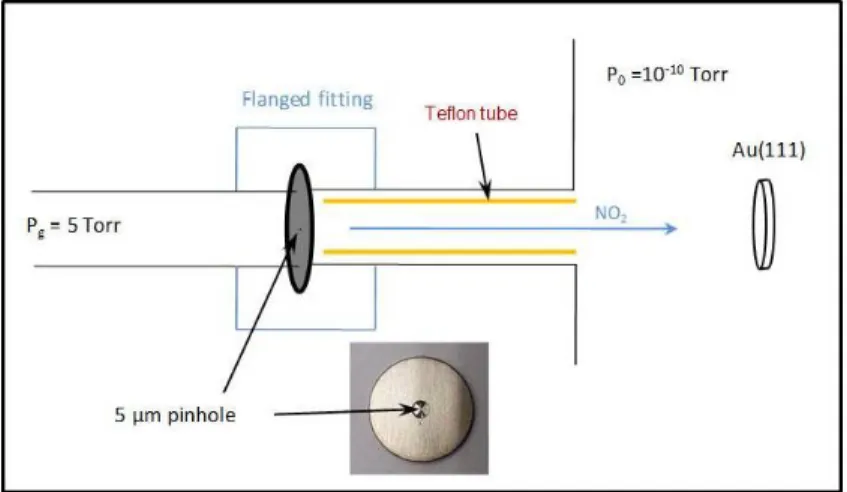
be-tween the real space vs. k-space basis vectors in a LEED exper-iment. (b) A schematic of a LEED configuration. Adapted from Ref. [75] . . . 21 2.10 Custom-design NO2 dosing line equipped with a stainless steel disc
pinhole (Diameter = 5 µm). . . . 23 2.11 Schematic of the custom-made Pb(NO3)2(s)-based NO2 delivery
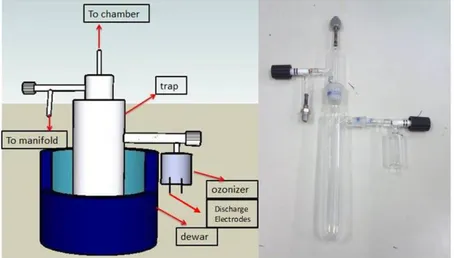
system. . . 23 2.12 Details of the custom-made ozonizer and ozone trap
accommodat-ing the silica gel. . . 24 2.13 (a) Commercial ozone generator, ozone trap (b) before and (c)
after ozone storage. . . 25 3.1 Reconstructed Au(111) unit cell [89]. b) STM image of a
recon-structed Au(111) surface (size 120×120 nm2) in UHV. Inset shows
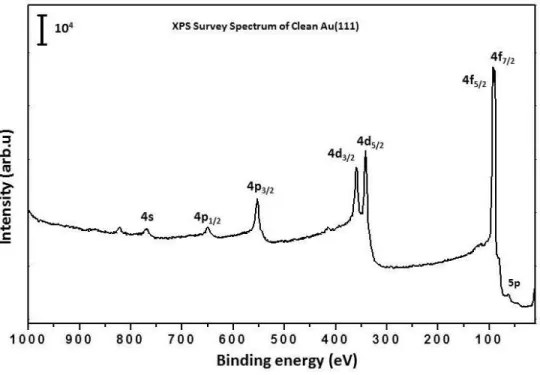
an atomic resolution image (8×6 nm2) where the unit cell is marked with a rectangle. Adapted from Ref. [91] . . . 27 3.2 A representative survey XP spectrum of the clean Au(111) single
crystal. . . 28 3.3 (a) Au 4f XP spectrum (b) LEED pattern of the clean Au(111)
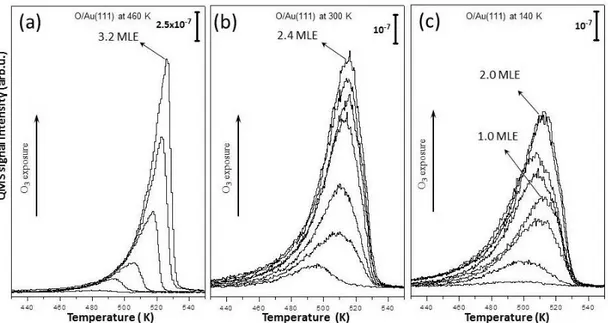
single crystal. . . 29 3.4 O2 TPD profiles with increasing coverage of atomic oxygen on
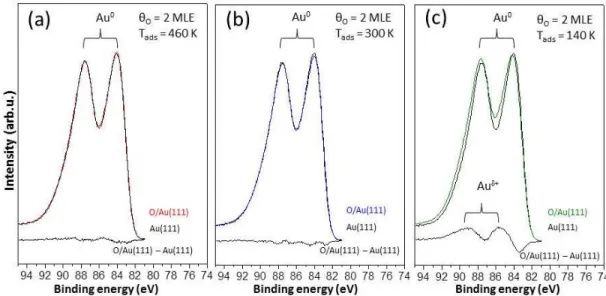
Au(111) prepared via ozone decomposition at 460 K (a), 300 K (b) and 140 K (c). . . 31 3.5 Au 4f region XP spectra of high coverage oxygen layers (θO = 2
MLE) on Au(111) prepared at 460 K (a), 300 K (b) and 140 K (c) in comparison to the clean Au(111) single crystal. . . 34 3.6 Au4f region XP spectra of Au(111) including 0.8 MLE oxygen
over-layer prepared at 140 K in comparison to Au 4f spectrum of clean Au(111) surface. . . 35
LIST OF FIGURES xii
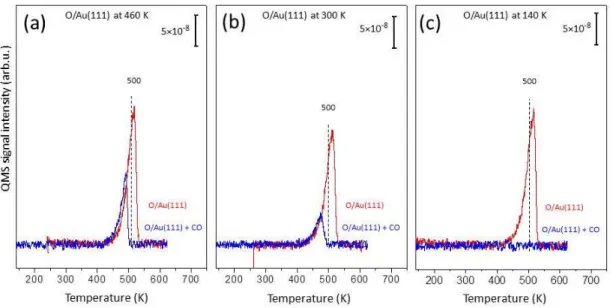
3.7 O 1s XP spectra of the oxygen overlayers on Au(111) prepared and monitored at 140 K. The right panel shows the O 1s spectrum recorded after heating of the 0.9 MLE oxygen layer to 300 K (the spectrum was acquired at 300 K). . . 36 3.8 TPD profiles of O/Au(111) overlayers before and after reaction
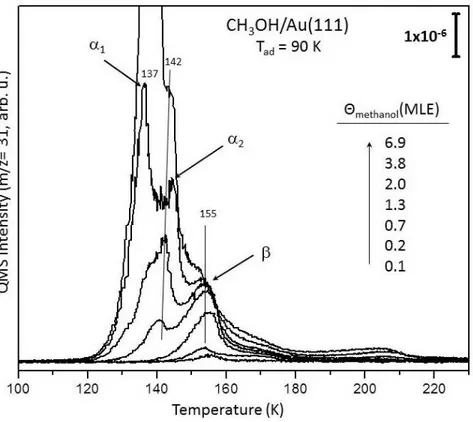
with CO. TPD profiles showing m/z=32 desorption channel for oxygen recorded after ∼0.7 MLE of oxygen accumulation at (a) 460 K, (b) 300 K and (c) 140 K (red spectra) and spectra monitored after subsequent 3.0 L of CO exposure (10−8 Torr × 5 min.) on the analogous O/Au(111) overlayers at 140 K (blue spectra). . . . 38 3.9 TPD profiles (m/z=31) obtained after methanol adsorption on
clean Au(111) surface at 90 K as a function of increasing methanol coverage. Reprinted with permission from [110] Copyright (2017) Springer (order number: 4206641091824). . . 40 3.10 IRAS spectra of monolayer and multilayer of methanol on clean
Au(111) . . . 41 3.11 TPRS profiles for the reaction of methanol with oxygen
accumu-lated at (a) 460 K, (b) 140 K on Au(111). . . 42 3.12 TPRS profile showing desorption channels of methyl formate
(ox-idative coupling product) and formaldehyde (partial oxidation product) obtained after methanol exposure to oxygen pre-covered Au(111). . . 43 3.13 TPRS profiles for the reaction of methanol with (a) 0.3 MLE (b)
1.2 MLE of oxygen accumulated at 300 K on Au(111) . . . 44 3.14 Coverage-dependent TPD profiles for the m/z = 29 desorption
channel obtained via acetaldehyde (CH3CHO(g)) adsorption on
the clean Au(111) model catalyst surface at 90 K. Inset empha-sizes the non-monotonic intensity of the chemisorbed acetaldehyde desorption feature at 139 K as a function of acetaldehyde coverage. 47 3.15 Coverage-dependent TPD profiles for the m/z=43 desorption
chan-nel obtained via methyl acetate (CH3COOCH3(g)) adsorption on
LIST OF FIGURES xiii
3.16 TPRS profiles for various desorption channels obtained after 2.9 MLE of acetaldehyde accumulation at 90 K on 0.1 MLE of oxygen pre-covered Au(111) model catalyst surface at 140 K . . . 50 3.17 TPD profiles (m/z = 17) obtained after ammonia adsorption on
clean Au(111) surface at 90 K as a function of increasing ammonia coverage . . . 52 3.18 TPRS profiles for the reaction of ammonia (0.6 MLE) at 83 K (a)
and 190 K (b) on 0.3 MLE oxygen pre-covered gold surface at 190 K. . . 54 3.19 TPRS profiles for the reaction of ammonia (0.6 MLE) at 190 K on
0.6 MLE oxygen pre-covered gold surface at 190 K. . . 55 4.1 A representative survey XP spectrum of the clean Ag(111) single
crystal. . . 57 4.2 (a) Ag 3d XP spectrum (b) LEED pattern of the clean Ag(111)
single crystal. . . 58 4.3 (a) TPD profiles for oxygen desorption (m/z = 32) obtained by
increasing ozone exposures on clean Ag(111) at 140 K. (b) Relative oxygen surface coverages (obtained via integrated TPD desorption signals in part (a)) for surface and subsurface oxygen species on Ag(111) as a function of ozone exposure. . . 60 4.4 LEED images of O/Ag(111) overlayers obtained by introducing
different ozone exposures at 140 K on clean Ag(111) surface fol-lowed by pumping and annealing to 473 K in UHV. (a) LEED image of the p(5x1)-O/Ag(111) overlayer (θO = 0.83 MLE) and
(b) its simulated (theoretical) LEED pattern. (c) LEED image of the c(4x8)-O/Ag(111) overlayer (θO = 1.10 MLE) and (d) its
simulated (theoretical) LEED pattern. . . 62 4.5 O 1s XPS spectra of O/Ag(111) as a function of increasing oxygen
coverage obtained by increasing exposures of ozone at 140 K. Inset on the right shows the integrated O 1s/Ag 3d signal ratio as a function of oxygen coverage. Inset on the left shows the O 1s XPS spectra for O/Ag(111) with θO = 2.66 MLE dosed at 140 K (red)
LIST OF FIGURES xiv
4.6 Normalized Ag 3d XPS spectra for clean Ag(111) (black), θO =
1.93 MLE O/Ag(111) (blue), θO = 3.70 MLE O/Ag(111) (red)
and subtracted spectrum of clean Ag(111) from θO = 3.70 MLE
O/Ag(111) (green). . . 65 4.7 TPD profiles (m/z = 31) obtained after methanol adsorption on
clean Ag(111) surface at 100 K as a function of increasing methanol coverage. . . 67 4.8 IRAS spectra of methanol adsorption on clean Ag(111) surface at
100 K as a function of methanol surface coverage. . . 68 4.9 TPRS profiles for the reaction of methanol with oxygen on
Ag(111). In all of the experiments, an identical exposure of methanol (Pmethanol = 1.0 x 10⁻⁹ Torr x 60 sec.) was dosed at
200 K on oxygen-covered (θO = 0.7 MLE) Ag(111) surface, where
oxygen was delivered by ozone exposure either at (a) 140 K or at (b) 473 K . . . 69 4.10 TPRS profiles of methanol oxidation reaction products (i.e.
formaldehyde, methanol, CO2) for the reaction between methanol
(Tads=200 K) and oxygen pre-covered Ag(111) surfaces as a func-tion of oxygen coverage. . . 71 4.11 Integrated TPRS desorption signals for the methanol oxidation
products (i.e. formaldehyde, methanol, CO2) on O/Ag(111)
sur-face including either Oa or Oox species as a function of oxygen
coverage extracted from the TPRS data given in Figure 4.10. . . . 72 4.12 IRAS spectra of methanol (1.0 MLE) on Oa/Ag(111) for various
oxygen coverages at 140 K . . . 73 4.13 IRAS spectra of methanol (1.0 MLE) on O/Ag(111) (θO = 0.7
MLE) for methanol accumulation temperature (a) at 100 K, (b) at 100 K followed by annealing to 300 K, (c) at 300 K. . . 76 4.14 TPRS spectra of methanol (1.0 MLE) on O/Ag(111) (θO = 0.7
MLE) for methanol accumulation temperature (a) at 100 K and (b) at 300 K. . . 77
LIST OF FIGURES xv
4.15 TPD profiles (m/z=17) obtained after ammonia adsorption on clean Ag(111) surface at 90 K as a function of increasing ammonia coverage. . . 78 4.16 IRAS spectra of ammonia adsorption on clean Ag(111) surface at
90 K as a function of ammonia surface coverage. . . 80 4.17 TPRS profiles for the reaction of ammonia with oxygen on Ag(111).
In all of the experiments, an identical exposure of NH3 (PN H3 =
2.0 x 10⁻⁹ Torr x 60 s) was dosed at 250 K on oxygen-covered (θO = 0.21 MLE) Ag(111) surface, where oxygen was delivered by
ozone exposure either at 140 K (multi-colored spectra) or at 473 K (grey-colored spectra). . . 82 4.18 TPRS profiles of various ammonia SCO reaction products (i.e.
N2, NO, N2O) for the reaction between ammonia and oxygen
pre-covered Ag(111) surfaces as a function of oxygen coverage. For all of the data, oxygen was delivered on Ag(111) by ozone exposure at 140 K, while NH3 was delivered using an identical ammonia
exposure at 250 K (PN H3 = 2.0 x 10¹⁰−9 Torr x 60 s) . . . 84
4.19 Integrated TPD desorption signals for the main ammonia SCO products (i.e. N2, NO, N2O) on O/Ag(111) surface as a function
of oxygen coverage extracted from the TPRS data given in Figure 4.18. . . 85 5.1 Reactivity and selectivity trends of methanol oxidation reaction on
O/Au(111) as a function of oxygen coverage and temperature. . . 88 5.2 Reactivity and selectivity trends of ammonia SCO on O/Ag(111)
as a function of oxygen coverage and temperature. . . 90 D.1 Alternative depiction of the TPRS data corresponding to the
var-ious ammonia SCO reaction products (i.e. N2, NO, N2O) for the
reaction between ammonia and oxygen pre-covered Ag(111) sur-faces as a function of oxygen coverage. For all of the data, oxygen was delivered on Ag(111) by ozone exposure at 140 K, while NH3
was delivered after ozone using an identical ammonia exposure at 250 K (P(NH3) = 2.0 × 10⁻⁹ Torr × 60 sec.) . . . 111
LIST OF FIGURES xvi
E.1 TPRS profiles for NH3(m/z = 17) and H2O (m/z = 18) desorption
channels obtained during the reaction between ammonia and oxy-gen pre-covered Ag(111) surfaces as a function of oxyoxy-gen coverage as shown in Figure 4.18 of the main text. . . 112
List of Tables
4.1 Vibrational frequency assignments for the NH3/Ag(111) IRAS
Chapter 1
Introduction
1.1
Motivation of the Study
Catalytic processes contribute to the production of most of the materials and chemicals that we use in our daily life e.g. food, fabric, construction material, oil, pharmaceutical industries. Furthermore, most of the processes, especially in chemical industry, rely on heterogeneous catalytic reactions [1, 2]. Despite the limited surface area of solid catalysts compared to homogeneous catalysis, ease of separation and wide range of operation conditions make heterogeneous catalysis an industrially advantageous approach. Metal-catalyzed heterogeneous oxidation reactions are particularly crucial for the large scale production of commonly used commodity chemicals [3]. For example, formaldehyde is produced in industrial scale from methanol partial oxidation on solid silver catalysts [4]. Synthesis of carbonyl derivatives from alcohols constitutes an important portion of organic chemical product synthesis [5]. Several carbonyl derivatives such as aldehydes, ketones, carboxylic acids and esters can be synthesized from the corresponding alcohols by conventional organic synthesis methods [6]. However, these methods have strong environmental drawbacks due to the use of heavy-metal salts as oxidizing agents, generation of undesired byproducts and the utilization of toxic solvents [5, 7, 8]. Thus, heterogeneous catalysis enables large scale chemical
production via green chemistry methods.
Selectivity is the main concern in the catalytic oxidation reactions. For exam-ple, in the formaldehyde production process from methanol on silver catalysts, formic acid and carbon dioxide are also produced as byproducts [4]. It was shown that the same reaction leads to methyl formate formation on gold catalyst as a result of a coupling reaction pathway [9]. Various metals were shown to be active in ammonia oxidation reaction for the purpose of ammonia abatement. Depend-ing on the reaction conditions, the formation of the toxic byproducts such as NO, NO2, N2O were reported in addition to the main product, N2 [10]. Controlling
the selectivity in such reactions in order to increase the product yield and to minimize the production of undesired byproducts requires a molecular level un-derstanding of the bond activation mechanisms. Thus, unun-derstanding the nature of oxygen in the O-H, C-H, C-C and N-H bond cleavage processes for oxidation reactions is critical in terms of the selectivity of the catalyst.
Catalytic activity of metal nanoparticles varies with the nanoparticle size and shape as well as with the nature of the support material. However, understanding the structure-catalytic functionality relationships are quite challenging. In order to obtain fundamental insights regarding the detailed catalytic mechanisms of the catalysts, atomically well-defined planar model catalysts can be used a ver-satile platform where surface structure and reaction parameters can be readily controlled. However, such well-defined model catalysts can not survive under at-mospheric conditions due to the adsorption of atoms and molecules in the air. In order to maintain the catalyst surface clean for a long time and to perform atomic scale experiments, ultra high vacuum (UHV) is needed. Thus, well-defined model catalysts such as Au(111) and Ag(111) single crystals under UHV conditions are ideal environments to examine the nature of oxygen for oxidation reactions.
There are three common crystal structures for stacking bulk metal atoms, namely face-centered cubic (fcc), body centered cubic (bcc) and hexagonal close packed (hcp). While the alkali metals and a few transitions metals crystallize in bcc, most of the metals prefer stacking in either fcc or hcp system [11]. Surface structure of the metals varies depending on their bulk crystal arrangement. Most
of the precious metals including gold and silver exhibit fcc structure[12]. Cutting an fcc crystal along the unit cell in any direction creates surfaces with different atomic orientations which can be labeled by using Miller indices. Most commonly observed crystal faces are (111), (110) and (100) planes which have relatively high atomic density and low surface free energy [13]. Schematic drawing of these faces are given in Figure 1.1 [14].
Figure 1.1: (100), (110) and (111) fcc crystal surfaces. Adapted from Ref. [14] (All atoms are identical, color coding for different layers are for visualization only) Based on Density Functional Theory (DFT) calculations, the surface free en-ergies of (100), (110) and (111) facets of gold are found to be 0.08, 0.10 and 0.05 eV/˚A2, respectively [14]. Among these facets, (111) surface has the lowest
sur-face free energy rendering it the most stable termination which is also the most frequently observed facet in experimental studies on gold nanoparticles [15]. In a similar manner, silver nanoparticles mostly consist of (111) facet [16]. Thus, per-forming reactions on Au(111) and Ag(111) single crystal surfaces is an effective way of understanding the catalytic behavior of gold and silver nanoparticles.
1.2
Nature of Oxygen on Au(111) Single
Crys-tal
Gold had been considered as an inert metal until the pioneering work of Bond et al. on the hydrogenation of olefins over supported gold catalysts [17]. After-wards, Hutchings [18] and Haruta [19] reported that gold nanoparticles have high activity for acetylene hydrochlorination and CO oxidation, respectively. After the
discovery of catalytically active gold, numerous reports were published in various heterogeneous catalytic applications such as water-gas shift reaction, CO oxida-tion, hydrocarbon oxidaoxida-tion, NO reducoxida-tion, alkene epoxidaoxida-tion, selective alcohol and aldehyde oxidation reactions [20, 21]. Bonding of partial oxidation reaction intermediates/byproducts on gold surfaces are relatively weak compared to other catalytically active metals favoring catalytic selectivity on gold [22]. Highly se-lective catalytic character of gold makes it unique and this property allows the production of carbonyl derivatives by selective oxidation reactions.
In order to understand the nature of oxygen on Au(111) single crystal sur-faces, numerous studies were performed and different oxygen species were men-tioned in the literature. Min et al. reported three different oxygen species such as chemisorbed oxygen, surface oxide and bulk oxide on Au(111) single crystal depending on the adsorption temperature and quantity of oxygen [23]. In this study, the most active species for CO oxidation was reported as the chemisorbed oxygen which was formed at 200 K. In another study, Baker et al. utilized High Resolution Electron Energy Loss (HREEL) spectroscopy to investigate the oxy-gen overlayers on the Au(111) surface and reported two oxyoxy-gen features [24]. In agreement with theoretical calculations, the first feature which is dominant at low coverages was attributed to chemisorbed oxygen atoms in 3-fold sites; while the second feature which prominent at near saturation coverages was associated with surface oxide. Besides, the transformation of the active oxygen species to the inactive ones was reported by Ojifinni et al. [25]. In this study, oxygen species formed at 77 K was shown to be active towards CO oxidation and pre-annealing of O/Au(111) overlayers to a certain temperature was shown to increase the quan-tity of inactive oxygen species. It was suggested that at higher temperatures the adsorbed atomic oxygen species transform from the metastable state (which is responsible for greater reactivity) to a more stable (i.e. less reactive) state.
Another debate about the oxygen species on gold catalysts is the formation of gold oxide. Former studies showed that gold oxide on the bulk metallic gold can be formed at stronger oxidizing conditions depending on the method of oxygen layer preparation [26, 27, 28]. However gold oxide shows low stability and starts to decompose at room temperature [27]. Although it was mentioned in the literature
many times that bulk gold oxide is formed after ambient ozone treatment at elevated temperatures, the conclusive experimental evidences were not presented [14, 24, 23, 29]. In another study, Klyushin et al. demonstrated with in-situ XPS that gold oxide on the gold foil was stable only in the presence of ozone (0.3 mbar) and decomposed under vacuum at 373 K or even in the presence of ozone at temperatures higher than 523 K [28]. In the same work, estimated thickness of the oxide phase was 0.4±0.1 nm which coincides with the smallest axis of the Au2O3 unit cell, pointing to the formation of surface gold oxide.
Surface morphology of the Au(111) single crystal was also investigated after the formation of oxygen overlayers and it was demonstrated that gold surface morphology changed drastically after atomic oxygen adsorption. According to a Scanning Tunneling Microscopy (STM) data, adsorption of oxygen on the clean Au(111) surface initiates reconstruction of the characteristic herringbone struc-ture to a stripped one [30] and leads to corrugation of the surface [23]. Corru-gation manifests itself as release of the gold atoms from the surface yielding a roughened surface. The degree of corrugation depends on oxygen coverage and preparation temperature; the corrugation is stronger at high coverages and high temperatures. DFT studies in the literature agree with the experimental results suggesting the formation of corrugated gold surface and conclude that the cost of adatom creation can easily be compensated at high oxygen coverages [31, 32]. It is interesting that the morphology of the corrugated surface remains unchanged after removal of the surface oxygen by reaction with CO [33].
1.3
Nature of Oxygen on Ag(111) Single
Crys-tal
O/Ag(111) system is an important catalytic system which has been thoroughly investigated within the context of different catalytic reactions in the last few decades both experimentally [34, 35, 36, 37, 38, 39, 40, 41, 42, 43, 44] and/or
theoretically [45, 46, 47, 48, 49, 50]. Campbell reported that atomic oxygen pop-ulated at 490 K by high pressure (5 Torr) O2 dosage on Ag(111) is active for CO
oxidation [38]. Ertl and co-workers reported two distinct surface oxygen atoms on Ag(111) and claimed that only one type of surface oxygen which was stable up to 900 K took part in the methanol partial oxidation reaction to formaldehyde [51]. They also reported that dissolved oxygen species was inactive in this reaction. In another study, Bukhtiyarov and co-workers revealed two types of oxygen species on a silver foil which were claimed to be ionic and covalent oxygen [52]. They found that the covalent oxygen takes part in ethylene epoxidation reaction while ionic oxygen yields only CO2. In their following work, they found that covalent
oxygen is active for an electrophilic addition to the C=C bond of ethylene while the ionic oxygen is active in a nucleophilic attack to C-H bond [42]. Thus, they named these oxygen species as electrophilic and nucleophilic oxygen. .
Oxygen containing Ag(111) surfaces are known to undergo surface reconstruc-tion readily. The most commonly observed reconstrucreconstruc-tion of this system is the
p(4x4) structure which was first observed by Rovida et al. [34]. The atomic
struc-ture of the p(4x4) reconstruction was revised in 2000 [53] and even a more recent model was proposed by Schnadt et al. in 2006 [49]. In addition, other recon-structions of the O/Ag(111) system were also observed such as (√3×√3)R30◦ [54], c(3×5√3)rect [49], (7×7) [44], c(4×8) [50] and p(4×5√3)rect structures [50]. Reconstruction process of Ag(111) surface was reviewed by Michaelides et
al. [55].
Yet, recent studies indicate that O/Ag(111) structure proves to be an elu-sive system to understand in a comprehenelu-sive manner at the atomic scale [56, 57, 58, 59, 60, 61, 62]. Rocha et al. revealed five different atomic oxygen species by ambient pressure XPS on silver single crystals, polycrystalline silver and powders depending on the oxygen accumulation temperature and quantity [63]. Atomic oxygen species reported in that particular study have different elec-tronic structures and their role in oxidation reactions on silver catalysts are still questionable. In another study in 2016, Derouin et al. showed that sub-surface oxygen formation on Ag(111) single crystal strongly depended on the reaction conditions and such species existed during the industrial conditions of ethylene
epoxidation reaction [58]. Thus, sub-surface oxygen might also have a critical role in various oxidation reactions on silver catalysts.
Chapter 2
Experimental
Experiments were performed in a custom-made UHV chamber with a base pres-sure of 2x10⁻¹⁰ Torr which is equipped with X-ray Photoemission Spectroscopy (XPS), Low Energy Electron Diffraction (LEED), Infrared Reflection Absorp-tion Spectroscopy (IRAS) and Temperature Programmed DesorpAbsorp-tion/ReacAbsorp-tion Spectroscopy (TPD/TPRS) capabilities. These characterization techniques were explained in detail in the sections below. A turbo molecular pump (Varian, TV 551 Navigator) with a pumping speed of 550 l/s for N2 was used to evacuate the
UHV chamber. An additional titanium sublimation pump (TSP) with titanium filaments (Varian, Model 916-0017) and a control unit (Balzers, USS2) was used to remove residual gases especially H2. Pressure inside the UHV chamber was
followed by an ionization gauge (Varian, UHV-24). Pictures of the UHV system are given in Figure 2.1.
Au(111) and Ag(111) single crystal samples (10 diameter × 1 mm-thickness disc, both sides polished, MaTeck GmbH) were affixed on Ta wires through which the sample could be resistively heated up to 1073 K. The cool-ing of the sample was achieved via a liquid nitrogen reservoir located inside the sample manipulator probe holding the Au(111) or Ag(111) single crystals. The temperature of the sample was measured using a K-type thermocouple attached on the lateral facet of the single crystals. Single crystals were atomically cleaned
Figure 2.1: Pictures of the multicomponent UHV system
before the experiments by cycles of Ar+ sputtering (Ar(g), Linde AG, purity
≥99.999%) with an ion gun (LK Technologies, Model NGI3000) at room temper-ature using an accelerating voltage of 1.5 kV with a filament current of 15 mA, which is followed by annealing at 773 K in UHV during 20 min.
2.1
Temperature Programmed Desorption/
Re-action Spectroscopy
Temperature Programmed Desorption (TPD) is a technique that provides ki-netic and thermodynamic information about desorption processes of adsorbed atoms/molecules on a substrate [64]. In this technique, the substrate is linearly heated and the partial pressures of atoms/molecules desorbing from the surface are followed by mass spectrometry. When more than one species are adsorbed
on a substrate, this technique is called Temperature Programmed Reaction Spec-troscopy (TPRS). The schematic setup for TPD experiments under UHV condi-tions were given in Figure 2.2. In the current work, PID-controlled linear sample heater (Heatwave, Model 101303) and a quadrupole mass spectrometer (QMS) (Ametek Dycor Dymaxion DM200) were used for the TPD/TPRS experiments. All of the TPD/TPRS experiments were performed with a heating rate of 1 K/s, 70 eV QMS beam energy and 30 ms dwell time for each desorption channel.
Figure 2.2: Schematic setup for TPD experiments under UHV conditions. Adapted from Ref. [65]
In TPD/TPRS experiments, shape of the partial pressure curve as a function of temperature contains information about desorption kinetics because the QMS signal is proportional to the rate of desorption if the pumping speed is large enough [66]. Equation 2.1 is the Polanyi-Wigner equation which indicates the relationship between desorption rate, desorption energy, desorption order and temperature [65]. r = −dθ dt = kdesθ n = ν(θ)θnexp −Edes(θ) RT ! (2.1) T = To+ βt (2.2)
where r is the rate of desorption; θ is the adsorbate coverage in monolayers; t is the time; kdes is the reaction rate constant for desorption; n is the order of
desorption; ν is the pre-exponential factor of desorption; Edes is the activation
energy of desorption; R is the gas constant; T is the temperature; To is the
temperature at which the experiment starts; β is the heating rate (i.e. dT/dt). At very low temperatures, Edes>RT and no desorption occurs. Edes/RT ratio
decreases with increasing temperature and desorption is observed in a certain temperature range. The desorption temperature of the atoms/molecules and the peak shape are affected by the desorption order. Representative TPD spectra for zeroth, first and second order desorption kinetics are given in Figure 2.3. Zeroth order desorption kinetics (n=0 in the Polanyi-Wigner equation) indicates that the desorption rate does not depend on coverage and increases exponentially with increasing temperature. As can be seen in Figure 2.3a, all signals with various coverages have a common leading edge with a rapid drop after desorption temperature maxima. In addition, peak positions shift to higher temperature with increasing coverage. Zeroth-order desorption is mostly observed in multilayer systems where the reservoir of the evolving molecules are practically infinite (i.e. in large excess).
First-order desorption kinetics (n=1) implies that the desorption rate is pro-portional to the coverage. TPD spectra exhibiting first-order desorption kinetics are given in Figure 2.3b. In this figure, the desorption maximum is constant at any coverage and all desorption signals have a characteristic asymmetric peak shape. First-order desorption behavior is common for atomic and non-dissociative adsorption/desorption of molecules in a reversible manner. In addition, for adsor-bate overlayers following layer-by-layer growth mode, non-dissociative desorption intensities for sub-monolayer coverages converge to a saturation intensity where the surface of the substrate is fully covered with the adsorbate. This saturation point can be used to quantitatively determine the relative coverages of the other desorption curves [67]. In the second-order desorption kinetics, the desorption rate is proportional to θ2 and as can be seen in Figure 2.3c, peak maximum
shifts to lower temperatures as a function of adsorbate coverage. Recombinative desorption of atoms/molecules upon dissociative adsorption typically exhibits
second-order desorption kinetics [64].
Figure 2.3: Representative TPD spectra for (a) zeroth, (b) first and (c) second order desorption kinetics. Adapted from Ref. [68]
TPD/TPRS techniques also provide thermodynamic information e.g. adsorp-tion/desorption enthalpies. Although the kinetic parameters that are used to calculate the desorption enthalpy mostly depend on the surface coverage, ther-modynamic information can be derived by making some assumptions [67]. For example, for the molecules that follow first-order desorption kinetics, Redhead analysis can be used to calculate desorption enthalpy of the adsorbate [69]. In this analysis, kinetic parameters are assumed to be coverage independent and the ratio of the pre-exponential factor to the heating rate (ν/β) is in between 108
- 1013 K−1 [65]. The pre-exponential factor is generally chosen as 1013 s−1 [65].
In the Redhead formula (Equation 2.3), the experimental peak maximum of the TPD signal is substituted with Tmax and the desorption energy of the adsorbate
is calculated. Edes = RTmax " ln νTmax β ! − 3.46 # (2.3)
Another way of the desorption energy calculation which allows the determina-tion of the coverage and temperature dependent parameters is the Leading Edge analysis [70]. This method uses the Polanyi-Wigner equation given above. To keep the T and ν variation constant, a small fraction of the spectrum at the low temperature side is used and based on the logarithmic Polanyi-Wigner equation,
ln r is plotted vs. 1/T. After that, Edes can be determined from the slope this
Arrhenius plot. This method uses the minimum number of assumptions however, the quality (i.e. signal to noise, S/N) of the spectrum must be extremely good to have accurate analysis [65].
2.2
X-ray Photoemission Spectroscopy
X-ray Photoelectron Spectroscopy (XPS) is a surface sensitive technique that is based on the photoelectric effect [65]. In this technique, electrons at different energy levels in solids are ejected via irradiation by x-rays and these electrons provide information on the atomic composition of the analyte and the oxidation states of the elements [71]. A diagram of the photoemission process is given in Figure 2.4a. In this process, photon with a known energy (hν) is absorbed by an electron in the core level of atom with a certain binding energy (Eb). This
electron is ejected through the vacuum level with a certain kinetic energy (Ekin).
The kinetic energy is measured by an electron analyzer and the binding energy of the electron can be calculated by using the Equation 2.4. In this equation, φ is the work function of the spectrometer.
Eb = hν − Ekin− φ (2.4)
Electrons have a certain traveling depth in a solid matrix depending on their kinetic energy. The average traveling distance of an electron between two inelastic collisions for a certain Ekin is called Inelastic Mean Free Path (IMFP) [71]. Since
IMFP is less then 1-2 nm between the kinetic energy range of 10-1000 eV for a variety of metals, XPS is a surface sensitive method [71]. IMFP values of atomic solids plotted against Ekin of the electrons - which is also called the ”universal
curve” - is given in Figure 2.4b. As can be seen in this plot, the escape depth is the lowest at the kinetic energy of ca. 50-100 eV indicating electron detection from the outermost layer. It is agreed as a general rule that 95% of the detected electrons are coming from the thickness that three times the IMFP [71].
Figure 2.4: (a) Diagram of the photoemission process. (b) Universal curve that is plot of IMFP values of the metals as a function of the kinetic energy of electrons. Figures were adapted from Ref. [65]
Photoelectron signals are labeled according to the orbital (l) and spin (s) quantum numbers of core levels from which the electron emanates; the total quantum number (J=l+s) is also denoted as a subscript [65]. Since the spin quantum number may be either +1/2 or -1/2, each level for l>1 has two sub-levels and this phenomena is called spin-orbit splitting [65]. As an example, Au 4f has signals which are labeled as 4f7/2 (l=3, s=+1/2) and 4f5/2 (l=3, s=-1/2).
In a regular XP spectrometer, an x-ray tube is used as an x-ray source. A representative schematic is given in Figure 2.5a. In the current work, Riber (Model CX 700) source including Mg (hν=1253.6 eV, Full Width at Half Max-imum, FWHM=0.70 eV) and Al (hν=1486.6 eV, FWHM=0.85 eV) dual anode was used. Anode materials were coated on a copper substrate because copper is a good thermal conductor which can be efficiently cooled with the water cool-ing system. Tungsten alloy filaments (Ø 180 µm) generatcool-ing electrons for X-ray creation were located near the anodes. 200 W power (200 mA, 10kV) was used for electron emission from the filaments for all of the experiments. An aluminum sheet (1-2 µm thick) was used as an energy filter to remove satellite lines and the continuous radiation (the Bremmstrahlung). This aluminum filter absorbs 24% of Mg emission and 15% of Al emission.
Figure 2.5: (a) A dual anode x-ray source configuration. Adapted from Ref. [72] (b) A double-pass cylindrical Mirror Energy Analyzer. Adapted from Ref. [73]
In the current XPS configuration, a double-pass cylindrical mirror analyzer (CMA) (Riber EA150) was used as an energy analyzer. CMA consists of two stages as given in Figure 2.5b. In the first stage (condenser), incoming electrons are focused to the entrance slit of the analyzer stage and it provides flexibility in the sample positioning (± 3mm). Electrons coming from the entrance slit are retarded by the spherical grids and focused along the axis in the second stage. The energy resolution of the system depends on the voltage between the retarding grids and the inner cylinder (F1). Then the beam is re-focused (F2)through the
exit slit to an electron multiplier. Resolution (F1) and focusing (F2) voltages were
optimized in the current work for survey scan (1.0 eV spectrometer resolution) as F1=27 V, F2=50 V and for region scan (0.1 eV spectrometer resolution) as F1=7
V, F2=25 V.
2.3
Infrared Reflection Absorption Spectroscopy
Infrared Reflection Absorption Spectroscopy (IRAS) technique provides informa-tion regarding the adsorpinforma-tion site and/or geometry of the adsorbed molecules on a substrate as well as the concentration of the adsorbate with a high sensitivity
(1/1000 of a CO monolayer) [74].In addition, the high spectral resolution of IRAS (1-5 cm−1) enables detection of the adsorbates which have similar vibrational fre-quencies in contrast to other vibrational techniques such as Electron Energy Loss Spectroscopy (EELS, typical resolution > 30 cm−1) [74]. Besides, its broad work-ing pressure range from UHV to atmosphere and its compatibility with a variety of surfaces make IRAS a widely used technique [74].
In this method, a collimated IR beam is reflected from the surface to be ana-lyzed and collected by a detector. Electric field of incident infrared light has two components namely s-polarized and p-polarized lights which are perpendicular and parallel to the plane of incidence, respectively. These components interact with the metal electrons and a phase shift occurs on the metal surface depend-ing on the angle of incidence (φ). Phase shifts of both components of light as a function of the angle of incidence are given in Figure 2.6a. As can be seen in this figure, s-component of the incident light shifts 180◦ for all angles that results destructive interference. Lack of the parallel component of electric field reveals a selection rule for conducting (e.g. metallic) surfaces that only the vi-brational modes perpendicular to the surface can interact with the electric field. A schematic explanation of this phenomena is given in Figure 2.6b.
In contrast to the s-component, phase shift of the p-polarized light changes drastically with angle of incidence and the shift remains less than 90◦ between 0<φ<85. As an example, surface electric field of copper metal at a frequency of 2000 cm−1 as a function of φ is given in Figure 2.6c (dashed line). In addition, the intensity of absorption is proportional to the square of the surface electric field [74]. This function reaches a maximum at close to grazing incidence in Figure 2.6c (solid line). In order to increase the IRAS signal intensity, IRAS experiments are performed close to grazing angle of incidence.
In the current work, IRAS setup including source and detector compart-ments and an additional UHV chamber was designed and manufactured. Scaled-drawings of the IRAS chamber with all dimensions and a picture of the man-ufactured chamber are given in Figure 2.7. ConFlat (CF, Outer Diameter=8 in) flanges were attached to connect IRAS chamber to the main UHV chamber
and the manipulator. Barium Fluoride Mid-IR transparent view-ports (Hositrad Vacuum Technology, 2.75 CF flange, 38 mm view diameter) were included to the tubings (a) for the IR beam inlet and outlet. These tubings allow execution of IRAS experiments at 83o angle of incidence. Two tubings (b) with 1.33 in CF
flanges were centered directly to the sample position for reactant dosers. Ad-ditional 2.75 in CF flanges (c) together with glass view-ports were attached for visual monitoring purposes.
Figure 2.6: (a) Phase shifts of IR light components as a function of the angle of incidence on a metal surface. Adapted from Ref. [74]. (b) A schematic representation of dipole moments of a diatomic molecule located perpendicular and parallel to the metal surface and their image dipoles on the surface. (c) Electric field and intensity functions of p-polarized light in copper surface as a function of the angle of incidence. Adapted from Ref. [74]
.
Since the IR source and the detector are located outside of the UHV environ-ment, the gas phase vibrational signals of the molecules in the air such as H2O
and CO2can readily obscure surface signals which are relatively lower in intensity.
In order to avoid the interference from these background gases in the air, the IR beam path outside the UHV chamber must go through a controlled environment. This can be done either by pumping the air in the optics compartment outside the UHV chamber or by purging this compartment with an inert gas. Thus two separate Poly(methyl methacrylate) (PMMA) compartments for IR source and
the detector were designed and manufactured. These compartments were purged by using nitrogen gas (Linde AG, purity ≥ 99.99%). A Bruker FTIR Spectrom-eter (Tensor 37) was used and it was located in the spectromSpectrom-eter compartment. The IR radiation coming from the spectrometer as a parallel beam is focused on the sample located in the IRAS chamber by 90o off-axis gold-coated Mid-IR parabolic mirrors (Thorlabs). IR beam reflected from the single crystal passed through the detector compartment and was focused onto a liquid nitrogen cooled Mercury-Cadmium-Tellurite (MCT) detector which is located on a two-axis stage. Description of the IRAS setup is given in Figure 2.8. In addition, a diagram show-ing the optics and the beam path is given in Appendix A. It is worth mentionshow-ing that - to the best of our knowledge - currently designed and manufactured UHV-IRAS setup is the first of its kind in Turkey. Along these lines, currently reported UHV-IRAS results constitute the first UHV-IRAS data obtained in Turkey from single crystal surfaces containing monolayer and multilayer adsorbate overlayers in UHV.
Figure 2.7: Scaled-drawings and final view of the IRAS chamber that was designed and manufactured in the current work
Figure 2.8: Scaled-drawings and final view of the IRAS setup that was designed and manufactured in the current work
.
In the current study, data acquisition details for the IRAS experiments were the following: ADC count rate=15000-18000, aperture size=6 mm, scanner ve-locity=10 kHz, resolution=4 cm−1, number of sample scans=100. Background spectrum was taken before (R1) and after (R2) the adsorbate accumulation on a
single crystal and the adsorbate spectrum was represented to be (R1-R2)/R2 (i.e.
∆R/R).
2.4
Low Energy Electron Diffraction
Low Energy Electron Diffraction (LEED) method provides structural information about the single crystal surfaces and ordered adsorbate layers [65]. Since the IMFP values of the electrons having energy in the range of 20-200 eV is only a few
Angstrom, diffracted electrons carry information only from the outermost layers [75]. Thus, LEED is a very convenient method to investigate surface structures of the single crystals. In this method, electrons are accelerated by an electron gun towards a single crystal surface and the beam of electrons scatters from the surface. Elastically scattered electrons show constructive interference due to the periodic order of the surface atoms when the Bragg condition given in Equation 2.5 is satisfied where, n is the order of diffraction, λ is the wavelength of the electrons, a is the distance between two atoms in the surface, α is the angle between the scattered electrons and the surface normal [65].
nλ = asinα (2.5)
When the scattered electrons are collected on a fluorescent screen, bright spots in each direction of the constructive interferences are observed. This set of bright spots forms the LEED pattern which is the scaled representation of the real surface pattern in the reciprocal (k) space. The real space unit cell vectors (¯ai)
can be determined from the basis vectors in k-space (¯ai∗) by linear algebraic
operations. The relationship between the k-space and real space basis vectors together with the constructive interference phenomena are summarized in Figure 2.9a.
Schematic of a LEED configuration is given in Figure 2.9b. Number of grids located between the sample and the screen varies with different configurations. Those grids are either grounded to minimize the electrostatic deflection of the electrons or negatively biased (e.g. suppressor grids) with respect to the gun po-tential to transmit only elastically scattered electrons. Besides, a few kV positive potential is applied to the fluorescent screen (2.0 kV in the current work) in order to collect electrons and make spots visible.
Figure 2.9: (a) Constructive interference phenomena and the relationship between the real space vs. k-space basis vectors in a LEED experiment. (b) A schematic of a LEED configuration. Adapted from Ref. [75]
2.5
Atomic Oxygen Accumulation Methods
Molecular oxygen does not dissociate neither on Au(111) [76] nor on Ag(111) [38] surface under UHV conditions. The dissociation probability of oxygen molecule is given in the literature as < 10−6 and ∼5×10⁻⁶ on the clean Au(111) [77] and Ag(111) [38] single crystals, respectively. There have been many efforts in the literature to create atomic oxygen under UHV conditions and different methods have been suggested such as thermal dissociation of gaseous O2 on hot filaments
[78], electron-induced chemisorption of oxygen [79], radio frequency-generated oxygen plasma [80], oxygen sputtering [81], co-adsorption of nitrogen oxides and water [82] and ozone decomposition [83]. Among these methods, NO2 adsorption
and ozone decomposition methods were used in the current work (further details are given in the subsections below). Ozone decomposition method was confirmed as the most efficient way of atomic oxygen accumulation as also mentioned in the literature [83].
2.5.1
NO
2and water co-adsorption
In the current work, co-adsorption of NO2/N2O4 and H2O at 86 K with
subse-quent thermal desorption was initially utilized to deliver atomic oxygen species on Au(111). This method has been originally developed by Wang and Koel and described in the literature [82, 84, 85]. It should be noted that atomic oxygen layer cannot be formed by direct interaction of NO2 with a gold surface. In this
method, the heating of co-adsorbed NO2(or N2O4) and solid water to 400 K leads
to the desorption of all species except atomic oxygen. Adsorbed atomic oxygen up to a surface coverage of 0.5 ML (ML= monolayer) can be reliably obtained via this method. Also this approach does not require high pressures of adsorbates. However, this method requires an NO2 dosing system that can prevent NO2
dis-sociation. Most of the conventional valve systems (e.g. high precision UHV leak valves) fail to provide intact NO2 delivery and lead to the decomposition into
NO and O2. Thus, we have used a set of stainless steel (12 mm diameter) blank
discs with microscopic pinholes in the center (ca. 5-40 µm in diameter). These microscopic pinholes were manufactured via a 250 mV pulse laser at Bilkent Uni-versity Physics Department, Prof. ¨O. ˙Ilday laboratory. The 5 µm pinhole disk was installed between the gas line and the UHV chamber. Use of this pinhole allows direct exposure of NO2 without dissociation. Figure 2.10 illustrates the
custom-made pinhole dosing system. Gas exposure can be regulated by manipu-lating upstream gas pressure before the pinhole (i.e. Pg). For the production of
atomic oxygen, a second dosing line equipped with a conventional leak valve was utilized to dose H2O(g).
With this method, different exposures of NO2could be delivered to the Au(111)
surface. However, oxygen could not be detected in the TPD experiments. It is likely that during the transfer of NO2 gas from the glass container to the dosing
line, most of the NO2 had been already decomposed before reaching the pinhole.
Thus, another NO2 delivery system was designed which utilized Pb(NO3)2, as the
NO2 source and was installed to the UHV system (Figure 2.11). This delivery
system thermally decomposed the lead nitrate via resistive heating, generating nitrogen dioxide and oxygen gases. This design precludes extensive interaction
of NO2 with the dosing lines and direct delivery on to the single crystal.
Figure 2.10: Custom-design NO2 dosing line equipped with a stainless steel disc
pinhole (Diameter = 5 µm).
Figure 2.11: Schematic of the custom-made Pb(NO3)2(s)-based NO2 delivery
system.
The preliminary experiments showed that the doser design given in Figure 2.11 does not provide reliable quantity of oxygen atoms on the Au(111) surface. Furthermore, this design also led to unwanted Pb accumulation on the Au(111) surface. Hence, we focused on an alternative Oads/Au(111) preparation method
2.5.2
Ozone Decomposition
As mentioned previously, ozone decomposition method is widely utilized for preparation of Oads/Au surfaces due to its high effectiveness. Furthermore, it
eliminates the necessity to cool the single crystal sample to liquid nitrogen tem-perature and the Oads layer can be prepared at/above room temperature.
How-ever there are some difficulties in using this method. Ozone is produced via atmospheric pressure of oxygen which cannot be directly dosed to the UHV sys-tem. Therefore, an ozone pre-concentrator was designed and manufactured where ozone is first accumulated in a silica gel trap at dry ice temperature (-78 ◦C). Note that while ozone could be captured and stored in/on the silica gel, O2 did
not adsorb onto the silica gel. Then, after evacuation of the excess oxygen, the trap is carefully heated to desorb ozone and ozone is dosed into the UHV system. It should be noted that ozone desorption from silica gel is a very rapid process and care must be taken to prevent explosion due to the rapid pressure rise in the trap. A custom-made corona discharge ozonizer was modified with the silica gel ozone trap system which was connected to UHV system through a pinhole dosing line (Figure 2.12). The ozone in the ozonizer was produced by generating oxygen plasma using a high voltage (6 kV) bias on platinum pins at high oxygen pressure (∼700 Torr).
Figure 2.12: Details of the custom-made ozonizer and ozone trap accommodating the silica gel.
When the silica gel particles absorb ozone molecules, color of the silica gel changes from white to violet (Figure 2.13). However, the amount of produced ozone in the corona discharge cell was not sufficient for the observation of this color change. Thus, a commercial ozone generator (Genozon, GN-Q1001S) was used to produce sufficient ozone that can be stored in the trap. The images of the commercial ozone generator (a), ozone trap before (b) and after (c) ozone accumulation are shown in Figure 2.13. Moreover, Teflon tubing was used for transferring ozone to the leak valve instead of stainless steel tubing in order to prevent ozone decomposition along the dosing pipeline. Different flow rates and ozone trapping times have been used for the optimization. After the optimization, oxygen (99.999% purity, Linde AG) was passed with a flow rate of 1 L/min through the ozone generator connected to the ozone trap by Teflon tubing. The trap was filled with dried silica gel (grain size = ∼2 mm) and cooled with a slurry of ethanol and dry ice (-78 ◦C). After 5 min of O3+O2 flow through the trap at
atmospheric pressure, silica gel particles changed their color from white to violet. Then, the trap was evacuated to 10−3 Torr to remove O2. Next, absorbed ozone
was removed from the trap by heating before dosage to the UHV system.
Figure 2.13: (a) Commercial ozone generator, ozone trap (b) before and (c) after ozone storage.
Chapter 3
Bond Activation on Gold
Section 3.4 in this Chapter is reprinted (adapted) with permission from (Karatok, M., Vovk, E. I., Shah, A. A., Turksoy, A., Ozensoy, E. ”Acetaldehyde Partial Oxidation on the Au (111) Model Catalyst Surface: C-C Bond Activation and Formation of Methyl Acetate as an Oxidative Coupling Product. Surface Science, 2015, 641, pp 289-293). Copyright (2017) Elsevier.
3.1
Characterization
of
the
Au(111)
Single
Crystal Surface
Some metals exhibit rearrangement in their surface atoms under UHV condi-tions to further decrease the surface free energy such as e.g. W(100), Mo(100), Ir(100) [2] and Au(111). Gold is the only fcc metal whose (111) facet exhibits reconstruction under UHV conditions [86]. The reconstruction of Au(111) sur-face has been investigated by numerous methods such as Low Energy Electron Diffraction (LEED) [87], Helium Atom Diffraction (HAD) [88], Scanning Tun-neling Microscopy (STM) [86, 89], and DFT calculations [90]. Reconstructed Au(111) surface has a 22×√3 surface unit cell structure and it is thought to orig-inate from dislocated low-coordination surface atoms which tend to maximize
their coordination [89]. Due to the contraction/dislocation of surface atoms, the unit cell contains 23 atoms instead of 22 atoms. Thus, partial dislocations are periodically formed because of the mismatching epitaxy of surface atoms and the sublayer. These dislocation domains create hills with a height of 0.1-0.2 ˚A to decrease the stress on the surface and so, a zigzag pattern which is called the ”herringbone structure” is formed [89]. Schematic drawing of the reconstructed Au(111) unit cell and an STM image of the herringbone structure are shown in Figure 3.1.
Figure 3.1: Reconstructed Au(111) unit cell [89]. b) STM image of a recon-structed Au(111) surface (size 120×120 nm2) in UHV. Inset shows an atomic
res-olution image (8×6 nm2) where the unit cell is marked with a rectangle. Adapted
from Ref. [91]
Au(111) surface was atomically cleaned by multiple cycles of Ar+ sputtering, followed by subsequent annealing at 773 K under UHV conditions. The cleanness of the surface was confirmed by XPS. Trace amount of argon, sulfur and carbon atoms (i.e. natural contaminations in gold ores) were detected together with gold signals before the cleaning procedure. Sputtering-annealing cycle was repeated until the impurities dropped below detection limits. A representative survey scan of the clean Au(111) single crystal after Ar+ sputtering and annealing cycles is shown in Figure 3.2. As can be seen in Figure 3.2, all photoemission signals belong to the gold sample and no contamination exists on the Au(111) single crystal.
Figure 3.2: A representative survey XP spectrum of the clean Au(111) single crystal.
In order to determine the chemical states of gold atoms, Au 4f region was also analyzed by XPS and the spectrum is given in Figure 3.3a. Au 4f7/2 signal was
found to be located at 84.0 eV indicating metallic state of gold atoms (i.e. Au0)
[92]. In addition to the impurity and the chemical state analysis of the Au(111) surface by XPS, atomic level crystallographic orientation of the Au (111) single crystal surface was also confirmed by LEED. Hexagonal (1×1) crystal pattern was obtained from the clean Au(111) single crystal surface and the LEED image is shown in Figure 3.3b. In this pattern, the spots on the fluorescent screen were dispersed. This is the characteristic pattern of the Au(111) single crystal surface and caused by the herringbone reconstruction of the Au(111) surface which was mentioned above.
Figure 3.3: (a) Au 4f XP spectrum (b) LEED pattern of the clean Au(111) single crystal.
3.2
Oxygen Behavior on Au(111) Single Crystal
In order to understand the nature of oxygen on Au(111), TPD experiments of oxygen layers prepared at various temperatures were performed. TPD spectra showing m/z=32 (O2) with increasing ozone exposure at 460 K (a), 300 K (b)
and 140 K (c) are given in Figure 3.4. In the literature, Saliba et al. performed similar TPD experiments of oxygen via ozone adsorption on the Au(111) surface at 300 K [93]. They concluded that oxygen desorption follows first-order kinetics. In the following works (whatever temperature and atomic oxygen preparation method was utilized), researchers associated the oxygen desorption with first order or pseudo-first order kinetics even though the TPD spectra does not fit the order kinetics [77]. The observed inconsistencies in TPD spectra with first-order behavior were associated with restructuring and corrugation of the surface which is indeed confirmed by STM [23].
In the current work, oxygen TPD spectra of the oxygen layers prepared at 460 K (Figure 3.4a) reveal a common leading edge of the spectral curves with