ÎMS
8
f MSiSMY- S
с о м р ш ш Е m m m : ı s ı s - s s .
i-LDMIí^iü^THilTlO^í OF Ъ-іІЖЖ^Т Uz^fZ^E:iffr: ^viEiJT О ? THE REQUIEEMEi'áTS FOE THE
US·Ы -lD :?>áI3"í‘4_4ΤΪAKf
H P
I5U2.-I5
■ZS5
THE NATURE OE HUNGARY'S
COMPARATIVE ADVANTAGE : 1975 - 88.
A THESIS
SUBMITTED TO THE DEPARTMENT OF MANAGEMENT AND GRADUATE SCHOOL OF BUSINESS ADMINISTRATION OF BILKENT UNIVERSITY IN PARTIAL FULFILLMENT OF THE REQUIREMENTS FOR THE DEGREE OF MASTER OF BUSINESS ADMINISTRATION
BY
KATALIN ZAIM JUNE, 1992
^ o ^ C C i
tarafindcn bc^rJanmiffir.
MF
<Ъч2.'о
I certify that I have read this thesis and in my
opinion it is fully adequate, in scope and in quality, as a
thesis for the degree of Master of Business Administration.
Asst. Prof. Dr. Fatma Taskxn
I certify that I have read this thesis and in my
opinion it is fully adequate, in scope and in quality, as a
thesis for the degree of Master of Business Administration.
I certify that I have read this thesis and in my
opinion it is fully adequate, in scope and in quality, as a
thesis for the degree of Master of Business Administration.
Approved for the Graduate School of Business Administration.
The Nature of Hungary’s Comparative
Advantage: 1975-88
Kataliii Zaiiri
June 1992.
Abstract
In this work the aim is to analyze the Hungarian Foreign Trade perfor mance during the period 1975-88 by using the Revealed Com parative Ad vantage (RCA) methodology. Hungary was the first centrally planned
econ-• *
omy to introduce market - oriented reform, in 1968. This reform was called the New Economic Mechanism (NEM). The reform consisted of: price reforms, liberalized trade with the western economies, institutional reforms in the area of banking and taxation.
The results of this study indicate that Hungary revealed comparative ad vantage in commodity groups such as: industrial machinery and equipment, foodstuffs and industrial consumer goods; and revealed comparative disadvan tage with commodity groups such as: chemicals, building materials, fertilizers, rubber and raw materials of vegetable and animal origiir, in her overall trade in the world.
K eyw ords: Hungary’s 1968 Reform, Comparative Advantage, Revealed Compara tive Advantage.
ÖZET
DIŞ TİCARETTE MACARİSTAN’IN MUKAYESELİ ÜSTÜNLÜĞÜ: 1975-1988
KATALIN ZAİM Yüksek Lisans Tezi
Tez Yöneticisi: Y. Doc. Dr. Fatma Ta.^km Haziran 1992. .‘33 Sayfa
Bu çaİLŞinanın amacı Macaristan’ın 1975-88 dönemindeki dış ticaret performansının Açıklanan Mukayeseli üstünlükler tekniği ile incelenmesidir. Macaristan 1968 yılında Yeni İktisadi Mekanizma olarak da bilinen rekabete ve ticarete yönelik reformları sunan ilk merkezi planlı ekonomi olmuştur.
Çalışmanın sonuçları, sınai makine ve teçhizat, gıda ürünleri ve sınai tüketici malları ticaretinde Macaristan’ın mukayeseli üstünlüğün ü göstermektedir. Ancak, aynı üstünlük kimyevi maddeler, inşaat malzemeleri, gübre, lastik, hammaddeler, yeşil sebze ve hayvani ürünlerde görülmemektedir.
Aknowledgem ents
I gratefully acknowledge the encouragement and guidance of Asst. Prof. Dr. Dr. Fatma Ta,5km during the preparation of this thesis. Helpful comments of Asst. Prof. Dr. Sengul Gulnur and Asst. Prof. Dr. Nedim Alemdar are also appreciated.
I am also thankful to my husband, Asst. Prof. Dr. Osman Zaini and my daughter, Nergis Zaim who had the patience again to overcome difficult periods, to my Parents and my husband Parents.
C on ten ts
1 Introduction 1
2 Historical Review of Economic Reform in Hungary since 1968 2
2.1 Conditions Prior to 1968 ... 3
2.2 After 1968 Reform Im p lem en tatio n... 3
2.3 Further Amendments Brought to 1968 Reforms ... 4
2.4 Price R e f o r m ... 5
2.5 Foreign Trade and Exchange Rate R e f o rm ... 7
2.5.1 Trade with Market Econom ies... 7
2.5.2 Trade with the CMEA A r e a ... 8
2.5.3 The Exchange Rate System and Export Incentives... 10
2.6 Fiscal R e fo rm ... 11
2.7 Banking and Capital Market R e f o r m ... 11
2.8 Developments and Outlook 13 3 Literature Review on Revealed Comparative Advantage 15 3.1 Early Attempts to Quantify Comparative A d v a n ta g e ...16
3.2 Alternative Indexes ... ? ' .. ... 3.3 Recent Theoretical D evelopm ents... 20
3.3.1 Aggregate Trade Im b a la n c e ... 20
4 An Analysis of Comparative Advantage of Hungarian Economy 22 4.1 D a t a ... 22
4.2 Empirical R e s u lts... 23
5 Conclusion 31
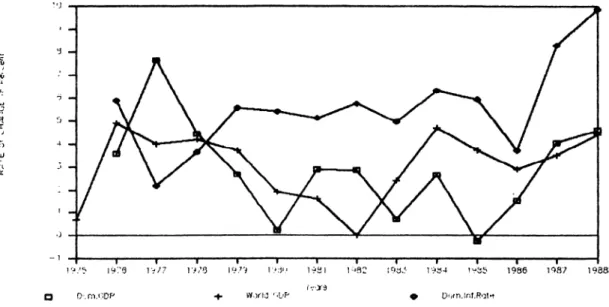
1 GDP at Constant Prices and Inflation Rate. Adopted from IMF
Yearbook 1990 3
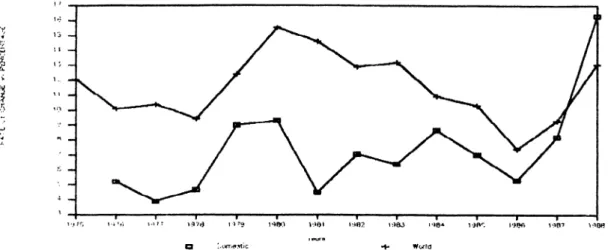
2 Change in Domestic and World Consumer expressed in Forint. Adopted from IMF Yearbook 1990 ... 6 3 Export and Import Prices (Index Numbers, 1985=100). Adopted
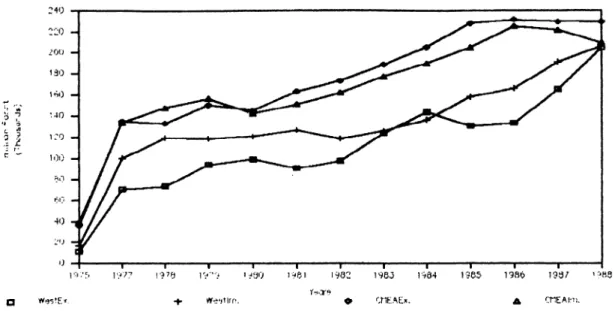
from IMF Yearbook 1990... 6 4 Export and Import Volumes in CMEA and Western Countries ex
pressed in Forint. Adopted from IMF Yearbook 1991 9
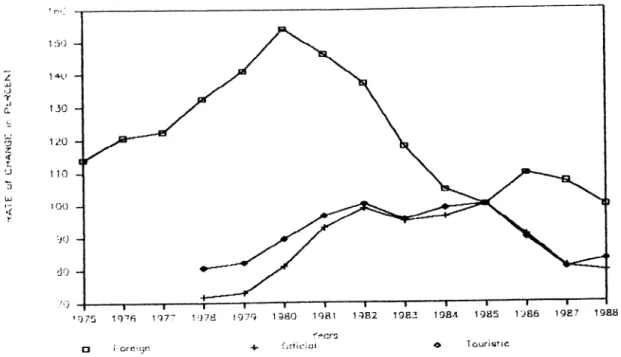
5 Foreign Trade Multiplier, Official and Touristic Rates (Index Num bers, 1985-100). Adopted from IMF Yearbook 1990 ... 10 6 Revealed Comparative Advantage (RCA7) of Commodity Group CTN
1 ...28 7 Revealed Comparative Advantage(RCA7) of Commodity Group CTN
2 - 5 ... ’... 28 8 Revealed Comparative Advantage(RCA7) of Commodity Group CTN
6 - 8 ... . 2 9 9 Revealed Comparative Advantage(RCA7) of Commodity Group CTN 9 30
f
List of Tables
Average Revealed Comparative Advantage (RCA7i) of Commodity Groups in the Period 1975-88... 24 Average Revealed Comparative Advantage (RCA7) of all Commodity Groups in a given Period of T i m e ... 27
1
In trod u ction
In this work the aim is to analyze the Hungarian Foreign Trade performance dur ing the period 1975-88 by using the R evealed C o m p a ra tiv e A d v an tag e (R C A ) methodology. Hungary was the first centrally planned economy to introduce a broad market- oriented reform, in 1968. This reform was called the New Economic Mecha nism (NEM). The reform consisted of: price reforms, liberalized trade with western economies, institutional reforms in the area of banking and taxation. However, the overall results were unsatisfactory.
The authorities continued to maintain substantial formal and informal central control. Reform measures were often partial, inconsistent, and some times also reversed. As Prime Minister .Jozsef Antal stated in May 1990, “In the economy, too, everything wa^ upside down. The State embraced all activities in the direc tion and operation of the economy; the state enterprises were not real enterprises; state redistribution has pushed its way into the place of the market” (Nepszabad-
sag,1989.Jan.3.p.l). *
Hungary’s foreign trade was characterized by a more Western country oriented trade during the first four years of the reform period (1968-1972), which then shifted its momentum toward the CMEA countries in the period of centralization (1975-80). The following decentralization period (1981-84) led the businesses to dedicate more attention again toward the western world.^ However, the country’s economy could not keep up with the world trend; consequently, Hungary debt increased and the economy entered in its so called stagnant stage. The critical turning year was 1988 when not only the public but also the Government realized that political change was needed to improve the economy. As a result, Hungary had its first free election after forty years in 1990. The primary goal of the new Government was to shift to a completely open market economy.
To shed more light on the trade performance of Hungary during the period 1975- 1988 the revealed comparative advantage methodology is adopted. This approach will identify the manufecturing sectors which revealed advantageous in Hungary’s trade with respect to the world trade performance in the period of 1975-88.
2
H istorical R ev iew o f E conom ic R eform in H u n
gary since 1968
The earliest example of a broad market- oriented reform program to be implemented in a centrally planned economy is Hungary’s New Economic Mechanism (NEM), introduced in 1968. The objective of this reform was to allow the enterprises to approach the world market with a competitive mind under the socialist setting which consisted of monoparty system and partial control of the activities of the enterprises by the State.
The NEM freed enterprises from mandatory plan directives and relaxed controls. As a result, Hungary’s economy improved in the first four to five years of the NEM which was also reflected in its foreign trade figures. Clark (1989) reported that the rate of growth of exports between 1971-75 was 9.6% and the rate of growth of imports was 7.5%. However, this period was not without tension. In particular, opposition to the decentralization of decision making proved to be stronger than anticipated. More specifically the years 1972-1978 were characterized by the abortion of reform. The
1968 reform left intact most of the economic management of institutional system. After 1968, the authorities attempted periodically to improve the NEM and to rejuvenate the reform process. In the saipe time, enterprises remained subject to in formal direct controls; in addition, substantial indirect controls governed entry, exit, and the selection of lines of activity. The authorities were able to affect enterprises’ financial results through price and wage regulations, taxes, and subsidies.
Until 1990, the scope and effectiveness of economic reform in Hungary were lim ited by the pressure of the social- political model. This model wiis based on the Hungarian Socialist Workers’ Party’s dominance of both political and economic ac tivities. This situation limited the implementation of the reform blueprint. As a result, new political reform was necessary to realize an economic transformation. For this purpose, the first free elections Wcis conducted the first time in forty years in March-April 1990. The coalition Government has formulated a comprehensive pro gram of economic reform aimed at moving to a market economy based on private ownership with a social safety net for the needy.
In the next section, the conditions prior to 1968 and the reform efforts undertaken after 1968 are described. The blueprint of the NEM introduced in 1968 is outlined. Then the reforms undertaken between 1968 and mid- 1990 with respect to: (1) the macroeconomic decision making system; (2) the price system; (3) the foreign trade and the exchange system; (4) the fiscal system; (5) the banking system and capital
D<>rn.lr>r.RcH»i
a D-.m.i.'-DP ·♦· vvorij '-L'P
Figure 1; GDP at Constant Prices and Inflation Rate. Adopted from IMF Yearbook 1990
market are going to be described. This historical review is concluded with a review of recent economic developments and of the current economic situation. ^
«
2.1
C on d ition s P rior to 1968
Central planning was introduced in Hungary in the late 1940s. This meant that the authorities established the social ownership of production in both the industrial sector as well as in the agriculture. Th? macroeconomic plans were formulated at the center. These concerned production, investment, employment, and setting of wages and prices. The main objective of this period was rapid industrialization. This was achieved by growth and forced saving. However, the goal of this period was pursued in a partially insulated environment from the world economy.
Change toward decentralization was needed. The leadership approved the recom mendations in mid-1966, and experts prepared the detailed decrees and regulations. The New Economic Mechanism (NEM) was implemented on January 1, 1968.
2.2
A fte r 1968 R eform Im p lem en tation
The blueprint of the NEM outlined in the resolution of the Central Committee of the Party of May 7, 1966, represented a reform model aimed at modifying certain basic features of traditional central planning without overcrossing the limits of the established social-political system. The objective was not to reform socialism but rather to improve the methods of “building socialism”.
*The literature review was based on the following materials: Antal et.al.l987; Clarke 1989; Kornai 1987; Lendvai 1988; Revesz 1991; Richet 1989.
The most important characteristic of the NEM was its elimination of directives and commands from the center. Correspondingly, it abolished the central allocation of the means of production and inputs and authorized trading among enterprises. Independent enterprises were to be responsible for microeconomic decision making subject to a uniformly applied system of economic regulations; the interests of em ployees were represented in the decision-making process of enterprises. Finally, the MEM plan allowed a closer direct relationship between the domestic economy and (breign markets by introducing an unified exchange rate, price determination ac cording the foreign prices, and by licensing enterprises to be able to conduct foreign trade directly.
'¿.3
Further A m en d m en ts B rou ght to 1968 R eform s
As part of the 1968 economic reforms, the central authorities lost the power to o«it the output levels of the individual enterprises and also abolished the allocation ,if materials. The enterprises were expected to become autonomous so that they s (iiild adjust to the market trends. However, the enterprises remained subject to the |\>rmal and informal interference of government supervisions and representatives of aocial and political organizations.
The State Enterprise Act of 1977 sought^to establish a better balance between centralized control and state enterprise autonomy by decreasing the supervision of supervisory agencies. This Act and other legislation, which took effect January 1, 1985, established a new institutional framework for state enterprises based on self- Uianagement with workers’ participation. However, in large state companies, basic decisions over production, marketing, investment, organization, and mergers, and ,vver the creation of subsidiaries, were determined by the enterprise’s councils. In vuiall enterprises of up to five hundred employees, these decisions were undertaken hy the assembly of employees. The enterprise councils and eissemblies could also ,iecide on the performance criteria and selection of managers. By the latter part of :;987, about 73 percent of state enterprises had been transformed in this fashion and xvere under the supervision of enterprise councils or assemblies; 27 percent remained c,uder direct state control.
The poor performance of state enterprises resulted largely from interference by . le central authorities. The Law on Transformation adopted in June 1989 sought lO provide the legal framework for transforming state enterprises and cooperatives ,iLo joint stock companies. It also allowed for the transfer of ownership in part or
whole to foreign investors.
The new Government’s goal is to reduce the share of state- owned property to less than half of total assets in the competitive sphere of economy by 1993. The emphases is to achieve privatization through market means. The Government, in its four-year program launched in March 1991, proposed to accelerate privatization strategy. The Government recognized that foreign investment brings not only financial resources, but also modern management methods, modern technology, and better market ac cess. Therefore the new Government encouraged foreign investment, allowed free flow of knowledge and technology from the developed countries.
2.4 P r ic e R eform
Before the introduction of NEM in 1968, prices were fixed by the authorities. Differ ences between foreign and domestic prices were compensated by transfers of special funds, and consumer and producer prices were separated through a complex system of taxes and subsidies. The 1968 reform introduced a price system based on:
1. Fixed prices set by the Government which were applied in the following tree areas:
• basic raw materials for industrial ¿v agricultural use such as: fuel, elec tricity and fertilizers;
• basic agricultural products such as corn, milk, livestock and meat;
• basic consumer goods and services such as flour, sugar, bread, meat, drugs, beer, housing and public transportation;
2. Flexible prices, allowed to fluctuate between officially set upper and lower limits and were applied in the following sectors:
• capital goods;
• manufactured consumer goods; • processed food;
3. so-called free prices were applied for: • fashion items and cosmetics;
• food produced by small private businesses;
Figure 2: Change in Domestic and World Consumer expressed in Forint. Adopted from IMF Yearbook 1990
Figure 3: Export and Import Prices (Index Numbers, 1985=100). Adopted from IMF Yearbook 1990.
• other public services;
The new regulations foresaw a greater freedom for enterprises to set prices in re sponse to market forces, but even the free prices remained subject to considerable administrative control. The National Materials and Price Office intervened directly to prevent extreme price increases.
The Government did not undertake renewed price reform set in the 1968 blue print until 1979-80. First, consumer prices were raised in mid- 1979.(Fig.2) At the same time, the authorities reduced net food subsidies and raised the net taxation of luxury goods. In the same year, the prices of services, including rent and transportation were not adjusted, and subsidies on these items continued to increase.
Domestic prices of energy and raw materials were linked to world market prices. The differences between domestic prices and prices of imported inputs from the CMEA area was covered by the application of “producers” differential turnover taxes. The National Materials and Price Office monitored and enforced these complex rules.
Beginning in 1985, enterprises that could prove that a substantial part of their output could be exported at a profit, were eligible to join a so- called price club. Members of this club were freed from the pricing rules limiting profit margins, but they remained subject to the import price constraint.
At the beginning of 1988, producer prices were adjusted in connection with the introduction of a personal income tax. In addition, the differentiated turn-over taxes were replaced by the value-added tax (VAT), and subsidies were cut. As a result, agricultural and food prices increased and prices in manufacturing, construction, and the services sectors declined.
“On April 1, 1988 - when the general application of the advance notification of intended price increases expired - 20 percent of consumer prices remained subject to administratively set ceilings, 22 percent to the advance reporting obligation, an d , 5 percent to the price consultation process. The remaining 53 percent were sub ject only to the import price limitation and other general pricing rules that ensure compliance with the law against unfair trade practice.” (Clarke 1989.p 54.)
The new Government recognized the ne^l to increase competition through the liberalization of goods and factor markets to create the proper conditions for struc tural change and efficient resource use. From the beginning of 1991, consumer prices were freed from controls. Consequently, consumer prices rose to about 90 percent. Central control of prices remained only for commodities such as textbooks, one type of milk, white bread, and public utilities. The Price Office, which was responsible for controlling prices, was abolished in January 1991. The Government planned to liberalize further regulations on prices.
2.5
Foreign Trade and E xchange R a te R eform
As the Figure 4. indicates, until 1991, Hungary’s trade with the socialist word was greater respect to the market economies in terms of volume.
2.5.1 Trade with Market Economies
The state monopoly of foreign trade, instituted in 1948, remained intact after the 1968 economic reform. The foreign trade was carried out by authorized
state-owned economic organizations. These were specialized foreign trade organizations and trading companies. These entities received general or specific permits to con duct foreign trade transactions on their own account or on a commission basis. (Revesz,1991.p.68)
In mid-1987, the authorities extended general foreign trading rights to any en terprise in the socialized sector whose convertible currency exports amounted to at least 1 million dollars in the previous year. A further major change, which ended the system of foreign trade as a state monopoly, was introduced at the beginning of 1988. Under the new regulations, every organization registering with the Ministry of Trade, including private entities, was authorized to engage in commercial foreign trade transactions without prior application and approval. (Figure 4.)
2.5.2 Trade with the CMEA Area
Until the end of 1990, the bulk of Hungary^’s trade with the ruble area was con ducted under bilateral quotas negotiated in annual official trade agreements. These agreements ensured essential imports of energy and raw materials, against which the Government committed to export Hungarian agricultural and industrial prod ucts.(Ricket 1989.p.72) ^
Pricing rules guiding intra-CMEA trade clyinged over the years, from fixed prices in the 1950s, to an adjustment of prices at five-year intervals in the 1960s and early 1970s; and since the mid-1970s, to annual adjustments based on moving five-year averages of world market prices. These rules were combined in practice, however, with extensive bargaining over technical cispects, rebates, discounts, and payment terms. As CMEA foreign trade prices remained distorted relative to world market prices, the Hungarian authorities applied a system of taxes and subsidies to ensure that enterprises achieved similar profitability in ruble trade transactions as in trade with convertible currency and domestic partners.(Figure 4.)
Until the beginning of 1988, enterprises received full and automatic compensation from the budget for the difference between the profitability of transactions with convertible currency or domestic customers.
In 1989, measures were taken to decrease ruble exports. The forint was appre ciated by 5.5 percent; some export licenses were canceled. Since January 1, 1991, trading with CMEA countries has been at world market prices. This involves a
^“Council for Mutual Economic As.sistance” , better known in the West as “COMECON” , des ignated the centrally planned economies in Europe -Bulgaria, CS.SR, GDR, Hungary, Poland, Romenia, and the USSR.
Cnfc-.AEx. A CnEAlrv,.
Figure 4: Export and Import Volumes in CMEA and Western Countries expressed in Forint. Adopted from IMF Yearbook 1991
T o u r i « r i c
Figure 5: Foreign Trade Multiplier, Official and Touristic Rates (Index Numbers, 1985-100). Adopted from IMF Yearbook 1990
2.5.3 The Exchange Rate System and Export Incentives
«
During the period of central planning (before 1968) the exchange rate was unified. The 1968 reform set a new exchange rate system. This included the “official” rate, which was used for statistical purpose with no operational significance; a commercial rate, the so called “foreign trade multiplier”, and the noncommercial rate, called the “touristic rate” (trough 1976). (Figure 5.)
The official rate was abolished in 1976 and the noncommercial rate - set at Ft 30 per U.S. dollar in 1968, as against a commercial rate of Ft 60 per U.S. dollar, was gradually moved closer to the commercial rate beginning in 1979. In October 1981, the two became equivalent. Different exchange rates were applied for trade with other members of the CMEA. In 1968 Ft was set at Ft 40 per TR (transferable ruble).
After setting the commercial exchange rate in 1968, exports and imports were valued in domestic currency at foreign currency prices multiplied by this exchange rate and adjusted for customs tariffs, import turnover taxes, and subsidies. A tax rebate for exporters on the differential producers’ turnover tax was ineffective from 1980 to 1988 to stimulated exports to the convertible currency area.
In the period of December 1989 and in the first months of 1990, the forint was depreciated by 15 percent against the basket of convertible currencies. The new Government depreciated the forint by a further 15 percent in .lanuary 1991. With the sharp reduction in trade restrictions in 1991, and the end of the CMEA trading arrangements, the role of exchange rate policy has been considerably increased. The
Government has announced its intention to achieve convertibility of the forint by 1993.(Revesz 1991,p.91.)
2.6
F iscal R eform
In 1968 the central Government lost the authority to issue plan directives. Under the 1968 economic reform, the government applied a new taxe and subsidy system in the area of production, products and incomes. The objective of this system was to (i) secure revenues to finance government operations, investment, and consumption expenditures; and (ii) redistribute current enterprise profits and retained earnings in order to achieve the production, trade, income and price objectives.
During the 1975s, many of the changes were adopted in order to isolate the domestic economy from a full adaptation to the market economy. These were in line with the strong CMEA affiliation which required a return to the central period’s structure. The fiscal measures such as tax level and subsidies were differentiated for » some enterprises. These measures were individually negotiated with the authorities. Generally the large and inefficient companies were favoured. This lead to a multiple taxation with multiple aim that tented to violate the basic objectives of the 1968 reform.
To solve the situation the government sim/lified the tax system with the price reform of 1980. This consisted of the shift of taxation from the production of profits to incomes. The 1980 reform was reversed in 1985 with a shift in the burden of taxation from profits and retained earnings back to the factors of production. The Government abolished a 40 percent levy on enterprise depreciation allowances and introduced a new tax of 10 percent on the wage bill of enterprises payable from after-tax profits; a new tax of 3 percent on the net worth of enterprises with certain branches exempt and others subject of penalty rates.
2 .7
B anking and C ap ital M arket R eform
The authorities did not significantly alter the highly concentrated and specialized banking system and segmented financial structure of the economy - established in the late 1940s - until the mid-1980s. The banking sector continued after 1968 to be dominated by the National Bank of Hungary (NBH). The NBH performed central banking functions; regulated foreign exchange transactions, with responsibility for conducting almost all external credit operations with the convertible currency area. Through its credit department and branch offices the NBH acted as the principle
banker of the enterprise sector and helped administer government programs in in dustrial policy and other areas. NBH had direct control over the allocation of credit. It has less important role in the interest rate determination.
The other banks in the system continued to be restricted to specialized activities. The State Development Bank’s principal task was to prepare, monitor, and finance state investment projects and allocate equity to enterprises. The Hungarian For eign Trade Bank specialized in foreign currency trade financing of enterprises. The National Savings Bank, supplemented by the Postal Savings network and savings cooperatives, acted as the banker of the general population , private concerns, and local authorities. It collected deposits at low interest rates.
Other banking and financial institutions (including the Central European Inter national Bank,Ltd., established in 1979 as an “offshore” bank in a joint venture between the NBII and six foreign banks) played a peripheral role, mainly conduct ing foreign exchange and real estate transactions. In addition, beginning in 1983, the authorities set up small experimental financial institutions in the form of spe- cialized funds mainly to finance research and development and venture capital for risky projects.
In 1985, the Government adopted preliminary institutional reforms. These in cluded separating central banking and commercial banging functions within the NBH, converting the Budapest branch of the^NBH into an independent subsidiary. In 1986, a new commercial bank, Citibank Budapest, was established under the joint ownership of Citibank (80 percent) and the NBH (20 percent), authorized to offer all types of banking services to enterprises. Whereas, other interest rates continued to be determined administratively. From 1986 on, lending institutions became free to set loan rates to enterprises subject to the constraint that the average rate changed not to exceed the refinancing rate of the NBH by more than 1.5 percentage points.
The banking reform, consisting of the establishment of the two-tier banking sys tem, was implemented in .January 1987. The domestic commercial operations of the NBH and the State Development Bank were taken over by three new commercial banks. The new banks were set up as joint stock companies owned directly by the State and state enterprises. They assumed the deposits and the loan portfolios of their predecessors. In 1987, the authorities lifted the requirement for enterprises to keep their current accounts with a particular commercial bank and authorized the banks to use interest rates to complete for enterprise deposits and loans.
The segmentation between banking services for enterprises and the traditional network of savings institutions for households continued to prevail through 1988.
Beginning in early 1990, further decentralization took place in the banking sec tor. Certain commercial banks were permitted to carry out trade-related foreign exchange operations. Banks were also permitted to make foreign currency loans for export pre-financing of certain export- related investments.
Other developments in the financial system was the issuing of bonds in 1981. Initially, local councils issued bonds to finance infrastructural projects. Since 1983 state enterprises have also issued bonds. The State Development Bank initiated secondary trading of bonds in 1984. Further new developments in the securities market included the selling of shares and the opening in early 1988 the first brokerage house. Following this, the Budapest Stock Exchange formally reopened operations in .June 1990.
2.8 D ev e lo p m en ts and O utlook
During the 1970s, macroeconomic policies in Hungary were able to prevent chronic shortages and control inflation. From the late 19’iOs to the mid- to late 1980s, the economic policies were frequently reversed from a decentralized to a centralized character.
The Government in mid- 1987 adopted a medium-term program. This program objective was to stabilize the economy andi make some structural reforms. This resulted in a GDP growth of 1/2 of 1 percent in 1988 and in a 2 percent decline in domestic demand. The convertible current account deficit- which reached 6.3 percent of GDP in 1986 - decreased gradually to 2.9 percent in 1988. In response to this deteriorating situation, the Hungarian authorities adopted policies in late 1989 to achieve domestic and external balance. The goals of these policies were outlined as follows;
• tighten fiscal policy by roughly 2 percent points of GDP relative to 1989; • limited the expansion of domestic credit to well below the rate of inflation; • depreciate the forint against convertible currencies by 15 percent and tightened
household access to foreign currency; and
• Towered ruble export quotas while taking administrative measures to ensure adherence to these quotas.
The structural reforms included price and import liberalization, decentralization of the banking system, and measures to accelerate enterprise restructuring. In the fall of 1990, the Government adopted a comprehensive medium-term program designed to put in place a contemporary market economy within three years.
3
L iterature R ev iew on R evealed C om parative
A d vantage
According to the International Trade Theory difference in prices from country to country are the basic cause of trade. They reflect differences in costs of production or demand conditions. Therefore, some goods must be cheaper to produce at home and some goods must be cheaper to produce abroad and will be imported from other countries. This generalization is the fundamental of the Law of Comparative
Advantage which is defined as:
“In a w orld of c o m p e titiv e m ark ets, tra d e will o ccu r and will be beneficial w h en ev er th e re are in te rn atio n al differences in relativ e costs
of p ro d u c tio n ”
There are different explonations for the source 9f comparative advantage of a country. Ricardian theory of comparative advantage attributes relative price differences in the technologies and production condition.
Another explonation is given by Heckscher-Ohlin model. “It assumes that a capital- abundant country will tend to specialize in the production of capital-intensive commodities, and it will therefore export thos^ commodities in exchange for labor- intensive commodities, relieving its scarcity of labor.”(Kenen,1985.p.65). The theo rem in general terms:
T rad e is based on differences in facto r a b u n d an ce, an d it serves to red u ce th e p rin cip al effects of th o se differences
One way to empirically measure comparative advantage is through Revealed Com parative Advantage (RCA) Indexes. Its aim is to identify the relative position of a country manufacturing industries in world trade through different indexes. Several indexes had been developed since 1965 when Ballassa formulated for the first time the RCA index. In the following section a literature review on different RCA indexes is presented.
The R evealed C o m p a ra tiv e A dvantage Index is built upon the measures of trade performance of a country foreign trade. Its aim is to identify the relative posi tion of a county manufacturing industries in international trade through different in dexes. The form of each index and the interpretation given to their values has varied from author to author. However, the empirical and theoretical literature appear to
agree that a country reveals a comparative advantage (disadvantage) in a commod ity if an index’s value is greater (less) than one. R evealed C o m p ara tiv e A dvan- tage(RCA) has first been formulated by Balltissa(1965). The methodology of R C A deals with identifying the overall direction of a country’s trade. The suggested mea sures could also give information about the direction that a country’s trade should take in order to take advantage from international differences in production, factor supplies and demand. Kunimoto(1977); Hillman(1980); Bowen(1983;1985;1986); Ballance et.al.(1985;1986); Yeast(1985); Marchese(1989) and Webster(1991) have analyzed the properties of various revealed comparative advantage (RCA) indexes purported to approximate actual comparative advantage. Bowen(1983;1985;1986) and Ballance(1985;1986) have tried to identify the shortcomings of the two measures originally suggested: export performance and export-import s/io7’es(UNIDO,1982).^
3.1
E arly A tte m p ts to Q uantify C om p arative A dvan tage
Liesner(1958) was tlie first to use post- trade data to quantify comparative advan tage (CA). He defined indexes of relative export performance as proxies for com parative costs. Liesner developed a composite index which approximated bilateral comparative advantage between Britain and its European competitors for a single commodity. The following index was used for this purpose:
f
BCAV, = ( X \ I K ) K x i l K ) = ( x n x t )
where A ’ is the amount of any specified (manufactured) commodity a exported by Britain;
X I is the export volume of commodity a by any of the specified European countries
e; and
stands for the export volume of commodity a by the seven specified European countries collectively (d).
Balassa(1985) adjusted Liesner’s index in order to identify the enduring effect of trade liberalization resulting from the Kennedy Round of GATT. His adjustment
^The export performance of RCA is:
RCA
={X iilX j)l{W ilW )
where is country j ’s exports of good i;Xj
is total export of country j;Wi
is world ^s trade of good i;W
is the world’s total trade.consisted of the division of “a country’s share in the export of a given commodity by the combined exports of manufactured goods of the ten industrial countries under consideration” (p.l05.).
RCA2\ = ( X ‘J X t) { X 'J X I,)
where is the export volume of commodity a by any of the following devel oped countries indicated by i: Belgium, Canada, France, Italy, Japan, Luxembourg, Netherlands, Sweden, United Kingdom, United States, and West Germany;
is the export volume of the commodity a by all eleven main industrial countries indicated as c;
X^^ is the export volume of seventy-four manufactured goods, m , by any of the fol
lowing developed countries i: Belgium, Canada, France, Italy, Japan, Luxembourg, Netherlands, Sweden, United Kingdom, United States, and West Germany; and
Xj^ is the export volume of seventy-four manufactured goods, m , by all eleven main
industrial countries, c. «
When Balassa(1965) formulated RCA, assumed “uniformity in tastes and uniform of duties in eleven industry within each country”. Under this assumption, he con cluded that export-import ratios would reflect relative advantage. However, there is a relative difference in both taste and preferences as well as resource endowments among the countries. These differences unders(^re Balassa’s comparative advantage index.
As Wollpath( 1987) suggested, Balassa’s measure can easily be enlarged to reflect normalized global comparative advantage by including all countries and all traded commodities:
RCA3i = ( x i / x ; ) / ( x : / x n
where X^ is country i’s export of commodity a;
XI is country i ’s export of all trade commodities t;
X ^ is world’s export of any specific commodity a; X ^ is world’s export if all traded
commodities t;
RCA3 is equivalent to Kanamory’s export specialization index, called “tokka keisu”. However, Kanamory(1964.p.57-67) did not associate this index with comparative advantage.
Kunimoto(1977) showed that trade intensity indexes are equivalent to the ratio of actual-to- expected trade. He focused on a specific index which characterised the trade between two counties i and j. He called this as the “geographical intensity
index” G'^'·
Qij ^ [ X ' i I I
G*·' is an index of bilateral trade intensity relating one coutry’s exports to another country’s imports.
3.2
A lte r n a tiv e Indexes
Bowen(1985) criticized Balassa’s intensity index by pointing out that “it is in general inappropriate to interpret deviations from unity (as presently computed) in such indexes as indicating comparative advantage”. He also demonstrated that Balassa’s index “rests upon the implicit assumption that a county exports every commodity”. He concluded that such an assumption is in general, inappropriate in a trading environment. To overcome the shortcomings of Balassa’s index, Bowen proposed to use two indexes namely the Net Trade Intensity Index (N1) and the Production
Intensity Index (PI). These indexes were based upon the relationship between a
country’s production, consumption and trade in a commodity relative to what would occur in a hypothetical neutral comparative advantage world:
RCA4i = N i i = {P li - 1)
f
NIi = Tili Y 'I Y '· ) X
P ii = Q‘.n Y ‘I Y " ) x Q r , Ti = Q \ - c i
where is the “Net Trade Intensity” index of the commodity a by country i; P / ‘ is the “Production Intensity” of commodity a by country i;
Y ' is the country i’s GNP; Y ^ is the world’s GNP;
Tl is the net trade of commodity a by country i; Q'a is the country i ’s production of commodity a; and
G’ is country i ’s consumption of commodity a;
(5a is the world’s production volume of commodity a.
Bowen (1986,p.379) claimed that “net trade was chosen to represent comparative advantage” and this implied absolute advantage rather than relative advantage,
Ballance et.al.(1985) questioned the validity of Bowen’s alternative index because the index depended upon the assumptions of identical and homothetic preferences and that countries were identical with respect to factor supplies, technology etc. This last assumption was depicted by the ratio of actual net trade, T^, to expected
production, E{Qa) :
RCA4^^ = n / E { Q i)
where E{Qi) = {Y '/Y '^ )Q :.
Consistency tests of alternative measures of relative comparative advantage (RCA) were conducted. Prior to the consistency tests, Ballance et.al. (1987 p.l57) em phasized that “while RCA may not be precisely measurable, indexes based on real world post-trade observations may reveal the pattern of RCA.” They also noted that researchers when dealing with real trade data should realize problems related to:
1. Magnitude of production, exports, consumption and imports related to coun try size and product significance;
2. Aggregation in the data;
t
3. Government policies that distort trade such that actual trade flows do not
I *
reflect the underlying pattern of comparative advantage.
“Two classes of indexes have been analyzed. These two indexes were first, deter mined by using data on trade and domestic production and consumption; second, based on trade data only” (p.160). It was concluded that it is impossible to iden tify empirically a valid measure of RCA because of the high degree of inconsistency among alternative RCA indexes.
Vollrath (1987, 1989) examined trends of international competitiveness in agri culture. He based his analysis upon the concept of revealed competitive advantage and three global trade intensity measures. These were called as R elativ e T rad e A d v an tag e (R C A 5), R elativ e E x p o rt A d v an tag e (R C A 6) and R e lativ e C o m p etitiv en ess (R C A 7) respectively. These terms were expressed in the fol lowing way: RCA5], = RXA], - R M A \ where, R X A i = ( X U X i) /( X : fX ; J R M A i = [MU M i)! {M U M :) R C A^i = \n{RXA[) RCA7[ = ln(f?AAi) - ln(RMA‘j
R X A i is the relative export advantage of country i on commodity a; R M A \ is the relative import advantage of country i on commodity a;
is the export volume of country i’s on commodity a;
is the export volume of commodity,n, of country i; where n is defined as: n= all traded commodities - commodity a;
X I is the export volume on commodity a by r= world - country i;
is the export volume n by r=world-country i;
M refers to the import volumes.
RCA6 represents the economic interpretation of revealed comparative advantage as being equivalent to deviations of actual from expected trade. A positive RCA5, RCA6, or RCA7 reveals a comparative advantage, while a negative value reveals a comparative disadvantage. These indexes may come closer to measuring true com parative advantage than alternative RCA measures, because they eliminate country and commodity double counting in world trade. These indexes make clear
distinc-f *
tion between a specific commodity and all other commodities and between a specific country and the rest of the world. RCA6 index was also recommended to use in some cases because it is less susceptible to policy-induced distortions than RCA5 or RCA7 (Vollratli and Vo,1990).
f
The measures RCA5 and RCA7 used both export and import data; therefore, embody both the relative demand and relative supply dimensions. Another at traction of these indexes was that RCA5 and RCA7 were consistent with the real world phenomenon of two-way trade. It was also recommended that analyst may use RCA7 instead of RCA5 (at high level of commodity aggregation) because the former balances the supply and demand dimensions of comparative advantage equally.
3.3
R ecen t T h eo retica l D ev elo p m en ts
Webster(1991) argued and gave evidence that RCA measures were giving poor re sults. He also claimed that this poor performance of RCA measures was “not likely to be attributed to problems predominantly associated with measurement itselP (p.937). He also proposed and evaluated another measure as a complement of ex isting techniques.
3.3.1 Aggregate Trade Imbalance
Basic theories of comparative advantage assume trade balance; which means that it reflects equilibrium trade flows and is not influenced by disequilibrium at the macroeconomic level. However, this is not the real case.
Webster suggested to adjust the measure of RCA by taking account of macroe conomic disequilibriums.'* However, he admitted that “there are two fundamental problems with making such adjustments. First, the appropriate macroeconomic equilibrium is not immediately apparent. Second, should we assume that an over all trade imbalance induces an equiproportionate bias in the RCA index for each commodity or would certain activities be disproportionately affected?”(p.938).
An RCA analysis was conducted to assess whether aggregate imbalance were a likely influence on cross-country rankings of RCA. RCA was calculated for each (3 digit) commodity and for each country by using the following formula:
R C A j k = {xjk - m jk )'/{x jk + m jk )
than a simple adjustment for aggregate imbalance was performed in visible trade by using:
RCA'jk = RCAjk - [(Xk - Mk)/{Xk + Mk)]
where RCAjk is the revealed comparative advintage of country k on commodity j;
Xjk refers to the export volume of commodity j of country k; rrijk is the import volume of commodity j of country k; Xk and Mk are county ks total visible exports and imports.
The conclusion was that visible trade imbalance did not appear to have any sig nificant impact on the ranking of countries within the same commodity classification according to RCA.
The review of RCA indexes suggested that for the Hungarian case'Vollrath (1987, 1989) indexes are the most appropriate ones. Also Webster (1991) admitted that RCA measures are “more kind to single country, many commodity study.”
Ideally, low level of aggregated data should be used to construct the RCA indexes; however, the unavailability of such data forced us to use high level of aggregated data. Nevertheless, Webster showed that this practical approach will not result in biased indexes.
''Extensive literature concerning appropriate adjustment of this type see Greenway and Milwell,1986
“it seems unlikely that aggregation difficulties are a systematic source of inconsistency in country study. Thus, on balance we should not expect implicit differences in aggregation to affect ranking of RCA”(p.941).
In the following section the nature of the Hungarian trade in the period, 1975- 88 is analysed trough the comparative advantage method.
4
A n A n alysis o f C om parative A dvantage o f H un
garian E conom y
The objective of this analysis is to examine trends of international competitiveness in foreign trade of Hungary. The analysis is based on the index formulated by Vollrath in 1987. This method is based upon the concept of revealed comparative advan tage and trade intensity measures. This is called as R elativ e C o m p etitiv en ess (R C A 7). This index is expressed in the following way:
RCA7[ = \n{RXA[) - \n{RMAi)where
RXA5i = (x'jxi)/(x:/xi)
R M A i = ( M ‘J M i ) l ( M l l M : )
R X A \ is the relative export axlvantage of country i on commodity a; R M A \ is the relative import advantage of country i on commodity a; X I is the export volume of country i’s on commodity a;
is the export volume of commodity,n, of country i; where n is defined as: n= all traded commodities - commodity a;
X^ is the export volume on commodity a by r= world - country i; X^ is the export volume n by r=world-countr^ i;
M refers to the import volumes.
A p o sitiv e R C A 7 reveals a c o m p arativ e ad v an tag e, w hile a n eg ativ e value reveals a co m p a rativ e d isad v an tag e. This index may come closer to measuring true comparative advantage than alternative RCA measures, because it eliminates country and commodity double counting in world trade. This index makes clear distinction between a specific commodity and all other commodities and between a specific country and the rest of the world.
The measure RCA7 uses both export and import data; therefore, embodyes both the relative demand and relative supply dimensions. Another attraction of this index is that RCA7 is consistent with the real world phenomenon of two-way trade.
4.1 D a ta
The Revealed Comparative Advantage Index (RCA7i) is applied for a sample of 9 Hungarian commodity groups in four different geographical areas and for the period 1975-88. The commodity groups are classified according the CMEA classification,
which is called the CMEA Trade nomenclature (CTN). This nomenclature distin guishes nine categories, which are the following:
• CTNl = Industrial Machinery and Equipment (including transportation ma chinery;
• CTN2 = Fuels, Mineral Raw Materials, Metals; • CTN3 = Chemical, Fertilizers, Rubber;
• CTN4 = Building Materials and Construction Parts;
• CTN5 = Raw Materials of Vegetable and Animal Origin (non-food); • CTN6 = Live Animals (not for slaughter);
• CTN7 = Raw Materials for the Production of Foodstuff; «
• CTN8 = Foodstuff; ·
• CTN9 = Industrial Consumer Goods (other than food).
COMECON Data 1989 handbook reports that in most cases a breakdown into four or five commodity groups only was possible; these are aggregation of the nine original groups. For this study the level of agrégation of nine commodity groups is used.
The four different geographic region are: the socialist countries; the CMEA coun tries; the western industrialized countries and developing countries.® Each commod ity groups’ RCA7i is calculated respect to the total Hungarian trade volume.
4.2
E m p irical R esu lts
Table 1. summarizes Hungary’s revealed comparative advantage in its overall trade of industrial maschinery and equipments(CTN 1), Live Animals (CTN 6), Raw Ma terials for the Production of Foodstuff (CTN 7), Foodstuff (CTN 8) and Industrial
® Socialist co u n tries: this group includes, in addition to the CMEA countries, the Peoples’ Republic of China, Yugoslavia and North Korea
CM EA:Bulgaria, CSSR, GDR, Hungary, Poland, Romania, USSR, Albania, Cuba, Mongolia and Vietnam
I n d u str ia liz e d W est: Canada, USA, Japan, Austria, Belgium-Luxembourg; Denmark; Finland; France; Germany; Italy; Netherlands; Norway; Sweden; Switzerland; United Kingdom
D e v e lo p in g co u n tries
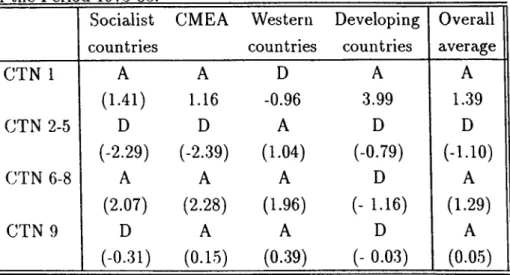
Table 1: Average Revealed Comparative Advantage (RCA7i) of Commodity Groups in the Period 1975-88. CTN 1 CTN 2-5 CTN 6-8 CTN 9
Socialist CMEA Western Developing
countries countries countries
A (1.41) D (-2.29) A (2.07) D (-0..31) A 1.16 D (-2.39) A (2.28) A (0.15) D -0.96 A (1.04) A (1.96) A (0.39) A 3.99 D (-0.79) D (- 1.16) D (- 0.03) Overall average A 1.39 D (-1.10) A (1.29) A (0.05)
Consumer Goods (CTN 9). The commodity groups of Fuels, Mineral Raw Mate rials, Metals(CTN 2), Chemiciil, Fertilizers, Rubber(CTN 3), Raw Materials and Construction Parts (CTN 4) and Raw Materials for the Production of Foodstuff (CTN 5) revealed disadvantage in the total trade. This general results suggest that Hungary revealed comparative advantage not only in labor intensive goods such as food products (CTN 6-8) but also in capital Intensive products such as industrial maschinery and industrial consumer goods (CTN 1 and 9 respectively). Even though Hungary was not rich in capital but the agreement made during the 1975s required that the country would focus and specialize in capital intensive products. The re sources for these goods were provided by CMEA countries for a price set among such countries.
In the same time, this situation allowed for Hungary to use CMEA cheaper energy to produce high quality goods at lower prices which made it possible to export in the world market. ®
The Table 1. also gives information about the relative position of each commod ity group in a specific geographic area. Hungary revealed comparative advantage in commodity groups such as indusirial maschinery and equipment (CTN l) and Live Animals (CTN 6), Raw Materials for the Production of Foodstuff (CTN 7),
Food-®CTN 1; Industrial Machinery and Equipment
CTN 2-5: Fuels, Mineral Raw Materials, Metals, Chemical, Fertilizers, Rubber, Building Materials and Construction Parts, Raw Materials of Vegetable and Animal Origin (non-food);
CTN 6-8: Live Animals, Raw Materials for the Production of Foodstuff, Foodstuff; CTN 9: Industrial Consumer Goods (other than food).
stuff (CTN 8) and Industrial Consumer in both the Socialist and CMEA countries. This confirms the situation set by the CMEA agreement on production specification. In the Western countries, Hungary could reveal comparative advantage not only in commodity groups such as: Fuels, Mineral Raw Materials, Metals(CTN 2), Chem ical, Fertilizers, Rubber(CTN 3), Raw Materials and Construction Parts (CTN 4) and Raw Materials for the Production of Foodstuff (CTN 5) food stuff (CTN 2- 5) but also in commodity groups such as CTN 6-8 and industrial consumer goods (CTN 9).
Hungary’s competitiveness in these products could be explained by: first, its ability to use cheaper energy and raw material with respect to the western coun tries; second, Hungary had always a strong agriculture which let the country to be competitive in foodstuff (CTN 6- 8). In the average, Hungary revealed comparative advantage only in commodity group CTN 1 in the developing countries. This could be explained by the fact that developing countries being poor in capital are special ized in labor intensive production. Consequently, developing countries demand for capital intensive products is greater than labor intensife products because of luck of capital and technology. These countries suppley of labor intensive products is high, therefore their demand of agricultural products is low. As a result, Hungary can not reveale comparative advantage in such pi'oducts in the trade with developing countries.
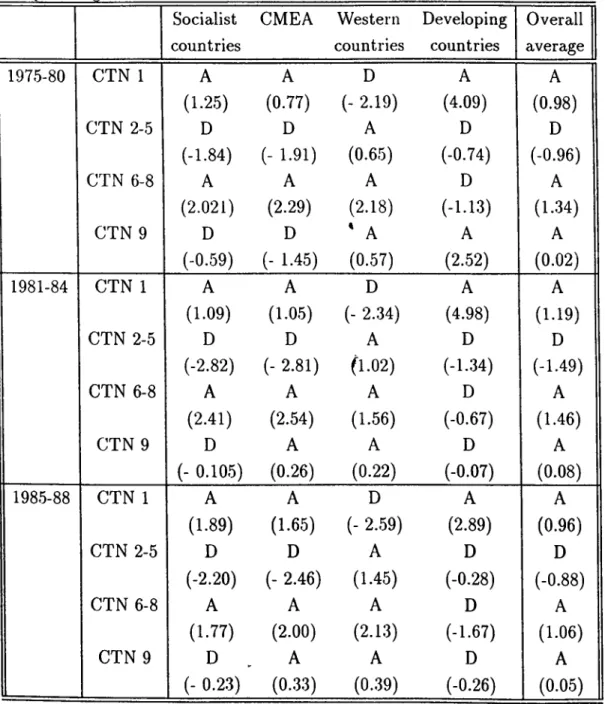
The results, were also analyzed according the periodical change occurring in the reform process. More specifically, the 1975-88 period was divided in three period which were:
• 1975-80 Period of Centralization; • 1981-84 Period of Decentralization; • 1985-88 Period of Stagnation.
The averages of each commodity groups for each period were reported in Table
2. The overall average indicates that in the 1975-88 period Hungary revealed com parative advantage in all the commodity groups except in the trade of commodity groups of Fuels, Mineral Raw Materials, Metals(CTN 2), Chemical, Fertilizers, Rub- ber(CTN 3), Raw Materials and Construction Parts (CTN 4) and Raw Materials for the Production of Foodstuff (CTN 5) The direction of comparative advantage with the socialist and CMEA countries was the same all through the period of anal yses exept for the commodity group of industrial consumer groups (CTN 9). This
commodity group revealed comparative disadvantage in the 1975-80 period than revealed comparative advantage in the following periods (1981-88). This might due to the increased trade level of Hungary within the CMEA trade. Consequently, the CMEA countries imported this commodity groups from Hungary becouse Hungary was the country specialized in such production under the CMEA agreement. Which meant a comparative advantage in commodity groups of industrial machinery and industrial raw material. In the trade with western countries only the commodity group of industrial machinery revealed disadvantage and in the case of developing countries this commodity group revealed comparative advantage. The compara tive disadvantage revealed in the trade with the western countries is in agreement with the international trade characteristics. Western countries are characterized by a capital intensive production. Their production is organized according the latest technology; consequently, their product prices are low. Even though Hungary re ceived cheap raw material and energy for production from CMEA, the production was not according the technological developm«nts prevailing in the western produc tion. As a result, Hungary could not pi’oduce at the same level of efficiency as the western industries. This condition negatively effected the comparative axivantage of such goods.
In the trade with the developing countries, Hungary lost her comparative ad vantage with the commodity group of industrial equipment and machinery. This is associated with the decreased demand from the developing countries because of their effort to industrialize in the production of similar commodity groups.
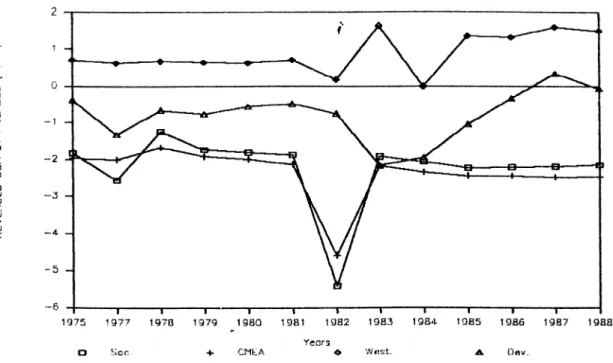
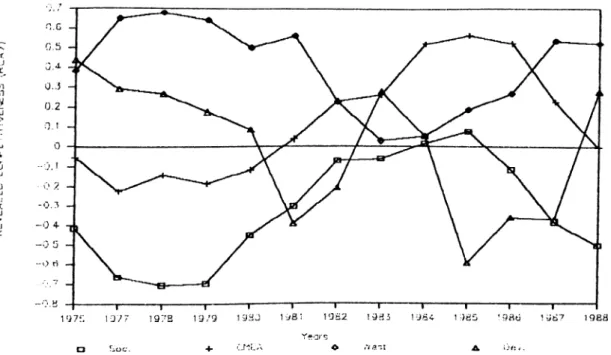
The yearly development of RCA7 index for each commodity group is also reported in Fig.6,7,8, and 9. In Figure 6. the commodity group of industrial machinery and equipment revealed comparative advantage in d ex ’s pattern during the 1975-88 period was plotted. This figure gives a clear idea about CTN I ’s position in the four geographic areas (Socialist countries, CMEA, Western countries and Developing countries). The CTN 1 commodity group revealed comparative disadvantage all through this period in the western countries.
CTN 1 revealed always comparative advantage in both the Socialist countries and CMEA. The RCA7 index’s pattern in this two geographic areas followed almost a parallel pattern. In the developing countries, CTN 1 always revealed comparative advantage. Its pattern was declining in the first period of time which continued to increase between 1979-1982. However, RCA7 declined after 1982. This peri odical change may be due: first to the oil crises occurring in 1973; second to the industrialization effort initiated in the 1980s by the developing countries.
Table 2: Average Revealed Comparative Advantage (RCA7) of all Commodity Socialist countries CMEA Western countries Developing countries Overall average 1975-80 CTN 1 A A D A A (1.25) (0.77) (- 2.19) (4.09) (0.98) CTN 2-5 D D A D D (-1.84) (- 1.91) (0.65) (-0.74) (-0.96) CTN 6-8 A A A D A (2.021) (2.29) (2.18) (-1.13) (1.34) CTN 9 D D ' A A A (-0.59) (- 1.45) (0.57) (2.52) (0.02) 1981-84 CTN 1 A A D A A (1.09) (1.05) (- 2.34) (4.98) (1.19) CTN 2-5 D D A D D (-2.82) (- 2.81) fl.02) (-1.34) (-1.49) CTN 6-8 A A A D A (2.41) (2.54) (1.56) (-0.67) (1.46) CTN 9 D A A D A (- 0.105) (0.26) (0.22) (-0.07) (0.08) 1985-88 CTN 1 A A D A A (1.89) (1.65) (- 2.59) (2.89) (0.96) CTN 2-5 D D A D D (-2.20) (- 2.46) (1.45) (-0.28) (-0.88) CTN 6-8 A A A D A (1.77) (2.00) (2.13) (-1.67) (1.06) CTN 9 D A A D A (- 0.23) (0.33) (0.39) (-0.26) (0.05) 28
a s'oc. -4- C M L A Yecr^o 'M e . ' i l .
Figure 6: Revealed Comparative Advantage (RCA7) of Commodity Group CTN 1
a <Y. in a a Ida: CMtA
Figure 7: Revealed Comparative Advantage(RCA7) of Commodity Group CTN 2-5
a K>Of;.
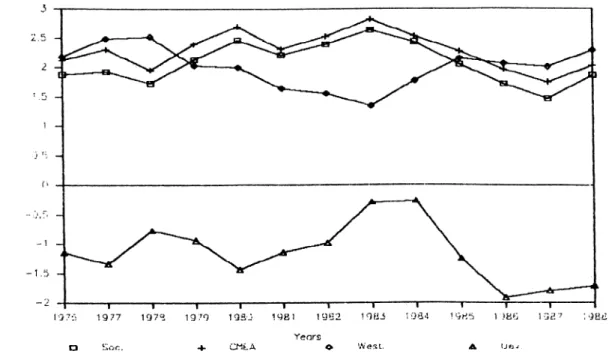
Figure 8: Revealed Comparative Advantage(RCA7) of Commodity Group CTN 6-8 Figure 7. also confirms the result of the previous Tables (1 and 2) such as that the commodity group CTN 2-5 revealed comparative advantage only in the trade with western countries. In the other geographic areas, this commodity group revealed always a comparative disadvantage. The decline occurring in 1982 in both the Socialist countries and C‘CMEA could be associated with the price policy changes occurring in the same period. Hungary after 1980s adjusted its prices every year according the world rate. This adjustment occfhrred every five years prior to 1980.
Figure 8. depicts the trend that the commodity group CTN 6-8 revealed during the 1975-88 period in the four geographic areas. These commodity groups revealed comparative advantage in the Socialist countries, CMEA and Western countries. But they revealed comparative disadvantage in the developing countries. This dis advantage was due to the fact that the demand of developing countries for food commodities was lower than for industrial goods. The developing countries were able to produce and be self sufficient in labor intensive products.
The revealed comparative advantage’s declined in the western countries in the period 1981-83 was due to the effect of recession. The decrease in comparative disadvantage of Hungary in the trade of CTN 6-8 in the developing countries in the period of 1982-85 is associated with the period of industrialization of such countries. Which made them to shift their capital towards industry, consequently their demand for agricultural products increased.
Figure 9. indicates the development of RCA7 of commodity group of industrial consumer groups in the four geographical regions. In both the Socialist countries
Figure 9: Revealed Comparative Advantage(RCA7) of Commodity Group CTN 9 and CMEA this commodity group revealed* comparative disadvantage in the 1975- 80 period. The disadvantage shifted to advantage between 1981-1984 than declined again. This improvement in advantage was due to the increased demand of such countries for industrial commodity groups. The decline was caused by the economic decline prevailed in these countries.
The industrial commodity groups revealed comparative advantage in the western countries except in the period of 1980- 83 which was effected by the recession pre vailed in these countries in the same period of time. Similar pattern occurred in the developing countries.