THE DYNAMICS OF MULTIDIMENSIONAL POVERTY
IN TURKEY
BETAM WORKING PAPER SERIES #014
OCTOBER 2014
The Dynamics of Multidimensional Poverty in Turkey
Ayşenur Acar Abstract
Over the past 20 years, poverty has conceived as a multidimensional issue, not only one-dimensional issue based on conventional indicators (i.e., income or expenditure). While a relatively huge literature has focused on the dynamic analysis of one-dimensional poverty, little attentionhas beengivento the dynamics of multidimensional poverty. Using a panel data drawn from the Survey of Income and Living Conditions (SILC) in the years 2007-2010, this study focuses on the dynamics of multidimensional poverty in Turkey. The purposes of the study are twofold: the first is to identify "poor" in Turkey by proposing a multidimensional poverty measure that incorporates various dimensions closely related to the well-being of individuals (such as labor market, housing, health and living standards), and the second is to investigate how the new measure differs from other existing poverty measures (i.e., income poverty and EU material deprivation) by using random effect probit model. The findings show that the new measure is partially consistent with the other measures and multidimensional poverty decreased during the period under examination. Empirical work reveals that higher years of schooling, homeownership or being a rental/asset income recipient decreases the probability of being multidimensionally poor, while large household size, attachment to agricultural employment or being a social welfare income recipient increases the probability of being multidimensionally poor.
1. Introduction and Background
Since the problem of poverty and the poverty reduction strategies are the essential themes of international development efforts, a vast of literature has focused on the poverty phenomenon. Specifically, two issues are at the heart of the poverty literature: to measure "poverty" and to identify the "poor". Despite the literature, there is no consensus on the measurement of poverty or identification of the poor.
Ayşenur Acar, PhD, Research Assistant, Bahcesehir University Center for Economic and Social Research, [email protected]. I would like to thank Seyfettin Gürsel, Bülent Anıl, Cem Başlevent, Uğur Özdemir, participants and lecturers of summer school on multidimensional poverty offered by Oxford Poverty and Human Development Initiative (OPHI) for their valuable comments. All remaining errors are my own.
Conventional measures of poverty are based on money-metric indicators (i.e. household income or expenditure). In this approach, poverty lines are commonly used to solve the identification problems, which are the thresholds below which individuals are considered poor and above which they are considered non-poor. Basically, two kinds of the poverty lines are used: Absolute poverty and relative poverty line.
The absolute poverty line is set at a certain absolute standard of what households should be able to count on in order to meet their basic needs. They are often based on estimates of the cost of basic food needs or food energy intake method. In the first method, the cost of a bundle of basic consumption needs is estimated. In the second method, the food expenditure that is necessary to attain recommended food energy intake is calculated. The most important issue with this approach is the identification of the indicators what constitutes basic needs or food bundle since indicators that are used can vary across individuals, regions or dates (Bidani and Ravallion, 1993).1In order to overcome this difficulty with the absolute
poverty lines, relative poverty lines have been used, which are usually set at a percentage of median/mean equivalent household disposable income or mean consumption. According to the EU methodology, which is the most used one worldwide, individuals are assumed to be "at-risk-of poverty", if they are falling below 60 percent of median equivalent household disposable income. Relative income poverty concept is indeed a measure of income inequality and implies that a decline in poverty rate corresponds to an improvement in income inequality in the bottom of the income distribution. On the other hand, since it is insensitive to overall well-being, for instance, if income levels of the individuals are doubled in a given country, poverty might not change. That said, relative poverty lines do not accurately provide the opportunity for cross-country or over time comparisons as they do not represent the same welfare level. It can be said that absolute lines are mostly used in developing countries, while relative lines are dominated in developed countries (Ravallion, 2012). Undoubtedly, money makes cross-country comparison in poverty analysis an easier task since it is assumed to be translated into affording the other needs and is also universally convertible asset. Therefore, money-metric measures are frequently-used despite its certain theoretical and methodological shortcomings.
1Although the absolute poverty lines mostly might not provide the relevant information regarding the poor in
rich countries, they make cross-country or over time comparisons between poverty rates of different countries easier. For instance, the World Bank still uses national absolute poverty lines, which are certain amount of the $/day poverty lines.
Ringen (1988) indicates that income is recently supposed to be not always a good measure for well-being analysis since it disregards command over certain resources (such as non-cash transfers from the government, support from family and friends, etc.). Households can also borrow certain consumption goods or past investments in housing and durables cannot always reflect the current household income. Even though individuals are observed with the same income level at a point in time, living standards of them may differ. Moreover, people are more likely to underreport income that they obtained (it is also collected for the previous calendar year), which will lead to measurement errors and is misleading for policy purposes. In addition, no one indicator alone can accurately capture the multiple aspects of the poverty issue, so using monetary measures to identify the poor might not be a sufficient way to analyze living conditions of individuals. On the other hand, there have been studies on low overlapping ratio between income poor and materially deprived individuals (Whelan et al., 2004; Perry, 2002). Such findings in the literature imply that different poverty measures might identify dissimilar individuals as poor, which might lead to recommend misleading diagnosis for poverty reduction policies and strategies. All things considered, the measurement of poverty has begun to shift from a one-dimensional to a multidimensional framework. Therefore, over the past 20 years understanding of poverty and its measurement have changed thanks to the pioneering studies of Townsend (1979) on deprivation approach and Sen (1985) on capability approach.2Extending research in this area have documented (e.g. Sen, 2000;
Tsui, 2002; Atkinson, 2003; Bourguignon and Chakravarty, 2003 and Alkire and Foster; 2011).
Multidimensional poverty literature defines poverty as a state that reflects insufficiency or failure in various dimensions. The identification of the multidimensional poor is mainly based on two broad frameworks: Axiomatic and non-axiomatic. Axiomatic framework was proposed by Chakravarty et al. (1998) and many studies have followed (Bourguignon and Chakravarty, 2003; Bossert et al., 2009; and Alkire and Foster, 2007, 2011; Ataguba et al., 2011). In the framework, individuals possess vector of a number of traits related to various domains of human life. In order to measure multidimensional poverty, it is needed to check whether the individual has minimally acceptable levels that represent cut-offs. If the individual is below the cut-off of the dimension, s/he is assumed as poor in that
2The core concept of capability approach is to assess individuals’ welfare in terms of their functioning and
capabilities (beings and doings). Functionings are defined as the achieved states of being and activities of an individual (such as being healthy, being intelligent, being well nurtured etc.) while capabilities are defined as the set of potentially achievable functionings of an individual (Kuklys, 2005).
dimension. It can be said that the individual is experiencing a functioning failure, and poverty is an increasing function of the failures. The indicators that can be different scale or magnitude are standardized at a threshold value, which is the main advantage of the method. The main disadvantage is the arbitrariness in choosing of poverty cut-offs (Asselin, 2002; Dekkers, 2003). It should be noted that the most important point of the poverty measurement discussion is to recognize a certain amount of arbitrariness that is unavoidable in defining any poverty line practice (Ravallion, 1992).3
Beyond the measurement issues briefly criticized above, the standard poverty literature (either one-dimensional or multidimensional) have frequently analyzed poverty as a static and timeless state. However, poverty is a state evolving over time and mostly depends on experienced histories (Calvo and Dercon, 2007; Hoy and Zheng, 2011). Various studies have focused on the dynamic analysis of the monetary measurement of poverty (e.g. Calvo and Dercon, 2007, 2009; Hoy and Zheng, 2011; Gradin et al. 2011). As expected, literature on the dynamic analysis of multidimensional poverty is comparatively limited. This study focuses on the dynamic characteristics of the multidimensionality of poverty issue in Turkey by using panel data drawn from SILC that covers the years between 2007 and 2010. The purposes of the study are twofold: (i) to identify the "multidimensional poor" in Turkey by proposing a new multidimensional poverty measure and (ii) is to investigate how the new measure differentiates from existing poverty measures (such as income poverty and material deprivation). The study contributes to the literature by proposing a multidimensional poverty measure for an upper-middle income country. Also, it makes another contribution to the literature by dynamically analyzing how the new measure differentiates from the existing measures of poverty.
The rest of the study is organized as follows: Section 2 is devoted to the identification strategy and data. Section 3 explains estimation methodology and discusses the econometric results. Finally, Section 4 concludes the study summing up the findings. Additional tables are presented in the Appendix.
3The studies using non-axiomatic methods can be classified into 4 groups (Batana, 2008): those that focus on the
fuzzy set approach (e.g. Szeles, 2004; Deutsch and Silber, 2005; Betti and Verma, 2008; Belhadj and Limam, 2012), those that focus on the distance function method (e.g. Deutsch and Silber, 2005), those that focus on information theory (e.g. Maasoumi and Lugo, 2008) and those that focus on the statistical methods. The most common statistical methods are factor analysis (e.g. Nolan and Whelan, 1996), principal component analysis (e.g. Maasoumi and Nickelsburg, 1988), cluster analysis (e.g. Ferro-Luzzi et al., 2006), multiple correspondence analysis (e.g. Notten, 2008), Multiple Indicators Multiple Causes (MIMIC) model and latent class analysis (e.g. Moisio, 2004; Perez-Mayo, 2005).
2. Identification and Data
The study employs a panel data obtained from SILC that covers the years 2007-2010. SILC provides a set of variables related to the characteristics of households and individuals (such as labor market status, health, living standard, income) that make a multidimensional poverty analysis possible. Before moving on to the description of our methodology, we briefly discuss three prominent measures of poverty: Monetary poverty, EU severe material deprivation and Alkire-Foster multidimensional poverty measure. After this brief discussion, we introduce our multidimensional poverty measure for Turkey.
In accordance with the EU methodology, we set the relative income poverty line as the 60 percent of median equivalent household income at national level.4Then, the equivalent
household disposable income is calculated by dividing household disposable income to this weight that is the sum of the given weights of the individuals in the household. As we indicated before, relative income poverty concept is an income inequality concept; hence it is inefficient measure for poverty phenomenon.
In EU material deprivation methodology, people are supposed to be threatened by “severe material deprivation”, if they cannot afford at least 4 items out of 9 (EU Social Protection Committee, 2009).5 Even though EU material deprivation measure is a
well-defined and less complex identification method, it does not give an accurate picture of poverty, especially for many other developing countries or middle income countries and like Turkey. Official EU severe material deprivation rate in Turkey is 66.6 percent in 2010, implying that more than half of the population is assumed as poor. Obviously, the method overestimates the poverty rate in Turkey. On the other hand, the methodology does not include indicators as to health or labor market dimensions that are assumed closely related to poverty statuses of individuals, which we underlined in the background section of the study.
4Household net annual disposable income is calculated as the total of individual income of all members of the
household (total of the in cash or in kind income such as salary-wage, daily wage, enterprises income, pension, widowed-orphan salary, old-age salary, unpaid grants, etc.), plus the total of yearly income for the household (such as real property income, unreturned benefits, incomes gained by household members less than age 15, etc.), and minus the taxes paid during the reference period of income and regular transfers to the other households or persons. In order to calculate the equivalent household disposable income, we use modified OECD scale which gives a weight of 1 to the reference person in the household, 0.5 to other household members aged 14 and over, and 0.3 to each child aged less than 15.
5(i) To pay rent, mortgage, other loans and utility bills, (ii) to keep their home adequately warm, (iii) to face
unexpected expenses, (iv) to eat meat (or another adequate source of proteins) regularly, (v) to go on holiday, (vi) audio-video equipment (orig. ‘TV set’), (vii) a washing machine, (viii) a car, (ix) a phone (regular or GSM). For a discussion on the indicators and the choice of the cut-off see Guio et al., 2009 and Guio, 2009.
On the other hand, in 2010, a research team from Oxford Poverty and Human Development Initiative (OPHI) proposed a global measure to identify the multidimensional poor, which is named as Global Multidimensional Poverty Index (MPI).6 Despite certain problems with indicators of the index, it provides a comprehensive starting point for identification of the multidimensional poor.7 Given the indicators that constitute the multidimensional measure, it is an appropriate method for underdeveloped countries rather than middle-income or upper middle-income countries.
Logically, a poverty measure for a given society might not provide relevant information in relation to the issue of poverty in another country, and therefore, like many other topics of economics, the famous statement “one size fits all” is not valid for the identification of the poor as well, i.e. one measure of poverty worldwide. Considering the economic and demographic structure of Turkey; these existing measures do not provide relevant information about the poor and the poverty issue in Turkey. Hence, it is needed to develop a multidimensional measure. Building upon the Global MPI, we propose a multidimensional poverty measure for Turkey.
6The measure includes 10 indicators at household level that are grouped into 3 dimensions: “living standards”,
“health” and “education”. Health dimension is measured by using 2 indicators: nutrition (if any adult or child in the family is malnourished) and child mortality (if any child has died in the family). Education dimension has 2 indicators: years of schooling (if no household member has completed 5 years of schooling) and child enrolment (if any school-aged child is out of school in years 1 to 8). Living standards dimension has 6 indicators: cooking fuel (if they cook with wood, charcoal, or dung), sanitation (if does not meet Millennium Development Goal-MDG definitions, or the toilet is shared), drinking water (if does not meet Goal-MDG definitions, or is more than 30 minutes walk), electricity (if household does not have electricity), flooring (if the floor is dirt, sand, or dung) and assets (if do not own more than one of: radio, TV, telephone, bike, motorbike or refrigerator and do not possess a car or truck) (Alkire and Santos, 2010). Each of those dimensions is treated as equally important, called as equal weighting. Total weight of the dimensions is equal to 1, implying that each dimension is assigned with 1/3 weight. The indicators are also equally weighted, implying that the dimension weight is divided by the number of indicators in that dimension. The cut-off of the identification of the multidimensional poor is set as 30 percent of weighted 10 indicators.
7 For instance, using only two indicators (child mortality and nutrition) would not accurately measure
deprivation in health. A household member could have a limitation in daily and professional activities that precludes involving in labor market, which probably will influence well-being of individuals. On the other hand, since rates of possession of radio, TV, telephone are quite high in Turkey, the indicators (such as possessions radio, TV, telephone, bike, motorbike, car or tractor) are not appropriate for the concept of poverty in Turkey. Also, the indicators with regard to housing conditions are more appropriate for underdeveloped countries rather than middle-income or upper middle-income countries (such as dirt, sand, or dung flooring). Another problem with the measure is the utilization of education as an indicator. Education status could be assumed a determinant of poverty rather than its indicator. It slowly changes one year to another for adults, and therefore, is not sensitive to short term fluctuations and policy changes. For instance, if you are 30 years old and university graduated, you will not be deprived in the next 20 years. Decision on including an education indicators (such as years of schooling, child school enrollment etc.) depends on what the purpose of the multidimensional poverty measure is. If you design the measure to implement national development plan of the country, education indicator would be reasonable. Finally, the measure disregards labor market dimension.
-A Multidimensional Poverty Measure for Turkey
Considering the demographic and economic structure in Turkey and using Polychoric Principal Component Analysis (PCA), we choose 15 indicators in order to identify the multidimensional poor.8 In order to measure health statuses of individuals, we have two indicators: living in a household with at least one individual who has a chronicle health problem or living in a household with at least one individual who experiences a limitation of daily activities due to a health problem. Labor market status could be measured by using two indicators: individuals are living in a household with at least one unemployed individual or informally employed individual.9In Turkey, informality is a still one of the major problems in
the labor market. According to the official labor market series released by TurkStat, the share of total informal worker in total employment is 36.7 percent in 2013. Informality and poverty can be regarded as correlated phenomena since informal jobs could lead to lower wages and thus poverty (Devicienti et al., 2009).
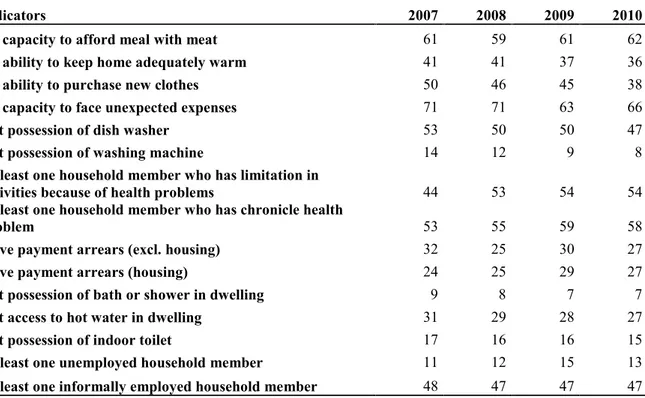
Four indicators that we choose (to keep their home adequately warm, to face unexpected expenses, to eat meat -or another adequate source of proteins- regularly and washing machine) are the same indicators those which constitute EU severe material deprivation measure. All the reasons criticized in the previous sub-section, we replace the indicators “to pay rent, mortgage, other loans and utility bills, to go on holiday, audio-video equipment (orig. ‘TV set’) and a car” with “ability to purchase clothes and possession of a dish washer”. The percentage of individuals who are not able to afford to purchase new clothes is 38 percent, while the percentage of those who do not possess a dish washer is 47 percent in 2010. We also choose possession of indoor toilet as a multidimensional poverty indicator (the percentage of those who do not possess indoor toilet is 16 percent in 2010). In addition, 4 indicators, which are payment arrears (excl. housing), payment arrears (housing), not possession bath or shower in dwelling, and not access hot water in dwelling, are considered in terms of housing conditions of individuals. The percentage of individuals who do not possess bath or shower in dwelling is 7 percent, those who do not have hot water in
8The survey distinguishes the reason of lacking an item, whether it is based on a “preference” or based on
“inability to pay”. We only focus on the “inability to pay”, in order to capture deprivations of individuals accurately. On the other hand, a correlation of 0.30 may be considered moderate (Weinberg and Abramowitz, 2002); so we choose indicators with correlations greater than 0.30. In addition, we pursue a reliability analysis to the indicators. App 1 shows Cronbach's alpha reliability coefficients and the reliability level could be assumed fairly satisfactory (0.78).
9Permanency status of the job can be seen one of indicators that show labor market status. Approximately 85
percent of individuals who are employed in permanent jobs are also informally working in the sample, and therefore, it is closely related to informality and we do not include it.
dwelling is 27 percent, those who face payment arrears excluding housing is 27 percent and those who face payment arrears related to housing is 27 percent in 2010 (Table 1).
Table 1: Deprivation in each indicator (%)
Indicators 2007 2008 2009 2010
No capacity to afford meal with meat 61 59 61 62
No ability to keep home adequately warm 41 41 37 36
No ability to purchase new clothes 50 46 45 38
No capacity to face unexpected expenses 71 71 63 66
Not possession of dish washer 53 50 50 47
Not possession of washing machine 14 12 9 8
At least one household member who has limitation in
activities because of health problems 44 53 54 54
At least one household member who has chronicle health
problem 53 55 59 58
Have payment arrears (excl. housing) 32 25 30 27
Have payment arrears (housing) 24 25 29 27
Not possession of bath or shower in dwelling 9 8 7 7
Not access to hot water in dwelling 31 29 28 27
Not possession of indoor toilet 17 16 16 15
At least one unemployed household member 11 12 15 13
At least one informally employed household member 48 47 47 47
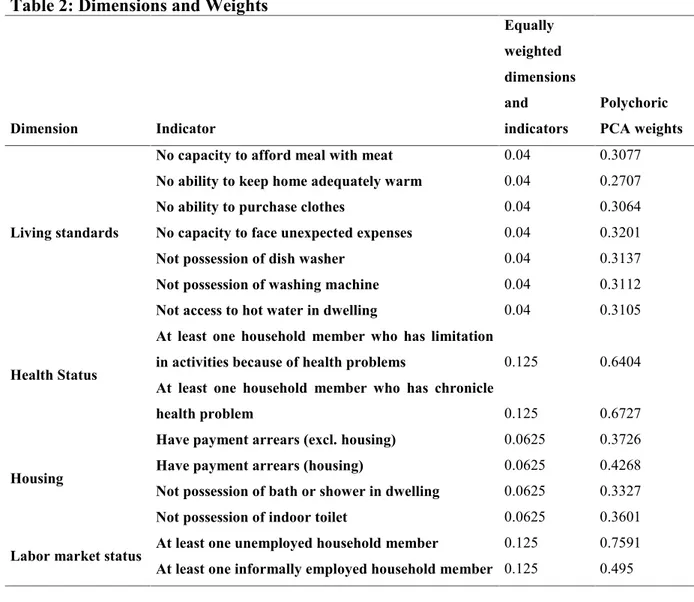
There is no agreed process to determine which indicator belongs to which dimension in the identification of the poor. It can be based on international consensus, personal expertise, human rights, empirical evidence or statistical methods (Alkire and Santos, 2009, 2013; Battiston et al., 2013). Following the works of Dekkers (2003) and Coromaldi and Zoli, (2012), we use polychoric PCA in grouping of the indicators. The results show that the indicators should be grouped into 4 dimensions (For the results see App 2). On the other hand, weighting indicators/dimensions is another important stage of identification of the multidimensional poor.10 We consider three different weighting methods and compare the
results. In our benchmark scheme, we equally weight the indicators. In the first scheme; first, the dimensions are equally weighted, and then indicators are equally weighted, which is in line with the Alkire-Foster methodology. In the second scheme, indicators are weighted with
10 There are broadly three weighting systems that are mostly used in the literature: Data-driven weights
(frequency, statistical and most-favorable); Hybrid weights (self-stated and hedonic) and Normative weights (equal or arbitrary, expert opinion, price based) (Decanq and Lugo, 2013). Equal weighting is a method that is widely used in the literature (Alkire and Foster, 2007, 2011). It implies that the dimensions are treated as equally important. Even though the results can be simply interpreted in this weighting scheme, the main problem is to assume that there is no discrimination about dimensions or items. However, it can be thought as a benchmark method (Guio et al., 2009; Nicholas and Ray, 2012, Battiston et. al, 2013).
the factor loadings (weights) of polychoric PCA analysis. The dimensions and the weights are presented in Table 2.
Table 2: Dimensions and Weights
Dimension Indicator Equally weighted dimensions and indicators Polychoric PCA weights Living standards
No capacity to afford meal with meat 0.04 0.3077
No ability to keep home adequately warm 0.04 0.2707
No ability to purchase clothes 0.04 0.3064
No capacity to face unexpected expenses 0.04 0.3201
Not possession of dish washer 0.04 0.3137
Not possession of washing machine 0.04 0.3112
Not access to hot water in dwelling 0.04 0.3105
Health Status
At least one household member who has limitation
in activities because of health problems 0.125 0.6404
At least one household member who has chronicle
health problem 0.125 0.6727
Housing
Have payment arrears (excl. housing) 0.0625 0.3726
Have payment arrears (housing) 0.0625 0.4268
Not possession of bath or shower in dwelling 0.0625 0.3327
Not possession of indoor toilet 0.0625 0.3601
Labor market status At least one unemployed household member 0.125 0.7591
At least one informally employed household member 0.125 0.495
The another crucial step for the identification is the choice of appropriate cut-off in order to determine how many deprivations should be experienced to be considered as a “multidimensional poor”. Even though the intermediate method is more reasonable, we do not decide any de facto cut-off since there is no an agreed principle to set the cut-offs. Instead, we make a robustness analysis by using possible cut-offs.11
11The cut-off that is used in the benchmark model is just above the mean deprivation. Since the mean deprivation
is 5.5, the cut-off varies from being deprived in 6 indicators to 9 indicators out of 15. It is noteworthy that being deprived in 9 or over is fairly marginal. The cut-offs that are used in the second and the third weighting schemes are the percentage of the maximum total weight. For instance, maximum total weight can equal to 1 in the second weighting scheme. The first cut-off is the 20 percent of 1 (i.e. 0.20), the second cut-off is 30 percent of 1 (i.e. 0.30), and so on.
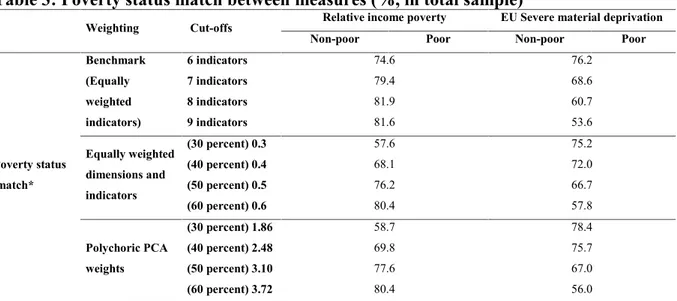
In order to understand how the new measure differentiates from the other existing measures, Table 3 presents poverty status match (i.e. overlapping ratio) between our measures and relative income poverty. According to the results, we observe fairly high overlapping ratios (varies from 53 percent to 82 percent). However, we find that when we increase the cut-off, the overlapping ratios increase as well. Contrary to this finding, the overlapping between multidimensional poverty and EU severe material deprivation decreases, when we increase the cut-off for multidimensional poverty.
Table 3: Poverty status match between measures (%, in total sample)
Weighting Cut-offs Relative income poverty EU Severe material deprivation
Non-poor Poor Non-poor Poor
Poverty status match* Benchmark (Equally weighted indicators) 6 indicators 74.6 76.2 7 indicators 79.4 68.6 8 indicators 81.9 60.7 9 indicators 81.6 53.6 Equally weighted dimensions and indicators (30 percent) 0.3 57.6 75.2 (40 percent) 0.4 68.1 72.0 (50 percent) 0.5 76.2 66.7 (60 percent) 0.6 80.4 57.8 Polychoric PCA weights (30 percent) 1.86 58.7 78.4 (40 percent) 2.48 69.8 75.7 (50 percent) 3.10 77.6 67.0 (60 percent) 3.72 80.4 56.0
*Poverty statuses match denotes the sum of the percentages of the non-poor and poor individuals in total population according the two measures.
**In the benchmark model, for instance, the cut-off of "6 indicators" means being deprived at least 6 indicators out of 15. *** A more detailed information regarding the table could be found in App 3.
Table 4 reports poverty headcount rates. During the period, relative income poverty declined from 25.2 percent to 22.5 percent, while EU severe material deprivation slightly increased from 59.0 percent to 59.3 percent. As for the findings with respect to the multidimensional poverty, the rates obtained from the benchmark model are the lowest ones, while the rates obtained from the second are lower than those obtained from the first. However, multidimensional poverty decreased for all cut-offs and weightings, we observe that multidimensional poverty slightly increased according to the cut-off 20 percent (from 60 percent to 61.2 percent), but it decreased for the other cut-offs. It is noteworthy that decline in multidimensional poverty rates obtained from the benchmark are higher than those obtained from the first and second weighting schemes. On the other hand, when the weights obtained from polychoric PCA (i.e. the second weighting scheme) are used, we find similar patterns compared to those that are obtained by equal weighting scheme.
Table 4: Poverty headcount rates (%) 2007 2008 2009 2010 Income poor 25.2 23.6 24.5 22.5 EU Severe material deprivation 59.0 58.6 57.7 59.3 Multidimensional Poverty Benchmark (Equally weighted indicators) 6 indicators 41.2 39.6 39.3 36.3 7 indicators 32.2 28.7 29.4 26.5 8 indicators 23.1 19.6 20.4 18.2 9 indicators 15.3 12.2 12.7 11.0 Equally weighted dimensions and indicators (30 percent) 0.3 60.0 61.2 63.2 61.2 (40 percent) 0.4 45.6 46.3 47.5 45.2 (50 percent) 0.5 31.6 30.7 31.6 29.4 (60 percent) 0.6 18.7 17.8 18.6 17.1 Polychoric PCA weights (30 percent) 1.86 59.8 60.3 61.4 59.6 (40 percent) 2.48 44.5 44.3 45.1 42.2 (50 percent) 3.10 30.1 28.6 29.5 26.8 (60 percent) 3.72 16.4 14.9 16.0 14.2
These findings indicate that poverty rates change when a different weighting scheme used. The weighting only matters in terms of levels of the rates, so the trend does not change. However, the point is to analyze the poverty as comprehensive as possible rather than to declare a poverty rate. Hence, it is important to analyze whether determinants of multidimensional poverty change when different weightings and cut-offs are used. The next section analyzes this question. Robustness checks are done but we only report the empirical results of the benchmark model. The other results obtained from the first and the second weighting methods are presented in footnotes and Appendix. On the other hand, the results do not remarkably change when one used balanced panel data of SILC for the same period. 3. Empirical Methodology and Results
We estimate a series of random effect probit models, where each dependent variable denotes poverty statuses of individuals (1=poor (deprived), 0=non-poor (non-deprived)) calculated by all the measures at the possible cut-offs. We use a set of variables that captures individual characteristics (such as age, gender, marital status and years of schooling), household characteristics (such as the household size, number of children and the ratio of the number of worker employed in agricultural sectors to the number of worker in the household) and dummy variables that indicate whether households are home owners or recipients of
labor, entrepreneurial, rental/ asset income, retirement income and social welfare income.12It
is noteworthy that income data in SILC is collected for the preceding calendar year, i.e. income data is provided with a time lag in the survey. On the contrary, other variables (such as variables related to living standards, health status etc.) are collected for the survey year. This reveals a time mismatch between income data and the others. A time adjustment could be a better way in order to analyze the determinants of multidimensional poverty. However, income types received by the household in the preceding year might be more explanatory for the understanding current multidimensional poverty status. For instance, the Report named as "Income Poverty and Material Deprivation" of European Union in 2010 underlines that even though the difference in reference years raises certain technical and theoretical issues, it addresses the potential lagged effect between income and deprivation.
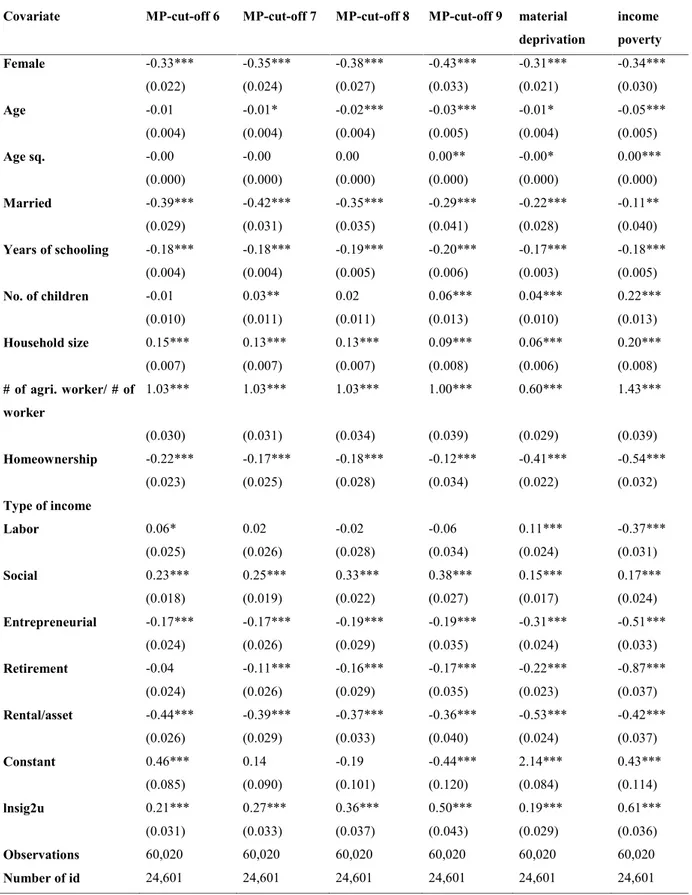
The estimation results are presented in Table 5, which are organized such that the effect of an explanatory variable on multidimensional poverty can be observed easily across a single row of the table. If the variable in question has a statistically significant coefficient in more than one instance, we interpret this finding as evidence that it has a statistically significant effect on the probability of being poor. The first four columns show the results of our benchmark model. The fifth column of the table is devoted to the results of the model where dependent variable shows EU severe material deprivation status (1=severely materially deprived, 0=non-deprived), while the last column presents the results of income poverty model where dependent variable shows income poverty status (1= poor, 0=non-poor).
According to the results, while the coefficients of years of schooling, homeownership are statistically significant and negative, the coefficients of household size and the ratio of agricultural worker to the number of worker in the household are significant and positive for all measures. This finding implies that lower years of schooling or homeownership decreases the likelihood of being multidimensional poor (irrespective of the cut-off), severely materially deprived or income poor, while higher household size or attachment to agriculture employment increases the likelihood of being poor.13
On the other hand, the number of children in the household is significant and positive for income poverty and EU severe material deprivation, implying that living in household with higher number of children increases the probability of being income poor or severely
12Social welfare income is the sum of unemployment benefits (including severance payment), widowed-orphan
benefits and elderly salaries, unpaid grants, and child benefits, housing allowance, and benefits from other persons or households as unreturned benefits in cash or kind received by households.
13The result with relation to agriculture is an expected result since agricultural production is mostly done by
materially deprived. Also, its coefficient is significant and positive for the probability of being multidimensionally poor (only significant for the cut-offs 7 and 9). So, individuals who are living in households with higher number of children are more likely to be multidimensionally poor.
When we look at the results with relation to the income types received by households, being a social welfare income recipient is significant and positive for all measures. So, individuals who are living in households that receive social welfare income are more likely to be poor. However, the being an entrepreneurial or a rental/asset income recipient has significant and negative effect on the probability of being poor (for all measures and cut-offs). We observe a similar effect of being a retirement income recipient, but note that it is insignificant for the cut-off 6. On the other hand, while we find that the coefficient of being a labor income recipient is significant and negative for the probability of being income poor, it is significant and positive for the probability of being severely materially deprived. It is only significant for the multidimensional poverty calculated by using the cut-off 6 and it has a positive effect on the probability of being multidimensionally poor.14
14When we use equal weighting scheme in order to identify the multidimensional poor, which is the same
weighting method with the Alkire-Foster multidimensional poverty methodology, we find somewhat different results compared to those that are obtained from the benchmark model (App 5). The effects of years of schooling, household size, and the attachment to agricultural employment, homeownership, the recipiency of rental/ asset and social welfare income show the same pattern compared to the benchmark scheme. However, we find that the number of children on the likelihood of being multidimensional poor has a negative effect for all cut-offs. With respect to the other income types received by households, while we find that being a labor income recipient is significant and positive for all measures, being an entrepreneurial income recipient is only significant and positive for the cut-off 40 percent and being a retirement income recipient is significant and positive for the cut-off (except for the cut-off 60 percent). On the other hand, App 7 presents the results of the models where we use the weights obtained from polychoric PCA in this weighting scheme. There are two different findings from the results obtained by using the first weighting method: (i) being an entrepreneurial income recipient decreases the probability of being multidimensionally poor, which is line with the results of benchmark model, and (ii) being a retirement income recipient decreases the probability of multidimensionally poor (for the highest cut-off), while it increases the probability of being multidimensionally poor (for the lower cut-offs). The finding with relation to the effect of being a retirement income recipient could be due to the fact that we include in the multidimensional measure the indicators regarding health. Individuals who receive retirement payment are older compared to those who do not. So, older individuals are more likely to have any health problem, which could be a reason of the positive effect of the retirement income.
Table 5: Probit regression results of the multidimensional poverty, income poverty and EU severe material deprivation
Covariate MP-cut-off 6 MP-cut-off 7 MP-cut-off 8 MP-cut-off 9
EU severe material deprivation Relative income poverty Female -0.33*** -0.35*** -0.38*** -0.43*** -0.31*** -0.34*** (0.022) (0.024) (0.027) (0.033) (0.021) (0.030) Age -0.01 -0.01* -0.02*** -0.03*** -0.01* -0.05*** (0.004) (0.004) (0.004) (0.005) (0.004) (0.005) Age sq. -0.00 -0.00 0.00 0.00** -0.00* 0.00*** (0.000) (0.000) (0.000) (0.000) (0.000) (0.000) Married -0.39*** -0.42*** -0.35*** -0.29*** -0.22*** -0.11** (0.029) (0.031) (0.035) (0.041) (0.028) (0.040) Years of schooling -0.18*** -0.18*** -0.19*** -0.20*** -0.17*** -0.18*** (0.004) (0.004) (0.005) (0.006) (0.003) (0.005) No. of children -0.01 0.03** 0.02 0.06*** 0.04*** 0.22*** (0.010) (0.011) (0.011) (0.013) (0.010) (0.013) Household size 0.15*** 0.13*** 0.13*** 0.09*** 0.06*** 0.20*** (0.007) (0.007) (0.007) (0.008) (0.006) (0.008) # of agri. worker/ # of worker 1.03*** 1.03*** 1.03*** 1.00*** 0.60*** 1.43*** (0.030) (0.031) (0.034) (0.039) (0.029) (0.039) Homeownership -0.22*** -0.17*** -0.18*** -0.12*** -0.41*** -0.54*** (0.023) (0.025) (0.028) (0.034) (0.022) (0.032) Type of income Labor 0.06* 0.02 -0.02 -0.06 0.11*** -0.37*** (0.025) (0.026) (0.028) (0.034) (0.024) (0.031) Social 0.23*** 0.25*** 0.33*** 0.38*** 0.15*** 0.17*** (0.018) (0.019) (0.022) (0.027) (0.017) (0.024) Entrepreneurial -0.17*** -0.17*** -0.19*** -0.19*** -0.31*** -0.51*** (0.024) (0.026) (0.029) (0.035) (0.024) (0.033) Retirement -0.04 -0.11*** -0.16*** -0.17*** -0.22*** -0.87*** (0.024) (0.026) (0.029) (0.035) (0.023) (0.037) Rental/asset -0.44*** -0.39*** -0.37*** -0.36*** -0.53*** -0.42*** (0.026) (0.029) (0.033) (0.040) (0.024) (0.037) Constant 0.46*** 0.14 -0.19 -0.44*** 2.14*** 0.43*** (0.085) (0.090) (0.101) (0.120) (0.084) (0.114) lnsig2u 0.21*** 0.27*** 0.36*** 0.50*** 0.19*** 0.61*** (0.031) (0.033) (0.037) (0.043) (0.029) (0.036) Observations 60,020 60,020 60,020 60,020 60,020 60,020 Number of id 24,601 24,601 24,601 24,601 24,601 24,601
Standard errors in parentheses * p<.05, ** p<.01, *** p<.001
4. Conclusion
The notion of poverty is fundamentally determined in two different kinds of concepts: Monetary or non-monetary concept. Different measures based on different indicators might identify dissimilar individuals as poor, and therefore, poverty reduction policies might be inefficient since it is not truly known who the poor are. Conventionally, lack of income is assumed as a standard component of the definition of poverty. However, since it does not take into account various aspects of poverty and the other shortcomings assessed above, poverty has been recently taken as a multidimensional phenomenon that includes various dimensions of well-being (such as health, living standards, labor market, etc.). Undoubtedly, there are ongoing debates in the literature on multidimensional poverty measures. In this study, we criticized the other existing measures (relative income poverty, EU severe material deprivation criterion and Alkire-Foster multidimensional poverty measure) and proposed a multidimensional poverty measure that incorporates various dimensions of well-being (such as health, housing, labor market and living conditions) by taking into account the socioeconomic and demographic structure of Turkey.
According to the results, given the overlapping ratios between the measures (over 56 percent), the new measure is partially consistent with the existing measures. The overlapping between multidimensional poverty and relative income poverty increases as the cut-off of the multidimensional measure increases. However, the overlapping between multidimensional poverty and EU severe material deprivation decreases when we increase the cut-off of the multidimensional measure. When we look at the descriptive findings, we observe that relative income poverty declined during the period under examination (from 25.2 percent in 2007 to 22.5 percent in 2010). However, EU severe material deprivation slightly increased from 59.0 percent in 2007 to 59.3 percent in 2010. With respect to the poverty rates calculated by using the new measure, we observe that multidimensional poverty also decreased during the period (with the exception of the multidimensional poverty calculated by using the first weighting method and the lowest cut-off).
On the other hand, we aimed to reveal how the new measure differentiates from existing poverty measures (i.e., relative income poverty measure and EU severe material deprivation criterion). Hence, a set of probit regressions are estimated, where dependent variables are EU severe material deprivation, income and multidimensional poverty. The empirical findings are important to the debate surrounding the policies that aim to identify the "poor" and reduce poverty in Turkey. For instance, higher years of schooling of individuals has a significant and negative effect on the probability of being poor (regardless of the
measure and for all the cut-offs and the weighting). Poverty reduction policies in Turkey should principally consider the education policies in the country. In addition, given the number of household size has a significant and positive effect on the probability of being poor; this gives rise to thought of existing fertility policies in Turkey. When we look at the results with regard to household characteristics, we find that the home ownership decreases the likelihood of being multidimensional poor (irrespective of the weighting and the cut-off); high number of agricultural worker in the household, high household size or being a social welfare income recipient increases the likelihood of being multidimensional poor. Given the results regarding the agricultural employment, the study also emphasizes the importance of labor market policies on fighting poverty. Rather than creating “any” job, the job is needed to be in non-agricultural sector, which might be a more sustainable solution for poverty.
On the other hand, the findings with respect to income types received by the households indicate that being a non-labor income recipient is more relevant factor than labor income for the probability of being multidimensional poor. This finding emphasizes that it is needed to revise current labor market policies and deepen research further. In addition, it underlines vital importance of policies to increase income of the poor. These policies could centre on changing factor inputs to increase the level or price of output of the poor: land (land reform, subsidized input packages, increased producer prices), labor (increasing employment information; increasing participation rates (via kindergartens, population policy); eliminating barriers in labor market; improving workplace health and safety; developing labor-using techniques of production; minimum wage legislation; physical capital and financial capital (Shaffer, 2008).
References
Alkire, S., Foster, J. (2007). Counting and multidimensional poverty measurement. OPHI working paper series No. 07, Oxford Poverty and Human Development Initiative (OPHI), University of Oxford.
Alkire, S., Santos M.E. (2010). Acute multidimensional poverty: A new index for developing countries. Human development research paper, 2010/2011. UNDP, USA.
Alkire, S., Foster J. (2011). Counting and multidimensional poverty measurement. Journal of
public economics, 95(7-8): 476-487.
Alkire, S., Santos M.E. (2013). A Multidimensional Approach: Poverty Measurement and Beyond. Social Indicators Research. 112: 239-257.
Asselin, L. M. (2002). Multidimensional Poverty Theory. CECI, June 2002.
Ataguba, J.E., Ichoku, H.E., Fonta, W.M. (2013). Multidimensional poverty assessment: applying the capability approach. International Journal of Social Economics. Vol. 40 No.4, 2013, pp.331-354.
Atkinson, A.B. (2003). Multidimensional deprivation: contrasting social welfare and counting approaches. Journal of Economic Inequality 1:51–65, 2003.
Baulch, B., Masset, E. (2003). Do Monetary and Nonmonetary Indicators Tell the Same Story About Chronic Poverty? A Study of Vietnam in the 1990s. World Development Vol. 31, No.3, pp. 441-453.
Batana, Y.M. (2013). Multidimensional Measurement of Poverty Among Women in Sub-Saharan Africa. Social Indicators Research, 112: 337-362.
Batana, Y.M. (2008). Multidimensional Measurement of Poverty in Sub-Saharan Africa. OPHI Working Paper 13.
Battiston, D., Cruces, G., Calva, L.F., Lugo, M.A., Santos, M.E. (2013). Income and Beyond: Multidimensional Poverty in Six Latin American Countries. Social Indicators Research, 112: 291-314.
Belhadj, B., Limam, M. (2012). Unidimensional and multidimensional fuzzy poverty measures: New approach. Economic Modeling 29 (2012) 995-1002
Berthoud, R., Bryan, M. (2011). Income, Deprivation and Poverty: A Longitudinal Analysis. Journal of Social Policy, 40, pp. 135-156.
Betti, G., Verma V. (2008). Fuzzy measures of the incidence of relative poverty and deprivation: a multi-dimensional perspective. Stat. Meth. & Appl. (2008) 17:225–250. Bidani, B., Ravallion, M. (1993). A regional poverty profile for Indonesia. Bulletin of
Indonesian Economic Studies. Volume 29, Issue 3.
Bossert, W., Chakravarty, S.R., D’Ambrosio, C. (2009). Multidimensional poverty and material deprivation. Working Papers 129, ECINEQ, Society for the Study of Economic Inequality.
Bossert, W., Chakravarty, S.R., D’Ambrosio, C. (2012). Poverty and time. J Econ Inequal (2012) 10: 145-162.
Bossert, W., Ceriani, L., Chakravarty, S., and C.D’Ambrosio (2012). Inter temporal material deprivation. Mimeographed.
Bourguignon, F. and Chakravarty, S.R. (2003). The measurement of multidimensional poverty. Journal of Economic Inequality, 1, 25-49.
Brück, T., Kebede S.W., (2013). Dynamics and Drivers of Consumption and Multidimensional Poverty: Evidence from Rural Ethiopia. IZA DP No. 7364.
Dercon, S., Calvo, C., (2007). Chronic Poverty and All That: The Measurement of Poverty Over Time. Chronic Poverty Research Centre, Working Paper No. 89.
Cappellari, L., Jenkins, S.P. (2004). Modelling low income transitions. Journal of Applied Econometrics, John Wiley & Sons, Ltd., vol. 19(5), pages 593-610.
Coromaldi, M., Zoli M. (2012). Deriving Multidimensional Poverty Indicators: Methodological Issues and an Empirical Analysis. Social Indicators Research 107: 37-54. Chakravarty, S.R., Mukherjeee D., Ranade R. (1998). On the Family of Subgroup and Factor
Decomposable Measures of Multi-dimensional Poverty”, Research on Economic Inequality 8, 175-194.
Decanq, K., Lugo, M.A. (2013). Weights in Multidimensional Indices of Wellbeing: An Overview. Econometric Reviews, 32:1, 7-34.
Dekkers, G. (2003). Financial and Multidimensional Poverty in European Countries: can the former be used as a proxy of the latter?. IRISS Working Paper Series 2003-13, IRISS at CEPS/INSTEAD.
Devicienti, F., Groisman, F., Poggi, A. (2009). Informality and poverty: Are these processes dynamically interrelated? Evidence from Argentina. ECINEQ 2009-146.
Deutsch, J., Silber, J. (2005). Measuring multidimensional poverty: An empirical comparison of various approaches. Review of Income and Wealth, 51: 145-174.
Ferreira, F.H.G., Lugo, M.A. (2012). Multidimensional Poverty Analysis: Looking for a Middle Ground. World Bank Policy Research Working Paper 5964.
Ferro-Luzzi G., Fluckiger Y., Weber S. (2006). A cluster analysis of Multidimensional poverty in Switzerland, University of Geneva Working Paper Series.
Foster, J., J. Greer, and E. Thorbecke. (1984). Notes and comments: A class of decomposable poverty measures. Econometrica, 52(3), 761-766.
Gradin, C., del Rio, C. And Canto, O. (2012). Measuring Poverty Accounting for Time. Review of Income and Wealth. Volume 58, Issue 2, pages 330–354.
Guio, A.C. (2009). What can be learned from deprivation indicators in Europe?. Eurostat methodologies and working paper, Eurostat, Luxembourg.
Guio, A.C., Fusco, A., Marlier E. (2009). A European Union Approach to Material Deprivation using EU-SILC and Euro-barometer data. IRISS WP 2009-19.
Hoy, M., Zheng, B. (2011). Measuring lifetime poverty. Journal of Economic Theory 146 (2011) 2544-2562.
Kuklys, W. (2005). Amartya Sen’s Capability Approach: Theoretical Insights and Empirical
Applications, Studies in Choice and Welfare, Springer-Verlag.
Maasoumi, E., Nickelsburg, G. (1988). Multivariate Measures of Well-being and an Analysis of Inequality in the Michigan Data”. In: Journal of Business and Economic Statistics, Vol. 6: 327-334.
Maasoumi, E., Lugo, M.A. (2008). The information basis of multivariate poverty assessments. In N. Kakwani and J. Silber (Eds.), Quantitative approaches to multidimensional poverty measurement (pp. 1-29). New York: Palgrave-MacMillan.
Moisio, P. (2004). A Latent Class Application to the Multidimensional Measurement of Poverty. Quality & Quantity 38: 703–717, 2004.
Nolan, B., Whelan, C.T. (1996). Resources, deprivation and poverty. Clarendon Press, Oxford.
Notten, G. (2008). Multidimensional Poverty in the Republic of Congo: Being Poor Simultaneously in Many Ways. BWPI Working Paper 65.
Nicholas, A., Ray, R. (2012). Duration and persistence in multidimensional deprivation: methodology and Australian application. Economic Record 88, 280, 106-126.
Perry, B. (2002). The Mismatch Between Income Measures and Direct Outcome Measures of Poverty. Social Policy Journal of New Zealand. Issue 19.
Perez-Mayo, J. (2005). Identifying deprivation profiles in Spain: a new approach. Applied Economics, 37, 943–55.
Ravallion, M. (1992). Poverty Comparisons: A Guide to Concepts and Methods. Living Standards Measurement Study Working Paper No. 88.
Ravallion, M. (2012). Poverty Lines across the World. Oxford Handbook of the Economics of Poverty, edited by Philip N. Jefferson, Oxford University Press, forthcoming.
Ringen, S. (1988). Direct and Indirect Measures of Poverty. Journal of Social Policy, 17, 351–66.
Sen, A. (1976). Poverty: an ordinal approach to measurement. Econometrica, 44, 219-231. Sen, A. (1985). Commodities and capabilities. Amsterdam: North-Holland.
Shaffer, P. (2008). New Thinking on Poverty: Implications for Globalisation and Poverty Reduction Strategies. DESA Working Paper No. 65.
Szeles, M. (2004). Multidimensional Poverty Comparisons within Europe: Evidence from the European Community Household Panel. IRISS Working Paper Series No:2004-05.
Townsend, P. (1979). Poverty in the United Kingdom. Penguin Books, Middlesex.
Tsui, K.Y. (2002). Multidimensional poverty indices. Social Choice and Welfare, 19: 69-93. Whelan, C.T., Layte, R., Maitre, B. (2004). Understanding the mismatch between income
poverty and deprivation: A dynamic comparative analysis. Eur. Sociol. Rev. 20(4), 287– 302.
Appendix
App 1: Cronbach alpha estimates
item-test item-rest interitem
Item Obs Sign correlation correlation covariance alpha
No capacity to afford meal with meat 107719 + 0.6355 0.5345 0.0355536 0.7595
No ability to keep home adequately warm 107719 + 0.5687 0.4568 0.0367685 0.7667
No ability to purchase clothes 107719 + 0.6372 0.5348 0.0354318 0.7593
No capacity to face unexpected expenses 107719 + 0.637 0.5401 0.0357326 0.7593
Not possession of dish washer 107719 + 0.633 0.5288 0.0354524 0.7598
Not possession of washing machine 107719 + 0.4546 0.3797 0.0403022 0.7752
Not access to hot water in dwelling 107719 + 0.4816 0.3534 0.0382151 0.7763
At least one household member who has limitation in activities because of health
problems 107719 + 0.426 0.2924 0.0392455 0.7817
At least one household member who has
chronicle health problem 107719 + 0.4744 0.3593 0.0386869 0.7752
Have payment arrears (excl. housing) 107719 + 0.3182 0.1908 0.0412547 0.7886
Have payment arrears (housing) 107719 + 0.4318 0.3639 0.0408576 0.7768
Not possession of bath or shower in dwelling 107719 + 0.5694 0.4664 0.0371191 0.7662
Not possession of indoor toilet 107719 + 0.4955 0.4052 0.0390968 0.7722
At least one unemployed household member 107719 + 0.2608 0.1624 0.0422794 0.7875
At least one informally employed household
member 107719 + 0.434 0.3001 0.0390812 0.7811
Test scale 0.0383385 0.78
App 2: Weights obtained from polychoric PCA
Indicators Comp 1 Comp 2 Comp 3 Comp 4
No capacity to afford meal with meat 0.3077 0.1845 -0.0878 -0.0454
No ability to keep home adequately warm 0.2707 0.1984 -0.1584 0.0666
No ability to purchase clothes 0.3064 0.1623 -0.1218 0.0365
No capacity to face unexpected expenses 0.3201 0.2192 -0.1273 -0.0479
Not possession of dish washer 0.3137 0.0082 -0.0749 -0.011
Not possession of washing machine 0.3112 -0.2554 -0.1145 0.1141
Not access to hot water in dwelling 0.1797 0.1252 0.6404 0.0012
At least one household member who has limitation in activities because of
health problems 0.1474 0.1327 0.6727 -0.0194
At least one household member who has chronicle health problem 0.2099 0.3726 -0.1341 -0.1563
Have payment arrears (excl. housing) 0.1069 0.4268 -0.0921 -0.3447
Have payment arrears (housing) 0.3057 0.3327 -0.0137 0.0856
Not possession of bath or shower in dwelling 0.3105 -0.2941 -0.0296 0.0671
Not possession of indoor toilet 0.293 0.3601 0.0201 0.0041
At least one unemployed household member 0.121 0.2228 0.0701 0.7591
App 3: Poverty status match (in total population)
Weighting
scheme Cut-offs Poverty Status
Relative income poverty EU Severe material deprivation
Non-poor Poor Non-poor Poor
Benchmark 6 indicators Non-poor 56.2 5.3 39.6 21.9 Poor 20.1 18.4 1.9 36.7 7 indicators Non-poor 63.6 7.8 40.7 30.7 Poor 12.7 15.9 0.7 27.9 8 indicators Non-poor 69.2 11.0 41.2 39.1 Poor 7.1 12.7 0.2 19.5 9 indicators Non-poor 72.8 14.9 41.4 46.4 Poor 3.5 8.8 0.0 12.2 1st weighting scheme (30 percent) 0.3 Non-poor 36.1 2.2 27.4 10.8 Poor 40.3 21.5 14.0 47.8 (40 percent) 0.4 Non-poor 49.1 4.7 33.6 20.2 Poor 27.2 19.0 7.8 38.4 (50 percent) 0.5 Non-poor 60.9 8.4 38.7 30.6 Poor 15.4 15.3 2.7 28.0 (60 percent) 0.6 Non-poor 69.4 12.7 40.7 41.4 Poor 6.9 11.0 0.8 17.2 2nd weighting scheme (30 percent) 1.86 Non-poor 37.3 2.3 29.7 9.9 Poor 39.0 21.4 11.7 48.7 (40 percent) 2.48 Non-poor 51.1 5.0 36.6 19.5 Poor 25.2 18.7 4.8 39.1 (50 percent) 3.10 Non-poor 62.7 8.8 40.0 31.6 Poor 13.6 14.9 1.4 27.0 (60 percent) 3.72 Non-poor 70.8 14.1 41.1 43.7 Poor 5.5 9.6 0.3 14.9
App 4: Marginal effects of the bechmark model, EU severe material deprivation and income poverty
Covariate MP-cut-off 0.3 MP-cut-off 0.4 MP-cut-off 0.5 EU SevereMaterial
Deprivation Income Poverty
Female -0.11*** -0.08*** -0.04*** -0.12*** -0.03*** (0.007) (0.005) (0.003) (0.008) (0.002) Age -0.00 -0.00* -0.00*** -0.00* -0.00*** (0.001) (0.001) (0.000) (0.001) (0.000) Age sq. -0.00 -0.00 0.00 -0.00* 0.00*** (0.000) (0.000) (0.000) (0.000) (0.000) Married -0.14*** -0.10*** -0.04*** -0.08*** -0.01* (0.011) (0.008) (0.004) (0.010) (0.003) Years of schooling -0.06*** -0.04*** -0.02*** -0.07*** -0.01*** (0.001) (0.001) (0.001) (0.001) (0.001) No. of children -0.00 0.01** 0.00 0.01*** 0.02*** (0.003) (0.002) (0.001) (0.004) (0.001) Household size 0.05*** 0.03*** 0.01*** 0.02*** 0.01*** (0.002) (0.001) (0.001) (0.002) (0.001) # of agri. worker/ # of worker 0.35*** 0.22*** 0.10*** 0.23*** 0.11*** (0.010) (0.007) (0.004) (0.011) (0.005) Homeownership -0.08*** -0.04*** -0.02*** -0.15*** -0.05*** (0.008) (0.006) (0.003) (0.008) (0.004) Type of income Labor 0.02* 0.00 -0.00 0.04*** -0.03*** (0.008) (0.005) (0.003) (0.009) (0.003) Social 0.08*** 0.05*** 0.03*** 0.06*** 0.01*** (0.006) (0.004) (0.002) (0.006) (0.002) Entrepreneurial -0.06*** -0.04*** -0.02*** -0.12*** -0.04*** (0.008) (0.006) (0.003) (0.009) (0.003) Retirement -0.01 -0.02*** -0.01*** -0.08*** -0.05*** (0.008) (0.005) (0.002) (0.009) (0.003) Rental/asset -0.13*** -0.07*** -0.03*** -0.21*** -0.02*** (0.007) (0.005) (0.002) (0.010) (0.002) Observations 60,020 60,020 60,020 60,020 60,020 Number of id 24,601 24,601 24,601 24,601 24,601
Standard errors in parentheses *** p<0.001, ** p<0.01, * p<0.05
App 5: Probit regression results of the multidimensional poverty by the first weighting scheme and possible cut-offs
Covariate MP-cut-off 0.3 MP-cut-off 0.4 MP-cut-off 0.5 MP-cut-off 0.6
Female -0.25*** -0.27*** -0.28*** -0.33*** (0.023) (0.022) (0.022) (0.026) Age 0.01* 0.01 0.00 -0.01 (0.004) (0.004) (0.004) (0.004) Age sq. -0.00* -0.00* -0.00 0.00 (0.000) (0.000) (0.000) (0.000) Married -0.55*** -0.50*** -0.47*** -0.39*** (0.032) (0.030) (0.030) (0.034) Years of schooling -0.16*** -0.16*** -0.15*** -0.15*** (0.004) (0.004) (0.004) (0.004) No. of children -0.17*** -0.13*** -0.10*** -0.09*** (0.012) (0.011) (0.010) (0.011) Household size 0.29*** 0.24*** 0.21*** 0.20*** (0.008) (0.007) (0.007) (0.007) # of agri. worker/ # of worker 1.27*** 1.23*** 1.08*** 0.95*** (0.035) (0.031) (0.030) (0.033) Homeownership -0.10*** -0.11*** -0.11*** -0.14*** (0.023) (0.023) (0.023) (0.027) Type of income Labor 0.11*** 0.12*** 0.12*** 0.04 (0.027) (0.025) (0.024) (0.027) Social 0.22*** 0.23*** 0.25*** 0.27*** (0.018) (0.018) (0.018) (0.021) Entrepreneurial 0.02 0.11*** 0.02 -0.02 (0.025) (0.024) (0.024) (0.028) Retirement 0.35*** 0.29*** 0.11*** -0.01 (0.026) (0.025) (0.024) (0.028) Rental/asset -0.35*** -0.34*** -0.37*** -0.38*** (0.026) (0.025) (0.026) (0.031) Constant 0.37*** -0.24** -0.66*** -1.03*** (0.090) (0.086) (0.085) (0.097) lnsig2u 0.24*** 0.25*** 0.14*** 0.27*** (0.031) (0.030) (0.032) (0.037) Observations 60,020 60,020 60,020 60,020 Number of id 24,601 24,601 24,601 24,601
Standard errors in parentheses * p<.05, ** p<.01, *** p<.001
App 6: Marginal effects the first weighting scheme and possible cut-offs
Covariate MP-cut-off 0.3 MP-cut-off 0.4 MP-cut-off 0.5 MP-cut-off 0.6
Female -0.08*** -0.11*** -0.08*** -0.03*** (0.007) (0.009) (0.006) (0.003) Age 0.00* 0.00 0.00 -0.00 (0.001) (0.002) (0.001) (0.000) Age sq. -0.00* -0.00* -0.00 0.00 (0.000) (0.000) (0.000) (0.000) Married -0.16*** -0.20*** -0.14*** -0.05*** (0.008) (0.012) (0.009) (0.004) Years of schooling -0.05*** -0.06*** -0.04*** -0.02*** (0.001) (0.001) (0.001) (0.001) No. of children -0.06*** -0.05*** -0.03*** -0.01*** (0.004) (0.004) (0.003) (0.001) Household size 0.09*** 0.10*** 0.06*** 0.02*** (0.003) (0.003) (0.002) (0.001)
# of agri. worker/ # of worker 0.41*** 0.49*** 0.30*** 0.10***
(0.011) (0.012) (0.008) (0.004) Homeownership -0.03*** -0.04*** -0.03*** -0.01*** (0.007) (0.009) (0.007) (0.003) Type of income Labor 0.03*** 0.05*** 0.03*** 0.00 (0.009) (0.010) (0.006) (0.003) Social 0.07*** 0.09*** 0.07*** 0.03*** (0.006) (0.007) (0.005) (0.002) Entrepreneurial 0.01 0.04*** 0.01 -0.00 (0.008) (0.010) (0.007) (0.003) Retirement 0.11*** 0.12*** 0.03*** -0.00 (0.007) (0.010) (0.007) (0.003) Rental/asset -0.12*** -0.13*** -0.09*** -0.03*** (0.009) (0.010) (0.006) (0.002) Observations 60,020 60,020 60,020 60,020 Number of id 24,601 24,601 24,601 24,601
Standard errors in parentheses *** p<0.001, ** p<0.01, * p<0.05
App 7: Probit regression results of the multidimensional poverty by using the second weighting scheme and possible cut-offs
Covariate MP-cut-off
1.86 MP-cut-off 2.48 MP-cut-off 3.10 MP-cut-off 3.72
Female -0.27*** -0.27*** -0.30*** -0.35*** (0.022) (0.021) (0.022) (0.027) Age 0.01** 0.01 -0.00 -0.01** (0.004) (0.004) (0.004) (0.004) Age sq. -0.00*** -0.00** -0.00 0.00 (0.000) (0.000) (0.000) (0.000) Married -0.51*** -0.45*** -0.44*** -0.35*** (0.030) (0.028) (0.029) (0.035) Years of schooling -0.16*** -0.15*** -0.15*** -0.15*** (0.004) (0.003) (0.004) (0.005) No. of children -0.12*** -0.10*** -0.06*** -0.08*** (0.011) (0.010) (0.010) (0.011) Household size 0.25*** 0.21*** 0.18*** 0.17*** (0.007) (0.007) (0.006) (0.007) # of agri. worker/ # of worker 0.99*** 0.96*** 0.87*** 0.81*** (0.032) (0.029) (0.029) (0.033) Homeownership -0.15*** -0.12*** -0.10*** -0.10*** (0.022) (0.022) (0.023) (0.028) Type of income Labor 0.16*** 0.13*** 0.09*** 0.05 (0.025) (0.024) (0.024) (0.029) Social 0.24*** 0.21*** 0.22*** 0.29*** (0.017) (0.017) (0.018) (0.022) Entrepreneurial -0.08** -0.10*** -0.09*** -0.06* (0.024) (0.023) (0.024) (0.029) Retirement 0.23*** 0.13*** 0.02 -0.09** (0.025) (0.023) (0.024) (0.029) Rental/asset -0.41*** -0.41*** -0.38*** -0.32*** (0.025) (0.024) (0.026) (0.033) Constant 0.49*** -0.01 -0.47*** -1.02*** (0.085) (0.081) (0.084) (0.100) lnsig2u 0.17*** 0.10** 0.08* 0.25*** (0.031) (0.030) (0.033) (0.040) Observations 60,020 60,020 60,020 60,020 Number of id 24,601 24,601 24,601 24,601
Standard errors in parentheses * p<.05, ** p<.01, *** p<.001
App 8: Marginal effects the second weighting scheme and possible cut-offs
Covariate MP-cut-off1.86 MP-cut-off 2.48 MP-cut-off 3.10 MP-cut-off 3.72
Female -0.09*** -0.10*** -0.07*** -0.02*** (0.008) (0.008) (0.005) (0.002) Age 0.00** 0.00 -0.00 -0.00** (0.001) (0.001) (0.001) (0.000) Age sq. -0.00*** -0.00** -0.00 0.00 (0.000) (0.000) (0.000) (0.000) Married -0.17*** -0.17*** -0.11*** -0.03*** (0.009) (0.011) (0.008) (0.003) Years of schooling -0.06*** -0.06*** -0.04*** -0.01*** (0.001) (0.001) (0.001) (0.000) No. of children -0.04*** -0.04*** -0.01*** -0.01*** (0.004) (0.004) (0.002) (0.001) Household size 0.09*** 0.08*** 0.04*** 0.01*** (0.003) (0.002) (0.002) (0.001)
# of agri. worker/ # of worker 0.35*** 0.37*** 0.21*** 0.06***
(0.011) (0.011) (0.007) (0.003) Homeownership -0.05*** -0.05*** -0.02*** -0.01*** (0.008) (0.008) (0.006) (0.002) Type of income Labor 0.06*** 0.05*** 0.02*** 0.00 (0.009) (0.009) (0.006) (0.002) Social 0.08*** 0.08*** 0.05*** 0.02*** (0.006) (0.006) (0.004) (0.002) Entrepreneurial -0.03** -0.04*** -0.02*** -0.00* (0.009) (0.009) (0.006) (0.002) Retirement 0.08*** 0.05*** 0.00 -0.01*** (0.008) (0.009) (0.006) (0.002) Rental/asset -0.15*** -0.15*** -0.08*** -0.02*** (0.010) (0.008) (0.005) (0.002) Observations 60,020 60,020 60,020 60,020 Number of id 24,601 24,601 24,601 24,601
Standard errors in parentheses *** p<0.001, ** p<0.01, * p<0.05