T.C
BAHÇEŞEHİR ÜNİVERSİTESİ
THE GRADUATE SCHOOL OF NATURAL AND APPLIED SCIENCES INDUSTRIAL ENGINEERING
ESTABLISHING SERVICE QUALITY MANAGEMENT SYSTEM: IMPELEMENTATION AT TAKSİM – 4. LEVENT METRO LINE
Master Thesis
İsmail DURMAN
Supervisor: Associate Professor Tunç BOZBURA
iii
ACKNOWLEDGEMENTS
I am heartily thankful to my supervisor, Tunç BOZBURA, whose encouragement, guidance and support from the initial to the final level enabled me to develop an understanding the subject.
I owe my deepest gratitude to Ahmet BEŞKESE and Orhan GÖKÇÖL for his support and encouragement.
Lastly, I thank my family for their endless support and love throughout my life.
iv
ABSTRACT
ESTABLISHING SERVICE QUALITY MANAGEMENT SYSTEM: IMPLEMENTATION AT TAKSİM – 4. LEVENT METRO LINE
Durman, İsmail
Industrial Engineering Program
Supervisor: Yrd. Doc. Dr. Tunç Bozbura
June, 2009, 140 pages
This study deals with service quality in Urban Public Transport systems and service quality management system that has been established for Taksim - 4.Levent metro as a sample implementation. Service quality is crucial tool for attracting customer and competing with other companies. However defining and measuring quality of service are harder than manufacturing products. Factors are not distinctive and they are changeable according to service type. Besides, understanding and collecting customer opinion and ideas are tough. Hence, establishing a management system, which provides systematic and sustainable approaches, is essential for supplying sufficient quality for customers.
Urban public transport systems have been hardly competing with private cars which comfort has been increasing. In order to provide attractive public transport passengers’ requirements and expectations should be followed, and services should be designed with respect to them. In this study, customer satisfaction survey, performance measurement system and service delivery standards are investigated within the framework of SQMS. In the study, for Taksim-4.Levent Metro Line service delivery standard is designed which describes how to create a service area in stations and trains. In order to monitor the success of the implementing the service delivery standard, performance measurement system is established. Mystery shopper survey and direct measurement method, which are measurement tools, are implemented in the metro line. The results point that objective measurement system is major factor for sustaining and improving quality of services. A survey has done at the metro line in order to collect customer perceptions and expectations, which are presented as well.
Key Words: Service Quality, Urban Public Transport, Customer Perceptions and Expectations
v
ÖZET
HİZMET KALİTESİ YÖNETİM SİSTEMİNİN KURULMASI: M2 TAKSİM – 4. LEVENT METRO HATTINDA UYGULANMASI
Durman, İsmail
Endüstri Mühendisliği Programı
Danışman: Yrd. Doc. Dr. Tunç Bozbura
Haziran, 2009, 140 sayfa
Bu çalışma kent içi toplu taşıma sistemlerinde hizmet kalitesini ve M2 Taksim-4.Levent metro hattında hizmet kalitesi yönetim sisteminin kurulmasını ele almaktadır. Hizmet kalitesi müşterilerinin ilgisini çekmek ve rakipler ile rekabeti sağlayabilmek için oldukça önemli bir araçtır. Ancak hizmtlerin kalitesinin tanımlanması ve ölçülmesi üretim sektörüne göre zordur. Fakörler tam belirgin olmayıp, hizmet yapısına göre farklılık göstermektedir. Ayrıca müşterilerin fikirlerini ve düşüncelerini toplamak da zor bir süreçtir. Bu sebeple, bir yönetim sistemin oluşturulması müşterilerin yeterli kaliteyi elde etmek için esas şart olup, sistematik ve sürdürülebilir bir yaklaşık sağlayackatır.
Kent içi toplu taşıma sistemleri her geçen gün konforu artan özel araçlarla rekabet edememektedir. Toplu taşımayı cazip hale getirmek için yolcuların ihtiyaç ve beklentileri izlenmeli ve hizmetlerin tasarımı bu ihtiyaç ve beklentilerin dikkate alınması sonucu yapılmalıdır. Bu çalışmada, hizmet kalitesi yönetim sistemi kapsamında müşteri memnuniyeti araştırması, performans ölçüm methodları ve hizmet standartlarının oluşturulması incelenmiştir. Bu çalışma ile M2 Taksim-4.Levent metro hattı için istasyon ve trenlerde nasıl hizmet sunulacağını anlatan hizmet standartları oluşturulmuştur. Hizmet standartlarının uygulamadaki başarısını görmek için performans ölçüm sistemi geliştirilmiştir.Performans ölçüm metodu olarak gizli müşteri araştırması ve doğrudan ölçüm metodları metro hattında uygulanmıştır.Bu ölçüm methodlarının sonuçları, objectif performans ölçüm sisteminin hizmet kalitesinin sürekli gelişmesi için temel faktör olduğunu ortaya koymuştur. Müşterilerin algılarını ve beklentilerini toplamak amacıyla metro hattında bir araştırma yürütülmüş ve sonuçlar bu çalışmada sunulmuştur.
Anahtar Kelimeler: Hizmet Kalitesi, Kentiçi Toplu Taşıma, Müşteri Algısı ve Beklentileri
vi
TABLE OF CONTENTS
LIST OF TABLES ... ix
LIST OF FIGURES ...xii
LIST OF ABBREVIATIONS...xiii
1. INTRODUCTION... 1
2. GENERAL INFORMATION ... 2
2. 1 DEFINITION OF SERVICE QUALITY ... 2
2. 2 INTRODUCTION OF ISTANBUL ULASIM ... 3
2.2.1 General Information ... 3
2.2.2 M2 Taksim – 4.Levent Metro Line... 4
2.2.3 Future Situation of M2 Taksim-4. Levent Line... 5
2.3 SERVICE QUALITY... 6
2.3.1 The Model Of Service Quality... 6
2.3.2 Dimensions of Service Quality ... 9
2.3.3 Performance Measurement System... 12
2.4 SERVICE QUALITY IN URBAN PUBLIC TRANSPORT ... 15
2.4.1 Example of Quality Programs... 16
2.4.1.1 European example ... 16
2.4.1.2 America example... 25
2.4.1.2.1 Service dimensions and service criteria in American companies ... 25
2.4.1.2.2 Performance measurement methods ... 27
2.4.1.2.3 MTA-NYCT example... 27
2.4.1.2.4 BART example... 30
3. DATA AND METHOD... 32
3. 1 ISTANBUL ULASIM IMPLEMENTATION... 32
3.1.1 Service Delivery Standard... 33
vii
3.1.1.2 Requirement levels... 39
3.1.1.3 Unacceptable Situations ... 40
3.1.2 Performance Measurement System ... 44
3.1.2.1 Mystery shopping survey ... 44
3.1.1.2.1 Designing and implementing mystery shopper survey ... 45
3.1.1.2.2 Determining scope... 46
3.1.1.2.3 Forming the checklist... 47
3.1.1.2.4 Establishing service standards... 51
3.1.1.2.5 Determining the survey methodology ... 53
3.1.1.2.6 Selecting and training mystery shoppers ... 60
3.1.1.2.7 Installing calculation method of service level... 60
3.1.1.2.8 Fulfilling the survey... 73
3.1.1.2.9 Collecting and editing data ... 74
3.1.1.2.10 Reporting and publishing the results... 75
3.1.1.2.11 Evaluating results and implementing corrective actions ... 76
3.1.3 Customer Satisfaction Survey ... 90
3.1.3.1 Designing and implementing a customer satisfaction survey ... 91
3.1.3.2 Research methodology... 91
3.1.3.3 Doing field research... 95
3.1.3.4 Controlling the reliability... 96
3.1.3.5 Key in data... 96
3.1.3.6 The questionnaire and reporting... 96
4. RESULTS... 107
5. CONCLUSION... 113
REFERENCES... 114
viii
Appendice-A.1 Customer Satisfaction Survey Questionnare ... 118 Appendice-A.2 M2 Taksim – 4 Levent Mystery Shopper Checklist ... 125 Appendice-A.3 Contact Center Mystery Shopper Checklist ... 132 Appendice-A.4 Complaint Management System Mystery Shopper Checklist. 133 Appendice-A.5 Web Site Mystery Shopper Checklist ... 134 Appendice-A.6 Service Standards Guideline For Mystery Shoppers ... 135
ix
LIST OF TABLES
Table 2.1 : Characteristics of the lines ... 3
Table 2.2 : The ways of listening to customers ... 14
Table 2.3 : Definitions of quality determinants ... 21
Table 2.4 : Main topics and requirements according to EN 13816 ... 22
Table 2.5 : Distribution of quality criteria according to their level... 23
Table 2.6 : Quality dimensions defined by American companies... 25
Table 2.7 : The details of American quality programs ... 26
Table 2.8 : MTA-NYCT passenger environment survey indicators: vehicle .... 28
Table 2.9 : MTA-NYCT passenger environment survey indicators: stations ... 29
Table 2.10 : BART passenger environment survey indicators ... 30
Table 2.11 : Measurements by recording automatically ... 31
Table 3.1 : Determinants and quality criteria ... 33
Table 3.2 : Reference services of quality criteria related with availability... 34
Table 3.3 : Reference services of quality criteria related with information ... 35
Table 3.4 : Reference services of quality criteria related with time ... 37
Table 3.5 : Reference services of quality criteria related with comfort ... 37
Table 3.6 : Reference services of quality criteria related with customer care... 38
Table 3.7 : Reference services of quality criteria related with security... 39
Table 3.8 : Requirement levels of quality criteria... 39
Table 3.9 : Unacceptable situations of quality criteria related with availability ... 40
Table 3.10 : Unacceptable situations of quality criteria related with information ... 41
x
Table 3.12 : Unacceptable situations of quality criteria related with comfort .. 42
Table 3.13 : Unacceptable situations of quality criteria related with customer care... 43
Table 3.14 : Unacceptable situations of quality criteria related with security.. 43
Table 3.15 : Definition of measurement system according to criteria... 48
Table 3.16 : Sub Criteria of cleanliness and neatness of metro stations ... 51
Table 3.17 : Distribution of measurements according to stations ... 53
Table 3.18 : Distribution of measurements according to time periods ... 54
Table 3.19 : Distribution of measurements according to supporter services .... 54
Table 3.20 : Distribution of measurements according to buying ways of ticket 55 Table 3.21 : Distribution of measurements according to staff... 57
Table 3.22 : Distribution of measurements according to equipments... 58
Table 3.23 : Distribution of measurements according to complaints way ... 59
Table 3.24 : The scores of cleanliness and neatness of metro stations ... 63
Table 3.25 : The scores of cleanliness and neatness in trains... 64
Table 3.26 : The scores of reception and information on the offer of services.. 65
Table 3.28 : Sample calculation for weighted service score ... 67
Table 3.29 : 2007 Customer satisfaction survey: customer flows ... 68
Table 3.30 : Density matrix of weekdays ... 70
Table 3.31 : Density matrix of weekend... 71
Table 3.32 : Sample calculation methodology of weighted service score... 73
Table 3.33 : Example figures of density matrix... 88
Table 3.34 : Sample figures of updated matrix ... 88
xi
Table 3.36 : Sample figures of updated density matrix ... 89
Table 3.37 : Train capacity... 90
Table 3.38 : Time periods ... 94
Table 3.39 : Sample sizes according to sample error... 95
Table 3.40 : Questions related with customer and journey... 97
Table 3.41 : Service dimensions and quality criteria defined by Canadian Center for Management Development... 100
Table 3.42 : Example list of public transport service quality measures defined by TCRP ... 101
Table 3.42: Example list of public transport service quality measures defined by TCRP (continued)... 102
Table 3.43 : Example list of service quality criteria for railway transport defined by Lui Jun ... 103
Table 3.44 : Survey questions according to service criteria and determinants ... 104
Table 3.45 : The scale of satisfaction levels... 105
Table 4.1 : Service level of metro line... 107
Table 4.2 : Satisfaction levels ... 109
xii
LIST OF FIGURES
Figure 2.1 : Istanbul railsytem network map ... 5
Figure 2.2 : The model of service quality... 7
Figure 2.3 : Determinants of service quality... 10
Figure 2.4 : Service delivery process ... 11
Figure 3.1 : Service quality loop ... 32
Figure 3.2 : Stages of mystery shopping survey ... 46
Figure 3.3 : Results of availability of ticket machine... 77
Figure 3.4 : Results of availability of turnstiles... 78
Figure 3.5 : Results of reception and information on the offer of service... 79
Figure 3.6 : Results of availability of escalator, lift, moving walkways ... 80
Figure 3.7 : Results of permanent information in station ... 81
Figure 3.8 : Cleanliness and neatness of metro stations ... 82
Figure 3.9 : Results of cleanliness and neatness of trains ... 83
Figure 3.10 : Results of permanent information in trains ... 84
Figure 3.11 : Results of fight against fare dodging ... 85
Figure 3.12 : Age distribution... 97
Figure 3.13 : Gender distribution... 98
Figure 3.13 : Education status... 98
Figure 3.14 : Income status ... 99
Figure 4.1 : Service level of metro line ... 108
Figure 4.2 : Satisfaction levels-1 ... 110
xiii
LIST OF ABBREVIATIONS
Importance-Satisfaction : IS
Passenger Environment Survey : PES
Service Quality Management System : SQMS
Transit Cooperative Research Program : TCRP
1. INTRODUCTION
Quality is important for service industries in order to compete with other companies. In urban public transport (UPT) sector service quality is critical for metropolitans, which are facing traffic problems. Although UPT is more economic, the comfort of private cars has been increasing and this encourages that people to have. Thus, the number of cars has become alarming level and the traffic has become the most important problem for metropolitans. UPT is the unique solution for the traffic congestion. Service quality management system (SQMS) is crucial to provide attractive public transport. Passenger-oriented system is an obligation as other service companies. Passenger requirements and expectations should be considered in designing services. Sustainability is important, in order to supply sustainable service quality, service delivery standard should be established. The targets and performance measurement system are important issues in management systems. Targets and performance reveals the quality of services. Performance of the system should be measured periodically in order to provide improvement. The results should be compared with the target. The weak points are recognized by measurement system and they should be eliminated promptly.
2
2.
GENERAL INFORMATION
2. 1 DEFINITION OF SERVICE QUALITY
Quality is much easier to define when manufacturing tangible products and manufacturing quality may simply involve conformance to specifications (Metters et al. 2003) In services, evaluating the level of quality is much more difficult. Because the services are an elusive and indistinct construct (Parasuraman et al.1985) The assessment of quality is made during the service delivery process and each customer contact is referred to as a moment of truth, an opportunity to satisfy or dissatisfy the customer (Fitzsimmons and J. Fitzsimmons 2008) Customers are assessing the quality of service, according to their needs and expectations. If the service performance does not address individual customer needs, the customer will not require the service (Sampson 1999).
Although, quality needs investing money, quality service pays off, because it creates true customers who are glad that they selected a firm after the service experiences, who will use the firm’s service again, who will sing the firm’s praises to others (Metters et al. 2003). Acquiring a new customer costs five times more money to retain a current customer (Rust et al.1995). In the light of this views, quality of service provides high competitive power and higher profit as a result of customer satisfaction and customer retention.
3
2. 2 INTRODUCTION OF ISTANBUL ULASIM
2.2.1 General Information
In 1988, Istanbul Metropolitan Municipality founded Istanbul Ulasim in order to operate the rail systems as UPT (Istanbul Ulasim 2009). As responsible for the operation and maintenance of metro, light rail, tramway, funicular and cable car in the city, Istanbul Ulasim AS serves over 800.000 passengers with over 800 employees coordinated centrally from its headquarters in Esenler (Istanbul Ulasim 2009) With a 72 km long urban rail system, Istanbul Ulasim AS serves more than 280 million passengers a year (Istanbul Ulasim 2009)
Istanbul Ulasim operates metro, tram, funicular and 2 cableway systems in Istanbul. Besides, the entire maintenance and repair of the rolling stocks as well as rail system projects and research and development works are being carried out diligently at Istanbul Ulasim. Characteristics of lines are shown in table 2.1.
Table 2.1 : Characteristics of the lines
Lines Length Number of
Stations
Number of Passengers (per
day)
M1 Aksaray Havalimanı Metro 20 20 200.000
M2 Taksim 4.Levent Metro 14 10 200.000
T1 Zeytinburnu Kabataş Tram 14 24 230.000
T2 Güngören Bağcılar Tram 5 9 50.000
T3 Kadıköy Moda Tram 2,6 10 2.000
T4 Edirnekapı-Sultançiftliği Tram
12,5 18 90.000
F1 Taksim Kabataş Funicular 0,6 2 26.000
Eyüp, Maçka Cableway 0,7 4 2.500
Total 70 97 800.000
4 2.2.2 M2 Taksim – 4.Levent Metro Line
The line was constructed between 1992-2000 and it started to operate on September 16, 2000 (Istanbul Ulasim, 2009) Line length is 8 km and there are 6 stations on the line which services almost 200.000 passenger per day.
The stations are; a. Taksim b. Osmanbey c. Şişli d. Gayrettepe e. Levent f. 4.Levent
There are three different working hours during the week period because the passenger flow differs according to weekdays and weekend.
Monday-Thursday: 06:15- 00:30 Friday-Saturday : 06:15- 01:00 Sunday : 06:30- 00:30
5 Figure 2.1 : Istanbul railsytem network map Source: İstanbul Ulasim
The marked part shows M2 Taksim-4.Levent line in the above map. 2.2.3 Future Situation of M2 Taksim-4. Levent Line
In the beginning of 2009, two provisional lines started at two sides. Şişhane station at Taksim side; and Sanayi Mah., İTÜ and Atatürk Oto Sanayi station at 4. Levent has become operational. These two lines works as ring lines to transfer passengers to M2 Taksim 4.Levent line. Taksim-Şişhane and 4.Levent-Atatürk Oto Sanayi lines haven’t changed operating plans of M2 Taksim-4.Levent. It is aimed that the two lines are linked to M2 Taksim-4.Levent by the end of 2009, and there will be one line. Therefore, a passenger getting on the metro at Şişhane station transfer to Atatürk Oto Sanayi station.
6 2.3 SERVICE QUALITY
2.3.1 The Model Of Service Quality
Customers assess service by comparing the service they receive (perceptions) with the service they desire (expectations) (Parasuraman et al. 1990). Customer perceptions and expectations are determinative factors for quality of service in addition to company performance. Therefore Company should determine performance targets considering with customer expectations and perceptions. Excellent companies know their customers; they know their customers’ needs and requirements (Metters et al. 2003). Besides, company should monitor their performance whether targets meet. Ideally, the level of performance, target, perception and expectation should be equal in order to deliver high quality service. However, there are differences between these issues in implementation phase. In line with this thinking, Zeithmal, Berry, and Parasuraman (1985, p.44) developed service quality model. This figure summarizes the key insights gained about the concept of service quality and its factors affecting it. The service quality model chart is shown below illustrates the relationship between customers and company.
7
Figure 2.2 : The model of service quality
Source: A. Parasuraman, A.V. Zeithamal, L.L. Berry, 1985, A conceptual model for achieving customer satisfaction, Fascile of management and technological engineering.
In the model factors affecting service quality are defined in two sides that are customer and marketer. In customer side expectations and perceived service are main factors that are affected by world of month, personal needs and past experiences and performance of service delivery. In marketer side managements try to define the customer expectation and perceptions according to their experience and marketing tools such as marketing researches, suggestion and complaints systems. The services
8
are revised according to perceived expectations and perceived quality. Delivering service is one of main factors is affected management perceptions of expectations and revisions of services. It can help managers identify the source of the problem about services quality by way of that service providers propose the requirements what achieved the expected service quality (Jing et al. 2006)
In the model the differences between the factors of the services are defined as Gaps. These differences, or gaps, can be used to identify the relative strengths and weaknesses in service quality of an organization (Grapentine 1999). In model there are 5 gaps that first four are those on the provider side of service and the fifth relates to the customer side of service. A company can achieve a strong reputation for service quality when the gaps are kept in low level.
The gaps determine the quality level of the services.
GAP 1: Costumer expectation — management perception gap
These are discrepancies between executive perceptions and consumer expectations. Company executives may not always understand what features connote high quality to consumers in advance, what features a service must have in order to meet consumer needs, and what levels of performance on those features are needed to deliver high quality service.
GAP 2: Management perception — service quality specifications
There may be constraints (resources, or market conditions), which prevent management from delivering what the consumer expects, or there may be an absence of total management commitment to service quality.
GAP 3: Service quality specifications — service delivery gap
There may be difficulty in standardizing employee performance even when guidelines exist for performing services well and treating consumers correctly.
GAP 4: Service delivery — external communications gap
Media advertising and other communications by an agency can affect consumer expectations. Promising more than can be delivered will raise initial expectations but lower perceptions of quality when the promises are not fulfilled. Also, companies can neglect to inform consumers of special efforts to assure quality that are not visible to consumers, thereby affecting consumer perceptions of the delivered service.
9
GAP 5: Expected service — perceived service gap
This is how consumers perceive the actual service performance in the context of what they expected. The quality that a consumer perceives in a service is a function of the magnitude and direction of the gap between expected service and perceived service.
2.3.2 Dimensions of Service Quality
Although there is an agreement in literature that perceived service quality has multidimensional nature, it is still the debate subject on what the number is and what the content of dimension of service quality is (Novakevic 2008). Gronross (1994 pp. 36-44) states that there are two quality dimensions, which are functional and technical quality. Technical quality is defined as basic services which customer get. For instance if a passenger uses rail system, customers are taken to specific destination. Functional quality is the reason of getting the services. For instance, for the rail system transport, punctuality and cleanliness of the vehicle are sample important factors. Rust and Oliver (1995, pp.1-19) establishes three-dimensional model by adding to Gronros model a dimension, which is service environment. Parasuraman, Zeithaml and Berry (1985, pp 44-48)having researched in four service branches: banking, credit card companies, stockbrokers and service companies for home gadgets repairs, found that expectations and perception of service quality are affected by the following ten determinants:
a. reliability b. sensibility c. competitiveness d. accessibility e. politeness f. communicability g. credibility h. safety
i. understanding and consumer commitment and j. tangibility
10
It is quite possible that the relative importance of the 10 determinants in molding customer expectations (prior to service delivery) may differ from their relative importance vis- a-vis consumer perceptions of delivered service (Parasuraman et al. 1985). The internal and external variables of the service delivery process that should be measured are customer expectations, perceptions of service experience, level of importance and level of satisfaction and priorities for improvement (Schmit,1998). In order to build upon these five service factors as a foundation for the Customer Measurement Tool, a conceptual model of their relationships shown below as Figure 2 has been developed.
Personal Needs
Expected Service
Perceived Service
World of Mouth Past Experience Determinants of Service Quality 1. Access 2. Commucation 3.Competence 4.Courtesy 5.Credibility 6.Realibility 7.Responsiveness 8.Security 9.Tangibles 10. Understanding Knowing the Customer Delivered Service Quality
Figure 2.3 : Determinants of service quality
Source: A. Parasuraman, A.V. Zeithamal, L.L. Berry, 1985, A conceptual model for achieving customer satisfaction, Fascile of management and technological engineering.
11
Figure 2.4 : Service delivery process
Source: F. Schmidt, T. Strickland, Client satisfaction surveying common measurements tool, Canada center for management development, 1998, Canada
In 1994 Parasuraman, Zeithaml and Berry, determined 5 dimensions which are helpful for understanding what customers expect from service providers dimensions follow as:
a. Tangibles: Tangibles include the physical evidence of the service, such as physical facilities, appearance of service providers, tools or equipment used to provide service, physical presentation of the service, and other customers in the service facility.
b. Reliability: Reliability involves consistency of performance and dependability. It means that the firm performs the service right the first time
12
and that honors its promises. Specifically, it involves accuracy in billing, keeping records correctly, and performing the service at the designated time. c. Responsiveness: The willingness or readiness of employees to provide
service. It involves timeliness of service including mailing a transaction slip immediately calling the customer back quickly, and giving prompt service. d. Assurance: This dimension relates to the knowledge, competence, and
courtesy of service employees and their ability to convey trust and confidence. Competence means possession of the required skills and knowledge to perform the service. Courtesy involves kindness, respect, consideration and helpfulness of contact personnel.
e. Empathy: The caring and individualized attention provided to customers includes the approachability and ease of contact with the service providers and their efforts to understand the customers’ needs.
2.3.3 Performance Measurement System
The level of service quality has a close relationship with customer’s service perception effect, and performance evaluation of service quality is an evaluation of the process and result of service, which may affect customer’s satisfaction level. Therefore, evaluation research of performance in the process is very important in service management, which is taken much concern by researchers (Yiao and Zhou 2008).
Performance measurement system is helpful and provide effective and systematic basis for construction of service management (Jiao 2008). Performance measurement is also evolving at a considerable rate to combat new organizational realities; owing to the fight for industrial supremacy, the concept of performance as it is measured and evaluated, is undergoing a transformation in modern business organization (Folan and Browne 2005). Therefore companies need to install an ongoing service research process that provides regularly, relevant trend data that managers become accustomed to using in decision-making. Companies need to build a service quality information system, not just do a study. Conducting a service quality study is
13
analogous to taking a snapshot. Deeper insight and a sense for the pattern o f change come from continuing series of snapshots taken from many angles (Parasuraman, et al. 1994).
Jiao (2008, p.1) defines the 5 principles of designing performance measurement of service quality.
a. Comprehension: the indexes can evaluate quality of customer service in logistic companies comprehensively, so that companies monitor and control the whole process of customer service.
b. Typicality: there are so many influential factors of customer’s service, but designers should find the most typical factors among them.
c. Economy: when designing a system, cost effectiveness should be considered fully, a balance between cost and benefit should be carried out.
d. Maneuverability: the evaluation project should be easy understood and related data should be available, which is one of the most important factors in design of system.
e. Stability: the stability is good at the development of the system; on the other hand, the stability doesn’t affect the improvement of the system based on the changeable environment.
Table 2.2 is meant to convey the concept of systematic listening and not to offer definitive guidance on what a service quality information system should entail. The goal is to become a "listening company" ; the specifics of how will vary from company to company ( Parasuraman et al.1994).
14
Table 2.2 : The ways of listening to customers
Source: A. Parasuraman, A.V. Zeithamal, L.L. Berry, 1994, Improving service quality in America: lessons learned.
Type of Research Frequency Purposes
Customer
Complaint Solicitation
Continuous Identify dissatisfied customers to
attempt recovery; identify most common categories of service failure for remedial action
Post-Transaction Survey Monthly Obtain customer feedback while
service experience is still fresh; act on feedback quickly if negative pattern develop
Customer Focus group
interview Quarterly Provide a forum for customes to suggest service-improvement ideas; offer fast, informal customer feedback on service issues
Mystery shopper surveys Three times per year Measure indiviual employee service
behaivor for use in coaching, training, performance evaluation, recognition and reward; identify systematic strenghts and weakness in customer-contact service.
Employee Surveys Measure internal service quality;
identify employee-perceived obstacles to improved service; track employee morale and attitudes
Total market service quality surveys
Assesscompanu’s servce performance compared to competitors; identify service-improvement priorities; track service improvement over time.
15
2.4 SERVICE QUALITY IN URBAN PUBLIC TRANSPORT
The number of private cars has been increasing strictly in Istanbul (Istanbul Ulasim 2005) therefore the traffic congestion has become the most important problem in the city that it causes extra energy consumption, pollution emissions, accidents and wasting time. UPT should be more common and available in order to solve this problem. Policies which aim at increasing public transport usage should promote its image, but at the same time, public transport systems need to become more market-oriented and competitive, this requires an improvement in service quality, which can only be achieved by a clear understanding of travel behavior and customer needs and expectations (Beirao and Cabral 2007). In the light of customer needs and expectations the UPT companies should build their services and try to sustain the quality of services. Otherwise, people don’t prefer UPT unless they have to use due to economical reasons.
For UPT, as in other service industries, increases in customer satisfaction translate into retained markets; increased use of the system, newly attracted customers, and a more positive public image. To accomplish these ends, public transit needs reliable and efficient methods for identifying the determinants of service quality from the customers' perspective (TCRP 1999).
As a result of improving transit service public transport companies and public get remarkable benefits (Litman 2008). The benefits are as follow:
i. Existing transit passengers (who would use transit even without the improvements);
ii. New transit passengers (who would only use transit if service is improved); iii. Benefits society by reducing traffic problems (congestion, roadway and
parking costs, consumer costs, accidents, energy consumption, and pollution emissions);
iv. Provides scale economies (increased ridership can create a positive feedback cycle of improved service, increased public support, more transit-oriented land use, and further ridership increases); and
16 2.4.1 Example of Quality Programs
European Union conducted a comprehensive program, called Quattro Research Project, which aims to increase the performance and the attractiveness of UPT in Europe. At the end of the program a final report was published and with respect to the report. EN 13816 Service Quality Standards for Public Transport Company is prepared and published by European Committee for Standardization (CEN).
In USA every company has specific quality programs, which based on customer-oriented approach and the quality programs include designing service standards and conducting performance measurement system (TCRP 2005). Customer satisfaction surveys are common and valuable tool for learning customer perceptions and passenger environment surveys are conducted in order to monitor performance of the cleanliness and ride comfort.
2.4.1.1 European example
The European Commission thinks quality as a major tool to increase the performance and the attractiveness of UPT in Europe. Before recommending the use of quality techniques European Commission obtained a clear and scientific view of what quality means for the public transport sector. The Quattro Research Project was undertaken within European Commission Transport RTD Programme in order to develop and improve quality of service in public transport sector. The project is conducted between 1996 and 1998 with consortium that is composed of 20 partners from 8 European Union countries, Norway and 3 Baltic Europe countries (Quattro 1998). The participant countries are Belgium, Estonia, Finland, France, Germany, Hungary, Italy, The Netherlands, Norway, Poland, Portugal and Spain, Denmark and United Kingdom.
In addition, the following associations participated the project; i. The European Consumer’s Organization (BEUC ),
ii. Council of European Municipalities and Regions, (CEMR) iii. CEN (European Committee for Standardization),
iv. European Foundation for Quality Management (EFQM),
17
The objectives, mentioned in the final report (1998 p.7) that is published at the end of the project, are:
a. to identify current and emerging quality management practices in the contracting and tendering of UPT provision with a particular emphasis on issues of quality definition and measurement, on the clarification of the contracting parties’ responsibilities, as well as on evaluation procedures and their impact on continuous improvement programmes;
b. to evaluate these practices and to figure out how they could be improved by looking at quality management trends and best practices in other fields than UPT;
c. to propose a series of guidelines to authorities and operators involved or interested in tendering, contracting and performance monitoring in UPT, with a strong focus on quality.
The empirical scope of the project covers the European Union, Norway, Poland, Hungary and the Baltic States.
Quattro(1998, pp.13-14) recommended some basic issues in order to deliver high quality services for authorities, operator and vehicle manufacturer.
Quattro recommends for operator: a. to know their market;
b. to appreciate their service performance as it is (good or poor), compared to demand and competition;
c. to consider their activity as more than a business: the impact of passenger transport activities on the local community and on the quality of life must be taken into consideration in UPT strategies, objectives and priorities;
d. to seek to establish a visible professional competence by reaching standards set for formal qualification (ISO 9000, XP X 50-805) and/or by implementing total quality management principles in the running of their operations;
e. to develop a customer satisfaction measurement system and to use its results in connection with those of the internal quality monitoring system;
f. to achieve excellence in management and operations through established management principles (e.g. EFQM);
18
g. to use front-line management development and continuous improvement programmes to improve customer-contact related performance;
h. to continuously assess customer satisfaction;
i. to innovate within secure business boundaries and principles; j. to cultivate a positive “no blame” approach to the coaching of staff;
k. to adopt an open and honest approach to service problems and to compensate customers in case of service flaw;
l. to benchmark their performance with others, formally or informally, within the public transport sector or with other sectors.
m. not to forget that the people who ultimately influence service quality in public transport are the bus driver, traffic warden, the person in charge of complaints or vehicle maintenance, etc. Their working conditions will influence directly their willingness and capacity to provide good service. Listening to the staff, communicating with them on their working conditions, on the firm's traffic management strategy, on the results of their work and on the practical
n. consequences for them of the management's decisions is therefore essential;
Quattro recommends authorities:
a. to define an urban development strategy including traffic management strategies;
b. on that basis, to formally agree on a policy for the network and explain clearly to
c. the bidding operators “how we will do things around here”;
d. to be clear on transport policy, its expected impact on behaviors and its e. consequences on priorities in terms of quality;
f. to be clear about what they do best in-house and what they can contract out to others for what concerns not only public transport provision but also land use planning, road network developments, etc.;
g. to act to involve all the competent authorities in influencing public transport performance and all the participants in the system (like police committees or other operators who are not under the control of the authority) in the search for better public transport; quality partnerships with operators may be used in
19
addition to tenders and contracts and may help in establishing tariff co-operation;
h. to use tenders to promote quality management techniques by attaching importance to know-how and well-thought-out proposals in this respect; i. to be specific on whether they will accept non-compliant bids and, if so, how
they will consider and implement innovations;
j. to design penalty-and-reward systems in such a way as to avoid penalising the operator for matters beyond his control;
k. to commit on the achievement of targets under their own control (concerning for example the availability and quality of road and/or rail infrastructure) and if necessary to submit to penalty-and-reward mechanisms so as to reassure the bidders/contractors on the credibility of these commitments or to compensate them for the costs they might incur as a result of any failure by the authority to deliver the agreed conditions);
l. to try to develop with the operator(s) a working relationship favouring a co-operative attitude and stimulating innovativeness on the part of both parties; m. to be clear on what they expect from the contractual relationship;
n. to use a balanced basket of objective and subjective performance indicators to evaluate the effectiveness of their programme and to try to involve customers in service quality assessment;
o. to encourage a positive “no blame” culture in their organisation and to try to achieve excellence in management through established principles;
p. to act as a learning organisation within the system, resorting to internal and external benchmarking with other cities and with other sectors to identify improvement opportunities: benchmarking may provide innovative and implementable solutions by looking at how traffic/mobility/public transport management but also other sectors (tourism, leisure, shopping centres, etc.) work in other cities;
q. to build experience in real situations by regularly using public transport themselves;
20
r. in their specific regulatory system, to use contracts, tenders and licensing to stimulate the operators to take the decision and orientations described hereafter.
Quattro recommends vehicle manufacturer:
a. to recognise that customer demands are driving the market, not the operators or the authorities’ wishes;
b. to be ready to respond and support innovation in equipment design; c. to fully support the operator by the establishment of adequate after-sales d. services;
e. to make customer-supplier chains an accepted business practice; f. to benchmark against competitors and other industries;
g. to seek to establish a visible professional competence by reaching standards set
h. for formal qualification (ISO 9000, XP X 50-805) and/or by implementing total
i. quality management principles at their level;
j. to achieve excellence in management and operations through established k. management principles (e.g. EFQM).
Quattro set and defined quality determinants for UPT with considering passengers’ needs and expectations. There are 8 determinants, which are illustrated in Table 2.3 with their definitions. These determinants are useful when public transport companies set service commitments.
21
Table 2.3 : Definitions of quality determinants
Quality Determinants Definition
Availability basic coverage of the service, in geography, time and transport mode.
Accessibility the interface with other transport modes and the physical access to transport services.
Information covers the availability of information pertinent to the planning and execution of a journey or a pattern of journeys.
Time used for planning and executing a journey or a pattern of journeys.
Customer care contains the elements needed to make the journey(s) easier and more pleasant, typically through human presence. Comfort the physical comfort obtained though the design of or use
of
installations and vehicles/vessels, or resulting from ambient conditions.
Security actual degree of safety from crime or accidents and the feeling of security resulting from that and from other psychological factors.
Environmental Impact the different effects on the environment resulting from public transport.
Source: QUATTRO, 1998, Final report synthesis and recommendations, Brussels
The CEN established a quality standard, EN 13816 Service Quality Standard for Public Transports in connection with Quattro research and final report. The main purpose of the standard is promote a quality approach to public transport operations and focus interest on customers’ needs and expectations, by specifying procedures most likely to:
22
ii. Lead to relevant and well-founded decisions particularly with regard to the allocation of responsibilities
iii. Enable customers, and others, to compare service quality claims from alternative reliably
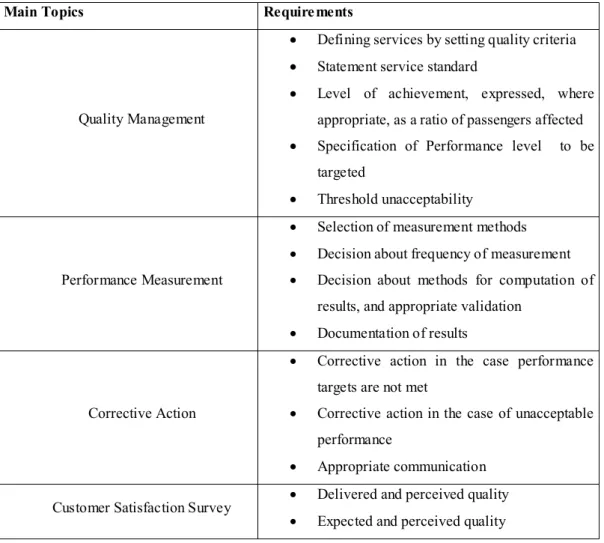
iv. Contribute to the implementation of a process of continuous improvement Four main topics following in Table 2.4 with their contents are mentioned in the standard as requirements.
Table 2.4 : Main topics and requirements according to EN 13816 Main Topics Requirements
Quality Management
• Defining services by setting quality criteria • Statement service standard
• Level of achievement, expressed, where appropriate, as a ratio of passengers affected • Specification of Performance level to be
targeted
• Threshold unacceptability
Performance Measurement
• Selection of measurement methods • Decision about frequency of measurement • Decision about methods for computation of
results, and appropriate validation • Documentation of results
Corrective Action
• Corrective action in the case performance targets are not met
• Corrective action in the case of unacceptable performance
• Appropriate communication Customer Satisfaction Survey • Delivered and perceived quality
• Expected and perceived quality
Source: European Committee for Standardization, 2002, EN-13816 Transportation-Logistics and services-public passenger transport- service quality definition, targeting and measurement, Brussels
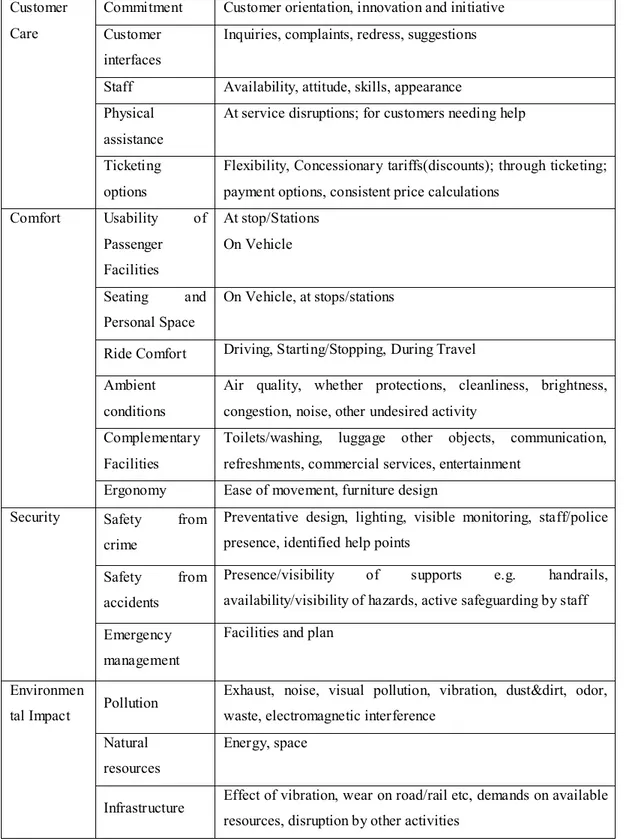
Service quality is defined as quality criteria under 3 Level. Quattro Project sets level 1 as service determinants, Level 2 and CEN team sets Level 3. Table 2.5 illustrates
23
the quality criteria according to their level. The operator should select additional criteria from Level 2 and Level 3 in accordance with his needs and preference for the particular service being defined (CEN, 2002)
Table 2.5 Distribution of quality criteria according to their level
Level 1 Level 2 Level 3
Modes -
Network Distance to stop/stations; need for transfers; area covered
Operation Operating hours; frequency Suitability -
Availability
Dependability -
External interface Pedestrians; cyclist; taxi users; private car users;
Internal interface
Entrances / exits to
stops / stations; internal movement in vehicles
Accessibility
Ticketing availability Home ticketing; ticketing within system; ticketing at other locations
General information Availability; accessibility; time customer care; comfort; security; environment
Travel information in normal conditions
Street directions; stop/station identity; vehicle direction; route; time; fare; type of ticket
Information
Travel information abnormal conditions
Current network status; suggested alternative; refund/redress; suggestions and complaints; lost property
Length of travel time Trip planning, access, egress, at platforms ,transfer points, in vehicle
Time
Adherence to schedule Punctuality, reliability
Source: European Committee for Standardization, 2002, EN-13816 Transportation-Logistics and services-public passenger transport- service quality definition, targeting and measurement, Brussels
24
Table 2.5 : Distribution of Quality criteria according to their level (continued)
Commitment Customer orientation, innovation and initiative Customer
interfaces
Inquiries, complaints, redress, suggestions Staff Availability, attitude, skills, appearance Physical
assistance
At service disruptions; for customers needing help Customer
Care
Ticketing options
Flexibility, Concessionary tariffs(discounts); through ticketing; payment options, consistent price calculations
Usability of Passenger Facilities At stop/Stations On Vehicle Seating and Personal Space On Vehicle, at stops/stations
Ride Comfort Driving, Starting/Stopping, During Travel Ambient
conditions
Air quality, whether protections, cleanliness, brightness, congestion, noise, other undesired activity
Complementary Facilities
Toilets/washing, luggage other objects, communication, refreshments, commercial services, entertainment
Comfort
Ergonomy Ease of movement, furniture design Safety from
crime
Preventative design, lighting, visible monitoring, staff/police presence, identified help points
Safety from accidents
Presence/visibility of supports e.g. handrails, availability/visibility of hazards, active safeguarding by staff Security
Emergency management
Facilities and plan
Pollution Exhaust, noise, visual pollution, vibration, dust&dirt, odor, waste, electromagnetic interference
Natural resources
Energy, space Environmen
tal Impact
Infrastructure Effect of vibration, wear on road/rail etc, demands on available resources, disruption by other activities
Source: European Committee for Standardization, 2002, EN-13816 Transportation-Logistics and services-public passenger transport- service quality definition, targeting and measurement, Brussels
25
In measuring the quality of service performance for each criterion , appropriate methods shall be used. EN 13816 recommends three measurement methods, which are customer satisfaction survey, mystery shopping survey and direct performance measurement.
2.4.1.2 America example
American Transit Cooperative Research Program (TCRP) implemented a comprehensive research program, with analyzing performance measurement system of American public transport companies, in order to establish a guidebook for developing a transport performance measuring system. At the end of the research (2003), a report is published by TCRP. The report includes the service delivery standards and performance measurement methods of the public transport operators.
2.4.1.2.1 Service dimensions and service criteria in American companies
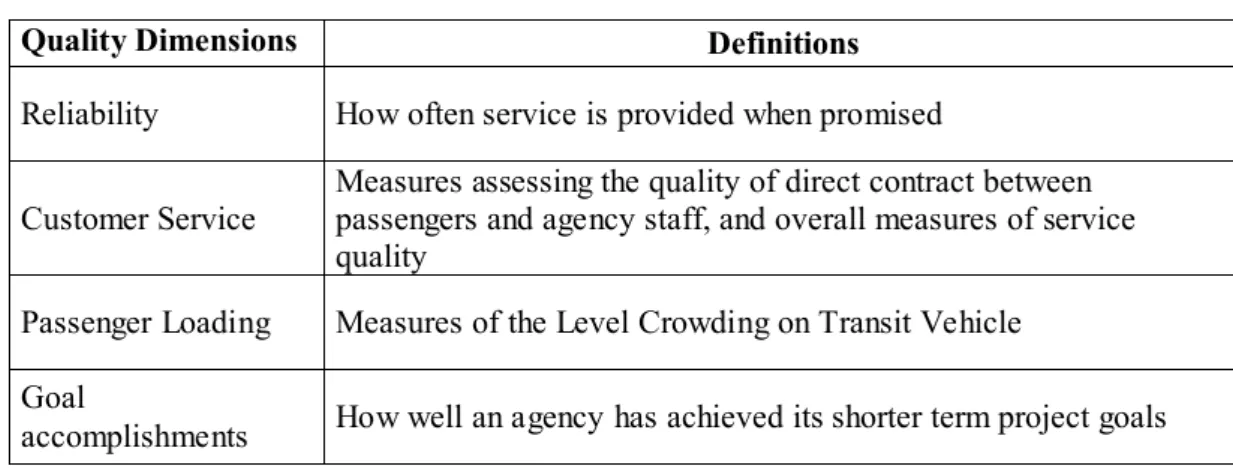
American public transport companies set service dimensions within performance management program. In the program the service dimensions and quality criteria are defined and measured as well as the economical performance. They set in generally in four service dimensions as performance indicators within service delivery. They indicate the quality of service for the public transport operators. Table 2.6 illustrates the quality dimensions and definitions.
Table 2.6 : Quality dimensions defined by American companies Quality Dimensions Definitions
Reliability How often service is provided when promised
Customer Service
Measures assessing the quality of direct contract between passengers and agency staff, and overall measures of service quality
Passenger Loading Measures of the Level Crowding on Transit Vehicle
Goal
accomplishments How well an agency has achieved its shorter term project goals
Source: TCRP, 2003, A guidebook for developing a transit performance measurement system, Washington: Transit Research Board
26
Table 2.7 illustrates the detail of programs conducted by public transport companies. It includes dimensions and the quality criteria which companies are measured. Within the frame of quality program, each quality criterion is defined in detail in order to establish service delivery standard and every criterion has a performance target. Although there are some differences in implementation phase between European and American approaches in quality programs, EN 13816, established by CEN, includes all the quality criteria, which are considered within performance measurement program by American Transport Company.
Table 2.7 : The details of American quality programs
Dimension Quality Criteria Example Target values Data Requirement
Headway Regularity Service regularity: 85 for peak conditions and 90 % off peak conditions
• Field surveys or Automatic Vehicle Location Data Missed Trips • %98 completed trip • Schedule
• Dispatching Logs Percent Of Scheduled
Vehicles • %99 %scheduled buses were placed into service • Schedule • Dispatching Logs Reliability
Equipment Reliability • Reliability of escalator is %96 • Repair Log • Length of Service Day
Complaint Rate • 17 complaints per 100,000 boarding • Boarding Passengers • Documented Complaints Percent of Missed
Phone Calls • %99 calls connected with agent • Phone Monitoring System Percent of Call Held
Excessively Long • Maximum time on hold 2 minutes • Phone Monitoring System Customer Service
Response Time Response within • 2 working days for phone inquiries;
• 6 working days for letter inquiries
• Date and time of response
Staff Courtesy • %80 positive rating in a customer survey • Mystery Shopping Survey • Customer Complaints • Customer Satisfaction Surveys • Focus Groups Passenger Environment (Rail Vehicles)
• %93 of Trains have no litter or light litter
• %98 trains have no broken door panels • Checklist results Customer Service Passenger Environment (Rail Stations)
• %90 of Stations have no litter or
light litter • Checklist results
Passenger
Loading Passenger Load- • Less than value of 1.50 • Passenger Counts • Area per passenger
27
Table 2.7 : The details of American quality programs (continued)
Dimension Quality Criteria Example Target values Data Requirement
Action Achieved • Award contract for Southeast
Corridor design/build package • List of planned projects, with their scheduled and actual completion date Goal
accomplishments
Percent of Goal
Achieved • Acquire right of way for Southeast Corridor, • Thornton park-and-ride
expansion, %50 targeted
• List of planned projects, with their scheduled and actual completion date and number of people or items affected Source: TCRP, 2003, A guidebook for developing a transit performance measurement system. Washington: Transit Research Board
2.4.1.2.2 Performance measurement methods
Although most agencies do not have the resources to conduct the same level of customer satisfaction surveys, larger systems often have the resources for annual sector (TCRP 2003). In the surveys, customer perceptions and expectations are defined. Passenger Environment Survey (PES) measures quality criteria such as cleanliness. The following sections briefly describe the PES programs developed by two agencies, MTA-NYCT and the Bay Area Rapid Transit District (BART).
2.4.1.2.3 MTA-NYCT example
MTA-NYCT’s PES is a customer-oriented set of indicators generated quarterly by operations planning to measure customer perceptions of the environment in subway stations, subway cars, and buses (TCRP 2003). Table 2.8 provides PES indicators, criteria, and descriptions for metro vehicles. Table 2.9 provides similar information for subway and busway stations.
28
Table 2.8 : MTA-NYCT passenger environment survey indicators: vehicle
Indicator Criteria Description/Definitio n
Presence of litter(measured at the terminal) None, Light, Moderate, or Heavy Cleanliness of floors and seats (measured at the terminal) None, Light,
Moderate, or Heavy Presence of litter (through out the day) None, Light,
Moderate, or Heavy Cleanliness of floors and seats (throughout the day) None, Light,
Moderate, or Heavy Present cars with no interior graffiti Yes, No
Present cars with no exterior graffiti Yes, No Percent cars with no graffiti on windows Yes, No Cleanliness
And Appearance
Percent cars with no broken or cracked Windows Yes, No Percent cars with all system maps correct/legible Yes, No Percent cars with all signage correct Yes, No Customer
Information
Percent cars with public address announcement Percent of correct announcements versus
total potential announcements
expected Percent cars with no broken door panels
Lighting conditions in cars Percent cars with at
least %90 of lights on; car surveyed outside during daylight hours are not rated
Functioning
Equipment Climate conditions in cars Percent cars with
average interior temperature between 50F and 78F or at least 75% of fans operating when above 78F Operations Percent conductors proper uniform
Source: TCRP, 2003, A guidebook for developing a transit performance measurement system, Washington: Transit Research Board
29
Table 2.9 : MTA-NYCT passenger environment survey indicators: stations
Indicator Criteria Description/Definition
Presence of litter None, Light, Moderate, or Heavy Cleanliness of floors and seats None, Light, Moderate, or Heavy Presence of litter None, Light, Moderate, or Heavy Cleanliness of floors and seats None, Light, Moderate, or Heavy Cleanliness
And Appearance
Presence of graffiti None, Light, Moderate, or Heavy
Station delay announcements
Understandable / Correct,
Partially Understandable / Correct, Marginally Understandable / Correct, Not
Understandable/Correct Percent stations with legible correct
system maps
At least one map in both paid and unpaid areas; minor service changes must be updated within the quarter
Percent stations with correct Passenger Information Center
Minor service changes must be updated within the quarter
Customer Information
Percent Station Control Areas with a metro map available
Minor service changes must be updated within the quarter
Percent Stations with functional enunciator (where applicable)
Percent cars with at least %90 of lights on; car surveyed outside during daylight hours are not rated Percent escalators/elevators in
operation
Percent cars with average interior temperature between 50F and 78F or at least 75% of fans operating when above 78F
Percent station public telephones in working order
Degree of understandability / correctness per delay occurrence
Percent trash receptacles usable in stations
Measured by placing a call and/or listening for a dial tone
Percent station control areas with working sale office microphone
Yes, No Functioning
Equipment
Percent working turnstile High entrance and exit turnstiles not included Percent sale agents wear uniform Yes, No
Operations
Percent sale agents properly displaying badges
Yes, No
Source: TCRP, 2003, A guidebook for developing a transit performance measurement system, Washington: Transit Research Board
30
PES is similar measurement methodology with Mystery Shopper Survey, which is recommended by EN 13816 as a measurement tool.
2.4.1.2.4 BART example
The PES program is intended to make sure that a high-quality riding environment is provided and that the quality improves over time. Table 2.10 illustrates the indicators and criteria considered in the PES.
Table 2.10 : BART passenger environment survey indicators Indicator Criteria
Facilities management • station patio cleanliness • parking lot cleanliness • landscape appearance Station operations • station restroom cleanliness
• station graffiti
• advertising signs in stations • brochures in kioks
Station agent • agent available or sign in place • agent in uniform
• agent wearing name badge
BART police • BART police personnel in stations
• BART police personnel in parking lots/garages • BART police personnel on trains;
Public address announcements • station arrival announcements • transfer announcements • destination announcements
Rolling stock • train exterior graffiti
• train doors operative • train interior graffiti • train interior cleanliness • train window etching • temperature on trains • advertising signs on trains
Source: A. Weinstein, R. Album, 1998. Securing objective data on the quality of the passenger environment transit riders: Redesign of the passenger environment measurement system for the Bay Area Rapid Transit District.
31
In addition to PES, recording performance detail automatically uses a measurement system. This measurement is similar with direct performance measurement, which is recommended by CEN.
Table 2.11 : Measurements by recording automatically
Criteria Sub criteria
Elevator/escalator availability station elevator availability escalator availability (street) escalator availability (platform); Fare collection availability fare gate availability
ticket vending machine
availability
On-time performance train on time
Source: A. Weinstein, R. Albom, 1998. Securing objective data on the quality of the passenger environment transit riders: Redesign of the passenger environment measurement system for the Bay Area Rapid Transit District.
32
3. DATA AND METHOD
3. 1 ISTANBUL ULASIM IMPLEMENTATION
SQMS consists of two main parts, which are establishing Service Delivery Standard and developing Performance Measurement Methods. Service Delivery Standard is a key factor that how passengers’ needs and expectations are met. Hence, passengers’ needs and expectations are important input for the standard. In addition, technical and economical capacities are determinative factors for the standard. After the standard is began to implement, the performance and perceive level is measured by performance measurement methods and customer satisfaction surbey. Figure 3.1, based on EN 13816 Standard’s Service Quality Loop, summarizes instruction of the SQMS which is developed within this study at M2 metro line.
Perceived Service Level Expected Service Level Performed Service Level Targeted Service Level (Service Delivery Standard) Mystery Shopper Survey Direct Performance Measurement Customer Satisfaction Survey
Metro Passengers Istanbul Ulasim Figure 3.1 : Service quality loop
Source: European Committee for Standardization, 2002, EN-13816 Transportation-Logistics and services-public passenger transport- service quality definition, targeting and measurement, Brussels
33 3.1.1 Service Delivery Standard
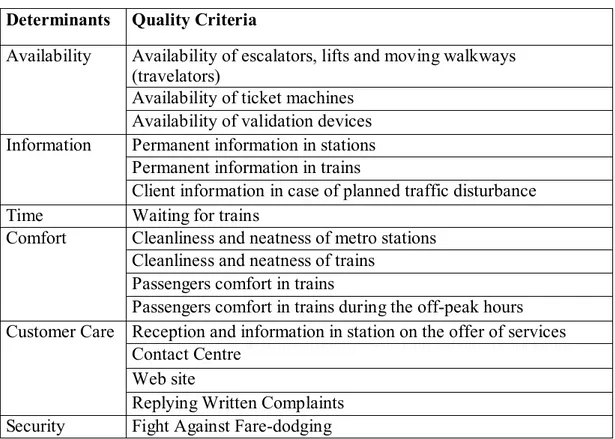
Service Delivery Standard, explains how to deliver services to customers in stations, trains, and supporter services such as call center, web site. In order to establishing standard, the quality criteria have to be determined. Determinants and criteria are determined for metro line with respect to table 2.4, which is published by EN 13816. Determinants and quality criteria are shown in table 3.1.
Table 3.1 : Determinants and quality criteria Determinants Quality Criteria
Availability of escalators, lifts and moving walkways (travelators)
Availability of ticket machines Availability
Availability of validation devices Permanent information in stations Permanent information in trains Information
Client information in case of planned traffic disturbance Time Waiting for trains
Cleanliness and neatness of metro stations Cleanliness and neatness of trains
Passengers comfort in trains Comfort
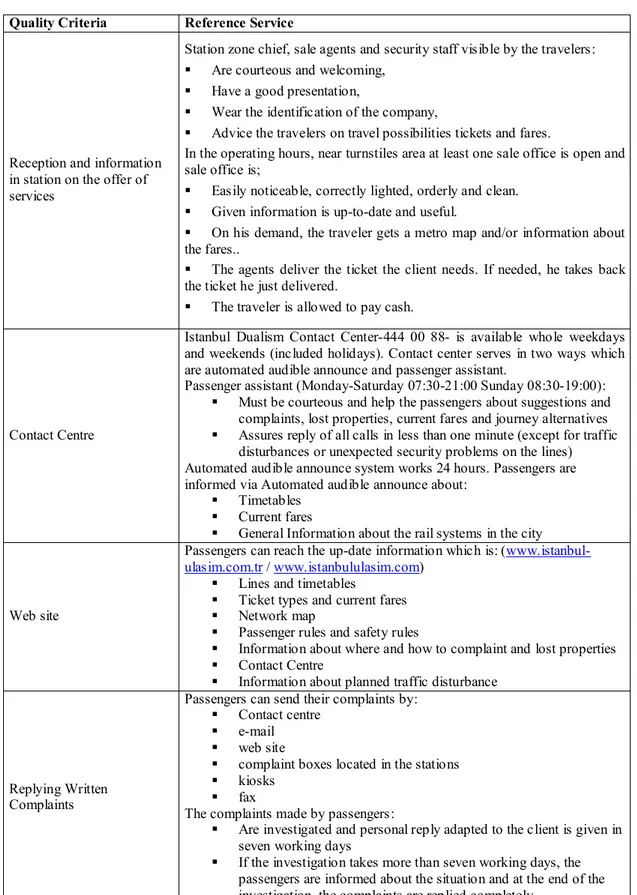
Passengers comfort in trains during the off-peak hours Reception and information in station on the offer of services Contact Centre
Web site Customer Care
Replying Written Complaints Security Fight Against Fare-dodging
AFNOR, which is French Certification Company, published NF 286 Specific Certification Rules of Urban Public Transport Services with respect to EN 13816. Service delivery standard for metro line is established according to NF 286 after determining quality criteria.
In addition to service determinants and quality criteria, standard covers service criteria, reference service, and requirement level, unacceptable situations that are defined in detail. Reference services, express the detail of the services for each criterion. Requirement level is a target that performance of the criterion should be reached. unacceptable situations are undesired situations.
34 3.1.1.1 Reference Services
Reference services are established for all quality criteria. In tables 3,2, 3.3, 3.4, 3.5, 3.6, 3.7, references services are defined according to service determinants and quality criteria.
Table 3.2 : Reference services of quality criteria related with availability Quality Criteria Reference Services
Availability of escalators, lifts and moving
walkways (travelators)
When a passenger wants to use escalators and elevators, these devices must be in operation (except the cases of restoration and maintenance).
Availability of ticket
machines In each station, at every equipped access, the traveler can upload his Akbil(=electronic ticket) at Akbil machines. The customer must pay the exact amount and he gets a confirmation of the upload.
In each station, at every equipped access, the traveler can buy a token at token machines.
He recovers his change and gets information on the monitor.
Availability of validation
devices The traveler can validate his ticket (akbil or token) no matter what validation machine he’s addressing to. One of the validation devices is accessible to all categories of users (PRM included).
35
Table 3.3 : Reference services of quality criteria related with information Quality Criteria Reference Services
Permanent information in stations
In the station relevant to the line, the traveler has at his disposal at least the following information legible and up-to-date:
• The name of the station visible from the whole length of the train;
• Useful information about where he can get a ticket;
• Different directions, exits and possible connections;
• Accessible maps of the rail system network; • Indication of frequencies during the day, timetable
in the evening and mention of the right time of the first and the last passage;
• Accessible district map with indication of accesses for the PRM;
• The principal current fares;
• The phone number of the Contact Centre • A clear signaling of the services, conveniences
(included for PRM) and security rules applicable in the station;
Permanent information in trains
Outside (First and last carriages) :
• The line number (front and rear indicators); • The vehicle destination (front indicator).
• Inside, the traveler has at least, on every platform, all the following information about the line, legible and up-to-date :
• A map of the line;
• Rules and advices about the use of the train, defined by the company;
• A map of the Metro network if technically possible (defined by the company);