HOW DID EXPORT-LED GROWTH STRATEGY WORK IN THE
TURKISH CASE? THE EXPERIENCE OF MANUFACTURING SECTOR
AFTER 1980
Article CITATIONS 3 READS 24 2 authors:Some of the authors of this publication are also working on these related projects:
macroeconomic instability and growthView project Kemal Kızılca
Ankara University
10PUBLICATIONS 7CITATIONS
SEE PROFILE
Kivilcim Metin Ozcan
Social Sciences University of Ankara
57PUBLICATIONS 814CITATIONS
HOW DID EXPORT-LED GROWTH STRATEGY WORK IN THE
TURKISH CASE?
THE EXPERIENCE OF MANUFACTURING SECTOR AFTER
1980
*F. Kemal Kızılca∗∗ and Kıvılcım Metin Özcan∗∗∗
I. INTRODUCTION
In 1980, the Turkish government made fundamental decisions to abandon the import-substitutionist development strategy and adopted an export-led growth approach. The measures taken were primarily aiming to restore the current account balance, lower the inflation rate, reduce public sector deficit and increase the growth rate which turned to negative values at the end of 1970s. Since that date, integrating the Turkish economy into the world markets and encouraging exports, either through direct subsidies or indirect ways such as investment supports, have been policy anchors for all governments. Customs taxes were reduced gradually until 1996, the year in which the Customs Union agreement between the European Union (EU) and Turkey was put into force. Liberalization of the capital account in 1989 was another step towards integration into the world economy, which left an unwanted side-effect on export performance by overvaluating the exchange rate caused by excessive borrowing.
Although Kindleberger is first known to have suggested “export-led growth” in 1962,1 the term’s use became widespread after the works
published by World Bank circles in late 1970s.2 These studies
underscored the importance of external orientation for developing
∗∗ Ankara University, Faculty of Law, [email protected] ∗∗∗ Bilkent University, Department of Economics, [email protected] 1 See Heitger (1987: 249)
2 Turkish economy was a special focus of interest in that literature. See Krueger (1974, 1978), Bhagwati (1982).
countries which were suffering from low growth rates and so-called rent-seeking activities. The expected benefits from external opening and increasing exports can be grouped in three main categories: Firstly, increased imports were supposed to put a downward pressure on mark-up ratios, as the “imports-as-market-discipline” hypothesis suggests. This would induce a decline in sector inflation rates, improving consumer welfare. Secondly, productivity gains were expected through (i) economies of scale effects, (ii) increased R&D activities stimulated by increased competition, (iii) positive externalities and (iv) residual effects like increased capacity utilization, X-efficiency, managerial efforts etc. (Bayar, 2002). Increased exports, thirdly, were expected to encourage a higher demand for labor, considering the labor-intensive nature of manufacturing industries in developing countries. This is the proposition of the well-known Stolper-Samuelson theory.
Increasing marginalization and the share of the informal economy in the developing world were not predicted consequences of external orientation in the export-led literature. Recent studies on the informal economy show that a significant part of GNP is structurally linked to the formal economy in developing and least developed countries (Chen, 2005). The process of informalization in industrial production ends up with the inability to export high value-added products into least developed countries (Robyn, 2001). Studies focusing on Turkish manufacturing also reveal that, with few exceptions, informal employment is a common characteristic of Turkish manufacturing firms.3
Informal production is widespread, especially in the textiles and apparel sectors, which supplied approximately 30% of the total manufacturing exports in 2000.4
Having been motivated by the previous literature, the aim of this paper is to explore the effects of increasing export orientation on the creation and distribution of value-added in the Turkish manufacturing industry at
a disaggregated level. To do so, changes in two value-added categories, namely mark-up and wage rates are investigated for the 4-digit manufacturing sectors between 1980 and 2000. Unlike the previous studies on the issue, dynamic panel data techniques and total factor productivity (TFP) growth calculations based on data envelopment analysis (DEA) are employed. Results show that export performance in Turkish manufacturing is historically based on (i) keeping wage costs low, (ii) non-taxation of and/or providing government subsidies to exporting sectors and (iii) low level of mark-up ratios.
The plan of the paper is as follows: Section II summarizes the phases of external orientation of the Turkish economy and the developments in Turkish economy after 1980. Section III summarizes the literature review on wages and mark-ups during trade liberalization. Section IV draws attention to some stylized facts of the Turkish manufacturing sectors. Section V provides the econometric analysis and summarizes the results. Finally Section VI concludes.
II. PHASES OF EXTERNAL ORIENTATION OF THE TURKISH ECONOMY
To overcome the foreign exchange crisis of late 1970’s, the Turkish government initiated an IMF-backed stabilization and structural adjustment program in January 1980. The main targets of the program were to increase foreign exchange earnings, reduce the public sector deficits, restore a positive industrial growth rate, and initiate a general transformation in the economy through liberalization of capital and goods markets.5
The most important step towards increasing foreign exchange earnings was the devaluation of Turkish lira approximately 50% against the US dollar. Moreover, to close the price scissors between official and “black market” prices, the Central Bank began to set the US dollar rate daily. To
5 More detailed analysis of Turkey’s post-1980 transformation can be found in Boratav et al. (2000).
promote exports, supports such as tax rebates, duty-free allowances and low-interest credits were granted to exporting firms. The total amount of subsidies reached up to 30% of the total value of exports in mid 1980’s.6 Promotion of exports via government resources brought a
new concept to the Turkish economic literature, called “fictitious exports.” To benefit from export subsidies, some firms were signing counterfeit trade contracts with their foreign partners. In most cases, those partners were offshore companies founded by the same businessman. Fictitious exports prevailed until the second half of 1990’s, when direct export promotions were lifted.
To reduce public sector deficits, the government first increased the prices of goods produced by state enterprises. The objective was to eliminate Treasury transfers to state enterprises by making them profitable. Starting from 1986, the state began to privatize these enterprises, a policy which carries on today. Another step towards reducing public sector deficits was the radical decreases in wages in this sector. Starting from the late 1970s, government support to agricultural products also decreased. This policy was kept during the 1980’s, causing a fast deterioration in the domestic terms of trade (Bilginsoy, 1997). Reductions in customs taxes, removal of government controls over prices and reductions in interest rates were the main steps towards liberalization and deregulation of markets. The reasoning behind customs tax reductions was to lower the importation costs of investment goods. By removing controls over financial markets, the government wanted to turn interest rates to positive values in order to be able to borrow domestically.
The military coup, which took place on 12 September 1980, also had important impacts on economic indicators. The army banned all political parties, all labor organizations including trade unions, and many other civil organizations. Coupled with previous efforts to reduce wages, real
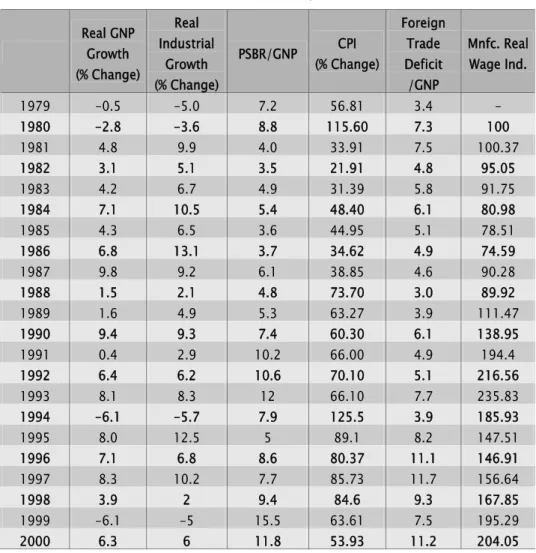
wages after 1980 started to fall drastically, as can be seen in Table 1. This continued until 1987, when general elections were held again.
Table 1: Selected Indicators of Turkish Economy: 1979-2000 Real GNP Growth (% Change) Real Industrial Growth (% Change) PSBR/GNP (% Change)CPI Foreign Trade Deficit /GNP Mnfc. Real Wage Ind. 1979 -0.5 -5.0 7.2 56.81 3.4 - 1980 -2.8 -3.6 8.8 115.60 7.3 100 1981 4.8 9.9 4.0 33.91 7.5 100.37 1982 3.1 5.1 3.5 21.91 4.8 95.05 1983 4.2 6.7 4.9 31.39 5.8 91.75 1984 7.1 10.5 5.4 48.40 6.1 80.98 1985 4.3 6.5 3.6 44.95 5.1 78.51 1986 6.8 13.1 3.7 34.62 4.9 74.59 1987 9.8 9.2 6.1 38.85 4.6 90.28 1988 1.5 2.1 4.8 73.70 3.0 89.92 1989 1.6 4.9 5.3 63.27 3.9 111.47 1990 9.4 9.3 7.4 60.30 6.1 138.95 1991 0.4 2.9 10.2 66.00 4.9 194.4 1992 6.4 6.2 10.6 70.10 5.1 216.56 1993 8.1 8.3 12 66.10 7.7 235.83 1994 -6.1 -5.7 7.9 125.5 3.9 185.93 1995 8.0 12.5 5 89.1 8.2 147.51 1996 7.1 6.8 8.6 80.37 11.1 146.91 1997 8.3 10.2 7.7 85.73 11.7 156.64 1998 3.9 2 9.4 84.6 9.3 167.85 1999 -6.1 -5 15.5 63.61 7.5 195.29 2000 6.3 6 11.8 53.93 11.2 204.05 Source: TURKSTAT
Policies designed to create an exportable surplus through the oppression of domestic demand seemed to yield fruit in the early 1980s. The foreign trade deficit kept declining until 1988. There was also a falling trend in the Public Sector Barowing Requirement (PSBR) and inflation rates (Table 1). However, with a return to electoral democracy in 1987, all economic variables started to converge to their initial values. Changes in labor
market conditions and the resurgence of political struggle were the two important reasons for this repetition of history. Graph 1 shows the relationship between election years, strikes (as an indicator of labor-class struggle) and percentage changes in manufacturing real wages. Vertical dashed lines in the graph show the election years. The other two lines show the number of strikes and the percentage change in real wages (the heavy, dashed line). Because all kinds of labor organizations were banned before 1984, there were no strikes. Starting from that date, the graph shows a clear connection between the numbers of strikes and rises in real wages until 1994, a year of economic crisis. An increase in strikes in election years is also observable. The restoration of democratic elections in 1987 had an apparent impact on the rising wage claims of the labor class. This process ended up with rising public sector and foreign trade deficits (see Table 1). Establishing macroeconomic stability through suppression of wages did not work under a democratic regime.
Graph 1: Strikes and Real Wages
0 50 100 150 200 250 300 350 400 450 500 1981 1982 1983 1984 1985 1986 1987 1988 1989 1990 1991 1992 1993 1994 1995 1996 1997 1998 1999 2000 S tr ikes -30.00 -20.00 -10.00 0.00 10.00 20.00 30.00 40.00 50.00 C h an g e i n R eal W a g e s
Number of Strikes Real Wages (Percentage Change)
When PSBR was climbing up and domestic savings were not sufficient to finance it, the government made a decision to liberalize the capital account in 1989. This was expected to attract foreign capital which could
lift the limits on government borrowing and foster economic growth in the short run.7
Turkey’s liberalization of the current and capital accounts was complete when the Customs Union agreement with the EU came into force. This agreement removed all customs - except agricultural taxes - between EU member countries and Turkey.
III. WAGES AND MARK-UPS DURING TRADE LIBERALIZATION: LITERATURE REVIEW
Previous studies dwelling on the issue of the effects of the current account liberalization on competition in the Turkish manufacturing industry raised the question whether decreasing customs taxes after 1980 had a squeezing effect on mark-up ratios. Among them, Levinsohn’s (1991) study, which covered the greater Istanbul region for the 1983-1986 period, concluded that with increasing imports, in four sectors out of a total of five, mark-up ratios were reduced while the estimation results for the remaining sector were found to be insignificant. Another study by Foroutan (1991) asserted that the reduction in the mark-ups remained at a very small rate for the period 1976-1985, with the possible explanation that profit margins were already at very low levels before opening up. Foroutan (1995) later expanded the previous research and reached similar results. Based on 4-digit manufacturing panel data for the years 1982, 1985 and 1989, Katırcıoğlu et al. (1995) asserted that the effect of imports on competition is related to the degree of concentration in corresponding sectors. After the liberalization of imports, mark-up ratios decreased only in sectors that had high CR4 ratios, while leaving no effect on the rest of the manufacturing industry. On the contrary, Yalçın (2000) asserted that while there was a general trend to decrease mark-up ratios after trade liberalization, for those sectors having higher levels of CR4
ratios this tendency was reversed. His study covered 4-digit manufacturing sectors for the period of 1983-1994. Another study raising the same question, Onaran and Yentürk (2002), explored the effects of real exchange rate, export ratios, imports ratios and production levels on the level of mark-ups at 3-digit level between 1980 and 1995. They concluded that mark-up ratios negatively correlate with real exchange rate (defined as TL/Forex basket) while showing a cyclical pattern with production growth. No meaningful relationship between foreign trade and mark-up ratios were found in their study. The issue of impact of openness on mark-up ratios was also analyzed in Köse and Yeldan (1998) and Metin-Özcan et al. (2002) at the three-digit level. They concluded that mark-up ratios are not responsive to foreign trade but are positively correlated with wage increases. Bayar (2002) asserted that there is a positive relationship between increasing import penetration and mark-up ratios in Turkish manufacturing, contrary to common expectations. Günçavdı and Orbay (2002), on the other hand, found negative correlation between those two variables while the coefficient is close to zero.
The above-mentioned studies on mark-up ratios during trade liberalization bring somewhat conflicting results. Possible explanations are: (i) different periods covered, (ii) sectoral details (i.e. 3- or 4-digit), (iii) methods used, and (iv) definitions used to describe openness. As openness indicators, some articles used export ratios and import penetration ratios separately, while the others employed separate ratios of total imports and exports divided by production level.
To our knowledge, there is no study scrutinizing the effects of foreign trade on real wages in Turkish manufacturing industry. However, some studies estimated the effects of labor market conditions on wage rates. Among them, Metin (1995) and İlkkaracan and Selim (2003) investigated the effects of unemployment on real wages and found negative relationship between the two. However, Metin (1995) asserts that the causality is from wages to unemployment, confirming neoclassical economics’ predictions. In addition
to unemployment rate, Onaran (2002) explores the effects of labor productivity and price expectations on wages. The effect of labor productivity on real wages was also investigated in Özmucur (2003), Boratav et al. (2000) and Demirel (2001). Among them, Boratav et al. (2000) did not find any causal relationship between the two, while the others do. Lastly, Erdil (1997) studied the effect of wage leadership in Turkish manufacturing and concluded that 50% of the private, and 35% of the public wage increases can be attributed to the wage increases of the leading sectors.
IV. SOME STYLIZED FACTS ON TURKISH MANUFACTURING SECTORS To draw the relationship between foreign trade and distribution of value added in Turkish manufacturing, we classify the 4-digit sectors based on their orientations in trade. In the literature, the T statistic offered by Krueger (1981) is mostly used for such classification. It is defined as,
M
X
Q
X
M
T
+
−
−
=
where M is imports, X is exports and Q is the production level. For those sectors where exports exceed imports, the statistic has a negative value. On the other hand, when T > 0, that sector can be classified as either competing or importing (non-competing), depending on the magnitude of T. The researcher decides on the critical points.
There is an important obstacle to the use of this criterion to classify Turkish manufacturing sectors: production and foreign trade statistics are collected by different institutions. Source of the production statistics is the Turkish Statistical Institute (TurkStat), while the foreign trade statistics are gathered by the Undersecretariat of the Prime Ministry for Foreign Trade. Firms which employ informal labor and want to refrain from taxation do not report true production numbers to the state institutions. On the other hand, foreign trade statistics are collected during border customs. As a result of the difference in data sources, the value of exports exceeds the value of
declared production values in some years, especially for textiles and apparels sectors. This problem was very common in the mid 1980s, when there were direct export-incentives from government budget.8
To overcome this difficulty arising from data problems, we use a simple statistic as
Q
X
M
Z
=
−
for classification. In 4-digit calculations, this statistic is likely to change its sign from one year to another. For this reason, instead of assuming that those sectors having a negative (positive) value of Z are exporters (importers) straight away, we use threshold values for classification. Sectors for which 0.4>Z>-0.2 are classified as “competing”, considering the fact that most of them are in this category. If a sector’s Z value is higher than 0.4, it is categorized as importing (non-competing). Sectors having a Z value lower than -0.2 are assumed to be exporters.
Table 2 shows the results based on sectoral Z values. In each category, the first column shows the relative size of the corresponding group of sectors, based on their share in total manufacturing output. The second column shows the real wage index. In real wage calculations, the average wage in total manufacturing industry in 1980 is assumed to be equal to 100. The last column shows the weighted average of mark-up ratios. Regarding wages, Table 2 shows us that starting from 1981, there is a general trend to fall until 1986. After that date, wages started to increase
8 There are some other possible explanations to this discrepancy in foreign trade statistics: Production data set covers firms that employ 10 or more workers. On the other hand, the foreign trade statistics are collected for all firms. Despite this fact, the divergence in foreign trade ratios arising from this discrepancy is negligible since more then 90% of the production in small-size firms is supplied to the domestic market (see Köse & Öncü, 1998). Another explanation would be the direct exports. However, this inconsistency is observed in textiles and apparels, in which Turkey is a producer country. Thus, informal production and
until the 1994 crisis. Between 1994 and 2000 there was also a gradual increase. Thus, findings in the previous sections for labor are valid for all sectors, regardless of their foreign trade orientations.
When we compare the wage series between three categories, we can see a clear distinction between exporting sectors and the other sectors, though. There is not a clear-cut difference between wages in competing and importing sectors. However, real wages in exporting sectors are lower than wages for the other sectors for all years, with no exception. Considering the fact that Turkey was a developing country specializing in labor-intensive goods in foreign trade, lower wages in exporting sectors may be considered normal. The paradoxical observation is, however, in 1998, the real wage index for exporting sectors was below its 1982 level. This brings us to the conclusion that the main objective of the post-1980 transformation in foreign trade regime was not to specialize in sectors where Turkey had a comparative advantage, but to create an exportable surplus by suppressing wages.
What does Table 2 tell us about the mark-up ratios? Mark-ups swing in the range of 30 to 50 percent in importing and competing sectors. After 1986, the range narrowed to 40 to 50 percent, showing a general increase. There is not an observable difference between those two sectors regarding mark-up ratios. On the other hand, as in the case of real wages, mark-mark-ups in exporting sectors are also clearly lower than the manufacturing average. These observations contradict with the “imports-as-market-discipline” hypothesis, which asserts that increasing imports put a downward pressure on mark-up ratios with increasing competition. In Turkish manufacturing, mark-up ratios are systematically higher in import-competing sectors than exporting sectors which are less open to foreign competition.
Briefly, the categorization of manufacturing industries based on their foreign trade orientation shows that (i) export performance is based on keeping wage costs low and, (ii) lower wages do not bring higher profitability in exporting sectors. With all resources reserved to improve exports, such as tax rebates, investment supports, subsidized credits and
all others, the public sector did not benefit from increasing exports either. Combining all these facts, it turns out that, export-led growth in the Turkish case stimulated specialization in low-value-added activities after 1980. In the next section we estimate these relationships by using econometric methods.
Table 2: Classification Of Manufacturing Sectors Exporting Sectors (Z<-0.2) Competing Sectors (-0.2<Z<0.4) Importing (non-competing) Sectors (0.4<Z) Years Relative Size Real WageIndex* Mark-up Ratio Relative Size Real Wage Index* Mark-up Ratio Relative Size Real Wage Index* Mark-up Ratio
1980 0.079 80.58 0.25 0.798 102.61 0.31 0.068 107.50 0.39 1981 0.062 80.09 0.27 0.762 107.69 0.37 0.074 109.33 0.33 1982 0.180 92.94 0.28 0.646 101.96 0.33 0.078 106.96 0.36 1983 0.173 89.46 0.27 0.658 97.32 0.32 0.078 105.07 0.32 1984 0.189 78.19 0.23 0.671 86.27 0.31 0.086 94.19 0.31 1985 0.214 74.59 0.41 0.653 84.98 0.30 0.063 94.90 0.36 1986 0.074 59.72 0.30 0.752 81.15 0.47 0.096 73.34 0.49 1987 0.059 60.79 0.30 0.759 91.44 0.40 0.099 84.17 0.45 1988 0.069 65.05 0.38 0.769 85.25 0.47 0.075 91.44 0.42 1989 0.060 71.16 0.31 0.761 111.76 0.43 0.083 88.86 0.42 1990 0.057 83.28 0.31 0.781 144.78 0.44 0.066 99.24 0.43 1991 0.062 119.86 0.29 0.783 204.87 0.45 0.072 131.20 0.40 1992 0.061 112.16 0.30 0.764 203.77 0.45 0.086 155.99 0.43 1993 0.063 123.95 0.27 0.762 218.26 0.48 0.090 179.81 0.38 1994 0.101 110.81 0.33 0.722 164.53 0.50 0.087 130.53 0.57 1995 0.092 87.29 0.32 0.699 155.51 0.49 0.118 144.48 0.54 1996 0.097 86.30 0.36 0.676 161.42 0.46 0.133 126.12 0.42 1997 0.113 90.45 0.32 0.618 161.77 0.48 0.186 150.26 0.44 1998 0.097 92.27 0.32 0.605 155.89 0.47 0.223 188.46 0.38 1999 0.114 107.77 0.29 0.641 185.30 0.35 0.164 221.59 0.43 2000 0.089 106.52 0.29 0.575 185.76 0.39 0.263 219.49 0.32
V. ECONOMETRIC ANALYSIS Data
To overcome the difficulties arising from aggregation problems, we use 4-digit manufacturing industry statistics covering the period 1980-2000,9 which is the largest industrial data set published by Turkstat.
Working on 4-digit levels and a 21-year period increases the degrees of freedom in regression analysis and provides robust results.10
Lagged values of mark-up ratios and real wage increases are also used as explanatory variables, as well as others, in the estimations. This requires the use of the generalized method of moments (GMM) dynamic panel data estimation procedure proposed by Arellano and Bond (1991). The use of a lagged dependent variable is both an empirical and a theoretical necessity for this study. Due to the extremely high level of inflation rates in Turkey (Table 1), almost all variables are affected by their past values. Hence, a model allowing for the inertia that exists in all prices and wages is needed.
On the theoretical grounds, the nature of mark-up pricing should be considered. Following the literature, we calculate mark-up ratios as profits divided by variable costs. Calculated mark-ups can either be a result of the amount of the profits remaining at the firms as a residual in a competitive environment, or a previously determined coefficient set by the firms, which affect product prices. If the mark-up ratios are set by firms operating in oligopolistic market structures as proposed by Kalecki (1971), the second case should be valid and they are expected to be historically determined. Thus, it is vital to include the lagged values in estimation to see whether the calculated mark-up ratios are residuals or results of an oligopolistic pricing behavior.
9 After 2000 TurkStat changed the classification of industrial statistics to meet the EU standards. Therefore we had to limit ourselves by this year.
10 Eviews 5.0 is used for all estimations. TFP growth rates are calculated with DEAP
Estimation Methodology
In the analysis, five different methods are used and reported in Table 3. In the table, the first column reports the estimation with no lagged dependent variable. A generalized least squares (GLS) method with cross-section weights is used to account for cross sectional heteroscedasticity. Columns II and III report one-stage GMM estimations, while columns IV and V report two-stage estimations. Arellano and Bond (1991) and Arellano and Bover (1995) suggest two different transformations to remove fixed effects: first differences and orthogonal deviations. Equations are estimated both ways. The most appropriate estimation method is chosen using diagnostic statistics as criteria. In all estimations, lagged values of explanatory variables are instrumented on the lagged dependent variable. The reported Sargan statistic tests appropriateness of instrument variables, with a
χ
2distribution under the null of instruments are correlated with the lagged dependent variable. AC1 and AC2 show first and second order residual autocorrelation, respectively.
Empirical Model
Estimated mark-up model is:
it it
t i
it
a
MARKUP
a
PRIVSHARE
a
HERF
MARKUP
=
α
0+
1 ,−1+
2+
3(
)
it itit
a
HERF
IMPRATIO
a
EXPRATIO
IMPRATIO
a
4+
5*
+
6+
+
a
7(
CAPITAL
/
OUTPUT
)
itwhere MARKUP is the level of sectoral mark-up ratio, PRIVESHARE is the private sector’s share in total employment, HERF is Herfindahl index, which measures the degree of concentration, IMPRATIO is the imports ratio (M/Q), EXPRATIO is the exports ratio (X/Q), and CAPITAL is the capital stock proxied by installed horse-power.
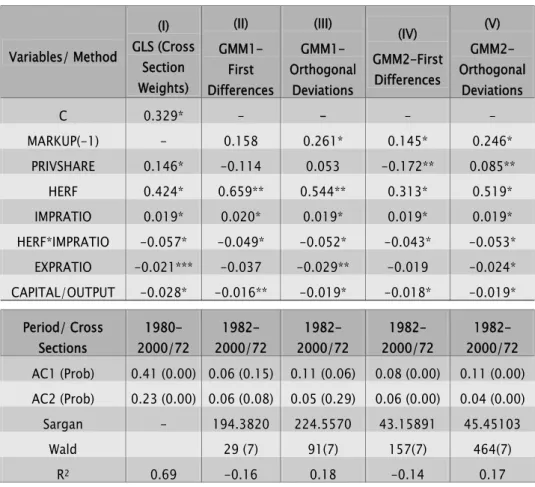
If mark-up ratios are historically determined as mentioned in the previous section, the expected sign of the lagged dependent variable is positive. PRIVSHARE is also expected to have a positive sign considering the profit-maximizing behavior of the private sector. In the mark-up pricing literature, concentration ratio is considered to be the main factor affecting mark-up. Thus, firms operating in a sector with a higher Herfindahl index are expected to have higher mark-ups. The coefficient of IMPRATIO should have a negative sign, if imports-as-market-discipline hypothesis is valid. Following the literature (Katırcıoğlu et al., 1995 and Yalçın, 2000), we also added an interaction term (HERF*IMPRATIO) which measures effects of imports in different concentration levels. It is hard to guess the sign of the coefficient of EXPRATIO a priori. If exporting firms are price-discriminating between domestic and foreign markets, mark-ups are expected to increase with increasing exports. However, observations in Section III imply that increasing exports do not lead to higher mark-ups. Lastly, mark-up pricing literature also expects CAPITAL/OUTPUT ratio, which measures the degree of capital intensiveness of production, to have a positive impact on mark-up. Estimation results are shown in Table 3.
The signs of the estimated coefficients do not vary across the estimation methods significantly, except for PRIVSHARE. It is very unrealistic for PRIVSHARE to have a negative sign. So, the first difference-transformed estimations (columns II and IV) do not seem to be the appropriate forms of estimation.11 The GLS estimation (column I) shows strong residual
autocorrelation, probably because of omitted lagged dependent variable. The calculated Sargan statistic shows that instrument choice is valid in the GMM2 estimation (column V). There is no robust statistic applicable to GMM1 estimations if the errors are not independent and identically-distributed. Either GMM1 or GMM2 estimations with orthogonal deviations, which produce very similar coefficients (columns III and V), can be used to interpret the results. All estimated coefficients in column V are significant. The coefficient of the lagged dependent variable is also
Table 3: Mark-Up Estimations (Dependent Variable: MARKUP) Variables/ Method (I) GLS (Cross Section Weights) (II) GMM1- First Differences (III) GMM1- Orthogonal Deviations (IV) GMM2-First Differences (V) GMM2-Orthogonal Deviations C 0.329* - - - - MARKUP(-1) - 0.158 0.261* 0.145* 0.246* PRIVSHARE 0.146* -0.114 0.053 -0.172** 0.085** HERF 0.424* 0.659** 0.544** 0.313* 0.519* IMPRATIO 0.019* 0.020* 0.019* 0.019* 0.019* HERF*IMPRATIO -0.057* -0.049* -0.052* -0.043* -0.053* EXPRATIO -0.021*** -0.037 -0.029** -0.019 -0.024* CAPITAL/OUTPUT -0.028* -0.016** -0.019* -0.018* -0.019* Period/ Cross Sections 1980-2000/72 1982-2000/72 1982-2000/72 1982-2000/72 1982-2000/72 AC1 (Prob) 0.41 (0.00) 0.06 (0.15) 0.11 (0.06) 0.08 (0.00) 0.11 (0.00) AC2 (Prob) 0.23 (0.00) 0.06 (0.08) 0.05 (0.29) 0.06 (0.00) 0.04 (0.00) Sargan - 194.3820 224.5570 43.15891 45.45103 Wald 29 (7) 91(7) 157(7) 464(7) R2 0.69 -0.16 0.18 -0.14 0.17 * Significant at 1% level ** Significant at 5% level *** Significant at 10 % level
high (0.25) and significant at the 1% level. This underscores the importance of estimating mark-up ratios in a dynamic model. Despite PRIVSHARE’s coefficient being positive and significant, its magnitude is lower than expected. It is insignificant in the GMM1 estimation (column III). The coefficient of HERF is significant and high as the mark-up theory suggests. However, CAPITAL/OUTPUT gets a negative coefficient, contradicting with expectations of mark-up pricing literature. A similar conclusion is reached in Katırcıoğlu et al. (1995). A possible explanation is that mark-up ratios have a cyclical correlation with the denominator of
this ratio. If capacity utilization rates affect mark-ups in Kaleckian sense, increased production should also have an effect mark-ups, when the capital stock constant.
Estimated coefficients of foreign trade variables produces striking results: There is a positive relationship between increasing imports and mark-up ratios as opposed to the predictions of imports-as-market-discipline hypothesis. This may be a result of oligopolistic structures in originating markets. However, when import ratios and concentration ratios interact, the coefficient gets a negative value. This complies with the results obtained in Katırcıoğlu et al. (1995) which assert that, while there is a general tendency to rise in mark-ups with increasing imports, this tendency is reversed for highly-concentrated sectors.
Lastly, the coefficient of EXPRATIO is significant and negative, which complies with the findings of Section III. This conclusion is particularly important, considering all policies used since 1980 that have attempted to increase exports to foster economic growth. Increasing exports did not bring profitability - an observation which contradicts the assertions of the proponents of export-led growth.
We also estimate changes in the logarithm of real wage indexes, with similar explanatory variables:
it it
it t
i
it
WAGE
HERF
PRIVSHARE
TFPCHNG
WAGE
=
+
Δ
+
Δ
+
Δ
+
Δ
ln
α
0ln
,−1 t it itEXPRATIO
STRIKES
IMPRATIO
+
Δ
+
Δ
+
where TFPCHNG is TFP growth rate for each sector. STRIKES is the number of strikes in the manufacturing as a whole. Because of the lack of detailed labor market data in Turkey, we are not able to use strike numbers for each sector separately. Expected sign of HERF is uncertain. If firms having higher market-power are employing more skilled workers, there should be a positive relationship between WAGE and HERF. On the other hand, a higher market power may also imply a stronger resistance to wage claims
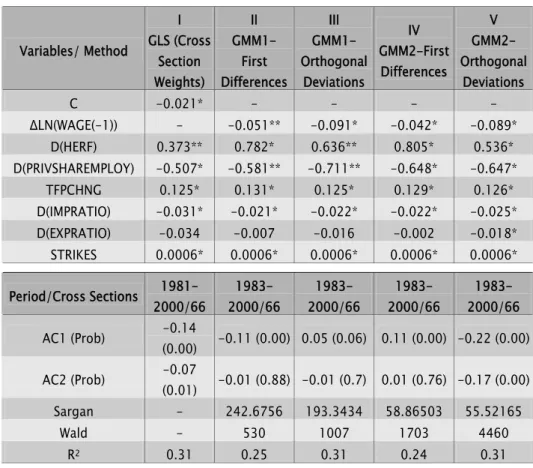
of labor unions, which may result in lower wages. The coefficient of PRIVESHARE is expected to have a negative sign. Profit-maximizing private sector firms usually pay lower wages to reduce costs. In public enterprises, on the other hand, wages are kept higher, sometimes for political reasons. TFPCHNG and STRIKES are also expected to affect wage increases positively. Increasing import ratios (IMPRATIO) are expected to affect demand for domestic production negatively. This would also decrease the demand for labor in import-competing sectors, thus putting downward pressure on real wages. Increasing exports, on the other hand, should have a positive effect on real wages, because of rising demand for labor. However, the data tabulated in Section III does not confirm this expectation. Thus, the expected sign of the coefficient of IMPRATIO is positive, while it is uncertain for EXPRATIO. Results of the estimation are reported in Table 4.
All methods of estimations produce similar results, which gives support to the form of the wage equation. Calculated Sargan statistics show that the instrument choice is correct for GMM2 estimations. However, in model V, second order autocorrelation is found, which results in inefficient estimation of coefficients (Arellano and Bond, 1991). The other estimations, which produce identical signs of coefficients and similar degrees of significance, are free of second order autocorrelation.
Table 4: Real Wage Changes (Dependent Variable: ΔLN(WAGE)) Variables/ Method I GLS (Cross Section Weights) II GMM1- First Differences III GMM1-Orthogonal Deviations IV GMM2-First Differences V GMM2-Orthogonal Deviations C -0.021* - - - - ΔLN(WAGE(-1)) - -0.051** -0.091* -0.042* -0.089* D(HERF) 0.373** 0.782* 0.636** 0.805* 0.536* D(PRIVSHAREMPLOY) -0.507* -0.581** -0.711** -0.648* -0.647* TFPCHNG 0.125* 0.131* 0.125* 0.129* 0.126* D(IMPRATIO) -0.031* -0.021* -0.022* -0.022* -0.025* D(EXPRATIO) -0.034 -0.007 -0.016 -0.002 -0.018* STRIKES 0.0006* 0.0006* 0.0006* 0.0006* 0.0006* Period/Cross Sections 2000/66 1981- 2000/66 1983- 2000/66 1983- 2000/66 1983- 2000/66 1983-AC1 (Prob) (0.00) -0.14 -0.11 (0.00) 0.05 (0.06) 0.11 (0.00) -0.22 (0.00) AC2 (Prob) -0.07 (0.01) -0.01 (0.88) -0.01 (0.7) 0.01 (0.76) -0.17 (0.00) Sargan - 242.6756 193.3434 58.86503 55.52165 Wald - 530 1007 1703 4460 R2 0.31 0.25 0.31 0.24 0.31 * Significant at 1% level ** Significant at 5% level
Lagged values of wage rate are significant in all estimations. The coefficient is negative, showing an oscillating yet converging time path. The coefficient of the Herfindahl index is also estimated to be positive, giving support to efficient wage hypothesis. As expected, the coefficient of PRIVSHARE is negative. As the private sector’s share in employment increases, real wages fall. TFPCHNG is affecting real wages positively, while the coefficient is much smaller than expected. The coefficient of STRIKES is also positive and significant but it is close to zero. This may be the result of lack of data at the sector level.
The coefficient of IMPRATIO is also significant at the 1% level in all estimations. Its sign is negative, confirming theoretical expectations. Increasing import penetration lowers demand for labor and causes a reduction in real wages. The important, yet not surprising result, is the insignificant and negative value of the coefficient of EXPRATIO - increasing exports do not result in higher wages in exporting sectors. This complies with the findings of the third section where export performance was asserted to be based on keeping wages low.
VI. CONCLUSIONS
This paper explored the distributional consequences of the post-1980 export-led growth policies in Turkish manufacturing. Attention was paid to the impacts of increasing exports and imports on wages and mark-ups at a disaggregated level. Particularly, propositions of imports-as-market-discipline and export-led growth hypotheses were tested.
Results show that with current account liberalization, increasing imports had a positive impact on mark-ups at a general level, contrary to expectations. However, in sectors with high concentration rates, a fall in mark-ups was observed. This provides partial support to the imports-as-market-discipline hypothesis.
Calculations based on classification of manufacturing sectors based on their orientation in external trade prove a strong negative relationship between export performance and value-added categories. Wages and mark-ups in exporting sectors are systematically well below the import-competing and non-import-competing sectors for the whole period covered. The gap is not closing over time.
The relationships between exports and value-added categories were also tested with panel data estimations. Results show that there is a significant and negative correlation between export performance and mark-up ratios. The possible explanation is that competitiveness in
international markets is based on price competition for labor-intensive goods, which most Turkish firms specialize in. Regarding wages, on the other hand, estimations do not show a significant correlation between exports and real wages changes. This is contrary to the assertions of the orthodox trade theory which expects a rise in labor demand and real wages with increasing exports in labor-intensive sectors. In the Turkish case, exporting firms need to maintain wages at the lowest possible level to keep the production costs at a minimum.
Policies aiming to increase competitiveness with “cheap labor” did not result in higher profitability, especially in labor-intensive sectors such as textiles and apparel. “Racing to the bottom” in all senses, i.e. reducing the wage costs and profits margins, informalization in product and labor markets, non-taxation of and government incentives to exporting firms appear to be the key determinants of export performance in Turkish manufacturing between 1980 and 2000.
REFERENCES
Arellano, M. and S. Bond. 1991. "Some Tests of Specification for Panel Data: Monte
Carlo Evidence and an Application to Employment Equations," Review of
Economic Studies 58(2): 277-97.
Arellano, M. and O. Bover. 1995. “Another Look at the Instrumental-variable
Estimation of Error-components Models,” Review of Economic Studies 58:
277-97.
Bayar, G. 2002. “Effects of Foreign Trade Liberalization on the Productivity Level of Industrial Sectors in Turkey,” Emerging Markets Finance And Trade 38(5): 46-71.
Bhagwati, J. 1982. “Directly Unproductive, Profit-seeking (DUP) Activities,” Journal of
Political Economy 90(5): 988-1002.
Bilginsoy, C. 1997. “A Macroeconomic Analysis of Agricultural Terms of Trade in Turkey, 1962-90,” Journal of Development Studies 33(6): 797-819.
Boratav, K., E. Yeldan and A.H. Köse. 2000. “Globalization, Distribution and Social Policy: Turkey, 1980-1998,” CEPA Working Paper Series I, No: 20.
Chen, M.A. 2005. “Rethinking The Informal Economy: Linkages with the Formal
Economy and the Formal Regulatory Environment,” WIDER Research Paper, No:
2005/10, United Nations University.
Coelli, T. 1996. “A Guide to DEAP Version 2.1: A Data Envelopment Analysis (Computer) Program,” CEPA Working Paper, 96/08.
Demirel, G. 2001. “Modelling the Relationship between Productivity, Employment and Wages in Turkish Small and Medium Sized Enterprises: 1981-1998,"
Unpublished Master Thesis, Bilkent University, Institute of Economics and
Social Sciences.
Dikmen, A.A. 2000. “Global Production, Economies of Fashion and New World Hierarchies,” Toplum and Bilim (in Turkish with an English summary) 86: 281-302.
Erdil, E. 1997. “A Test of Wage Leadership in Turkish Manufacturing Industry,”
Applied Economics Letters 4: 219-23.
Ersel, H. 1996. “The Timing of Capital Account Liberalization: The Turkish Experience,” New Perspectives on Turkey 15: 45-64.
Erzan, R. Ed. 1995. Policies for Competition and Competitiveness: The Case of
Foroutan, F. 1991. “Foreign Trade and Its Relation to Competition and Productivity in Turkish Industry,” Policy, Research and External Affairs Department Working Papers, No:604, World Bank.
1995. “Turkey, 1976–85: Foreign Trade, Industrial Productivity and Competition.” In M.J. Roberts and J.R. Tybout (eds.), Industrial Evolution in
Developing Countries. Oxford University Press, 314–335.
Günçavdı, Ö. and B.Z. Orbay. 2002. “Exchange Rates, Market Structure and Price-cost
Margins: Evidence from a Developing Country,” Applied Economics
34:783-89.
Heitger, B. 1987. “Import Protection and Export Performance: Their Impact on Economic Growth,” Weltwirtschaffliches Archiv 123(2): 249-61.
İlkkaracan, İ. and R. Selim. 2003. “The Role of Unemployment in Wage
Determination: Further Evidence on the Wage Curve From Turkey,” Applied
Economics 35: 1589-98.
Kalecki, M. 1971. Trend and the Business Cycle, Selected Essays on the Dynamics of
a Capitalist Economy 1933-1970. Cambridge:Cambridge University Press.
Katırcıoğlu, E., N. Engin and C. Akcay. 1995. “The Impact of Trade Liberalization on the Turkish Manufacturing Industry: An Empirical Assessment,” in Erzan (ed.), 33-51.
Köse, A. H. and A. Öncü. 1998. “Anatolian Manufacturing Industry Within the Context of World and Turkish Economy: Are We at the Threshold of Getting Rich or
Getting Poor?,” Toplum ve Bilim (in Turkish with an English Summary) 77:
135-59.
2000. “Labor Markets and Spatial Dimentions of Specialization in International Division of Labor: Turkish Manufacturing Industry in the Post-1980’s,”
Toplum ve Bilim (in Turkish with an English summary) 86: 72-90.
Köse, A. H. and E. Yeldan. 1998. “The Dynamics of Turkish Economy in the Period of
Open-economy Orientation,” Toplum ve Bilim (in Turkish with an English
Summary) 77: 45-68.
Krueger, A.O. 1974. “The Political Economy of the Rent-Seeking Society,” The
American Economic Review 64(3): 291-303.
1978. Foreign Trade Regime and Economic Development: Liberalization
Attempts and Consequences. Cambridge, MA, Ballinger Pres for NBER.
1981. “The Framework for Country Studies,” in A. Krueger vd. (ed), Trade and
[\]Q 160 JITD, Spring 2008 University of Chicago Press.
Levinsohn, J. 1991. “Testing The Imports-As-Market-Discipline Hypothesis,” NBER Working Papers Series, No: 3657.
Metin, K. 1995. “Models of Wage and Price Determination,” in K. Metin (ed.), Turkey,
The Analysis of Inflation: The Case of Turkey 1948–1988, Ankara: SPK
yayınları, No: 20.
Metin-Özcan, K., E. Voyvoda and E. Yeldan. 2002. “The Impact of the Liberalization Program on the Price–Cost Margin and Investment of Turkey’s Manufacturing Sector After 1980,” Emerging Markets Finance and Trade 38(5): 72–103. Onaran, Ö. 2002. “Measuring Wage Flexibility: The Case of Turkey Before and After
Structural Adjustment,” Applied Economics 34: 767–81.
Onaran, Ö. and N. Yentürk. 2002. “The Mark-Up Rates In Turkish Private
Manufacturing Industry During Trade Liberalızatıon,” Journal of Income
Distribution 11(3/4): 21-31.
Özmucur, S. 2003. “Wage and Productivity Differentials in Private and Public Manufacturing: The Case of Turkey,” avaible at http://econwpa.wustl.edu:80/ eps/io/papers/0303/0303002.pdf .
Robyn, G. 2001. “Aspects of Marginalization: Growth, Industry and Trade of the Least Developed Countries,” UNIDO SIN Discussion Paper Series, No:1.
Taymaz, E. 1998. “Trade Liberalization and Employment Generation: The Experience
of Turkey in the 1980s,” in Ana Revenga (ed.) ,Turkey: Economic Reforms,
Living Standards, and Social Welfare Study, Vol II Technical Papers,
Washington, D.C.: World Bank, 1998.
Yalçın, C. 2000. Price-Cost Margins and Trade Liberalization in Turkish
Manufacturing Industry: A Panel Data Analysis. Central Bank Republic of