Forthcoming, Russian and East European Finance and Trade (2001) Vol. 37, No. 6, 72-84.
The Impact of the Disinflation Program on the Structure of the
Turkish Banking Sector
*C. EMRE ALPER
Department of Economics and Center for Economics and Econometrics
BOGAZICI UNIVERSITY
M. HAKAN BERUMENT
Department of Economics BILKENT UNIVERSITY
N. Kamuran MALATYALI
STATE PLANNING ORGANIZATION
Abstract
This paper uses an unbalanced panel of observations on Turkish commercial banks during 1988-1999, attempts to define the structure of the banking sector through descriptive statistics and panel regressions and forecasts the changes that will take place in the banking system based on these. We follow the methodology of Demirgüç and Huizinga (1999) closely, but instead of a cross-country analysis, we focus on issues pertaining to Turkey undergoing the ambitious three-year stabilization program. The descriptive analysis of the commercial banks operating in Turkey during 1988-1999 points out to the following facts: the chronic inflation of the past 15 years and the resulting high real interest rate have displaced income
1. Introduction
On February 21, 2001, Turkish authorities announced the forced abandonment of the pegged exchange rate regime, which was in effect since the launching of the International Monetary Fund-backed three-year stabilization program at the end of 1999. This announcement came following the acute liquidity crises of November 2000 and February 2001, which threatened the viability of the Turkish banking system as a whole. The financial turmoil following the abandonment of the pegged exchange rate regime necessitated a revised disinflation program, which is likely to put an end to poor banking practices and deficiencies in supervision by prompting rapid consolidation and taking actions to boost profitability of the banking sector.
Prior to the disinflation program of 2000, the Turkish banking sector operated in a difficult environment. Bank management was very complicated due to the existence of macroeconomic instability as characterized by the high volatility in the growth and real interest rates, chronic inflation, persistent fiscal imbalances and balance of payments crises, which resulted in high credit, sovereign and foreign exchange risks as well as very short planning horizons. The chronic inflation rate affected banks’ asset and liability management decisions unfavorably and caused income from core banking operations to be displaced by float income and arbitrage gains. The unstable macroeconomic environment coupled with tax and regulatory distortions led to the explosive growth of the repo market and increased the maturity mismatch risk of the Turkish banking sector since 99% of the volume of transactions had taken place on repos of a single day maturity whereas the underlying government securities had 15 months average maturity. The existence of state banks introduced additional distortions to the banking sector due to their duty losses, i.e., directed lending at subsidized rates to favored sectors. Following the speculative attack and the financial crisis of 1994, the Turkish authorities guaranteed all deposits in banks. This tolerated the development of an unhealthy banking sector since problems of information asymmetry prevailed.
The three-year disinflation program, as outlined in the Letter of Intent1 of December 9, 1999, was essentially an exchange-rate-based stabilization program supplemented by fiscal adjustment and structural reform measures involving agricultural reform, pension reform, fiscal measurement and transparency, and tax policy and administration. There were also measures to strengthen and regulate the banking sector2. In September 2000, an autonomous banking regulatory body was established, and took quick decisions in terms of taking over the troubled banks. However, there was not enough time to restructure other troubled private banks, and reorganize public banks, which remained as an important source of vulnerability. The November 2000 liquidity crisis broke out because of the existing vulnerability due to the “other troubled private banks”3 and the following February 2001 liquidity crisis erupted due to the excess liquidity needs of the public banks. A revised program will be replacing the failed one: the structural reform and the fiscal adjustment measures will be taken at a faster pace.
1
The disinflation program is outlined in the Letter of Intent, which can be accessed at http://www.imf.org/external/np/loi/1999/120999.htm in its entirety.
2
See Letter of Intent, articles 52-61.
3
The rapid restructuring of the banking system is the central issue in the revised program, which is being drawn up by the authorities. With a successful completion of this program, past problems associated with the highly unstable macroeconomic environment will disappear. Presumably, the previous strategies and practices will no longer be successful in this relatively stable environment. Bank managers will have to develop real banking relationships, generate sustainable sources of income and start worrying about such “new” concepts as asset and liability management as well as credit risk.
Keeping in mind the changes the Brazilian financial system4 had to go through following the
Plano Real that was launched on July, 1994, the aim of this paper is to seek an answer to the
question of how consistent the structure of the financial system is with the upcoming lower inflation and a more stable environment. Mendonca and Almeida (1997) argue that the restructuring of the financial system in Brazil -following the stabilization program- can be broadly divided into three overlapping phases. Phase 1 can be roughly described as the period in which mergers and acquisition as well as liquidation took place. Phase 2 was distinguished by the entry of foreign firms to the banking sector. Phase 3 is the replacement of the float income and arbitrage gains by income from growing financial intermediation and commission fees. Previous empirical research on the effects of the stabilization on the Turkish banking system includes van Rijckeghem (1997). Through maturity gap and duration analyses van Rijckeghem found out that the temporary effects of stabilization on the profitability of the banking sector will be positive since the windfall gains outweigh the loss from float income.
This paper uses an unbalanced panel of observations on Turkish commercial banks during 1988-1999, attempts to define the structure of the banking sector in the high-inflation environment of the 1990s through descriptive statistics and panel regressions and also investigates whether the initial structure was compatible with the disinflation program. There has been an increase in the amount of empirical research on the banking sector using panel regressions on cross-country data sets recently. (See for example, Demirgüç and Huizinga, 1999; Claessens et al., 1998; and Eichengreen and Rose, 1998 among others.)
Demirgüç and Huizinga (1999) analyzed the determinants of interest margins and profitability of banking systems using bank level data for 80 countries for the 1988-1995 period. They conclude that higher inflation and real interest rates are associated with higher realized interest margins and profitability. They also found that banking sectors with higher ratios of concentration have higher margins and earn more profits. Claessens et al. (1998), utilizing the same database, analyzed the impact of foreign presence on the banking sector and found that an increase in the share of foreign banks imply lower profitability for the domestic banks. Eichengreen and Rose analyzed banking crises with macroeconomic and financial data for 1975-1992 period and concluded that a one percent increase in the developed countries interest rate is associated with an increase in the probability of a banking crisis in the emerging market economies of around three percent.
We follow the methodology of Demirgüç and Huizinga (1999) closely, but instead of a cross-country analysis, we focus on issues pertaining to the implications of the stabilization program on the current structure of the Turkish banking sector. Section 2 provides the data source and the descriptive statistics. Section 3 discusses the panel regression results. Section 4 concludes.
4
For a detailed survey of financial restructuring following the disinflation experiences in Argentina and Brazil, see Inan (1999).
2. Data
The banking sector industry is different from other industries in that its main function is to provide liquidity-transformation services. Because of the inherent existence of the economies of scale, banks have an advantage in making illiquid investments compared to a typical household or a firm. In addition, banks can exploit economies of scale and scope for monitoring borrowers and assessing the repayment capacity and hence are better equipped to cope with information asymmetry problems.
The efficiency of the banking system is thus an important factor for country’s growth prospects. The efficiency and the profitability of the banking sector in Turkey prior to the launching of the 2000 stabilization program will next be analyzed. The data set will be organized according to ownership and size and the behavior of certain ratios will be evaluated.
This study uses annual balance sheet, income statement and off-balance sheet data of commercial banks in Turkey for the period 1988-1999. The database is gathered from the annual “Banks in Turkey” periodicals provided by the Banks Association of Turkey. From the entire data set, commercial banks, which were transferred to the Deposit Insurance Fund before the launching of the disinflation program in January 2000, were excluded. Development and investment banks as well as banks that have less than four years of observations were also excluded. This yielded an unbalanced panel of maximum 494 observations with 52 banks. Macroeconomic and financial data from the database of the Central Bank of the Republic of Turkey was also used.
Before giving a descriptive analysis of the data, a caveat is in order in terms of the problems associated with the reporting, accounting standards, lack of transparency and thus the quality of the available data. As outlined in IMF Staff Country Reports (1998), the quality of the database is hindered since
• Commercial banks’ securities portfolio is not marked to market;
• There exist divergent approaches to loan-loss provisioning and tax liabilities. Because of this, the level of non-performing loans may be biased and the direction of the bias cannot be determined;
• “Other Assets” item is the largest asset item of the state banks, which suggests the importance of the magnitude of receivables from the treasury.
• The reported level of profitability of the state banks reflects more of administrative decisions than performance of those banks conducting the market activities;
• There exist foreign subsidiaries and incomplete consolidation practices which hampers the determination of the level of the foreign exchange risk and the off-balance sheet exposure with a certain level of reliability;
• Lack of inflation accounting for majority of banks (those that are not quoted in the Istanbul Stock Exchange) conceals the true level of the banking sector profitability.
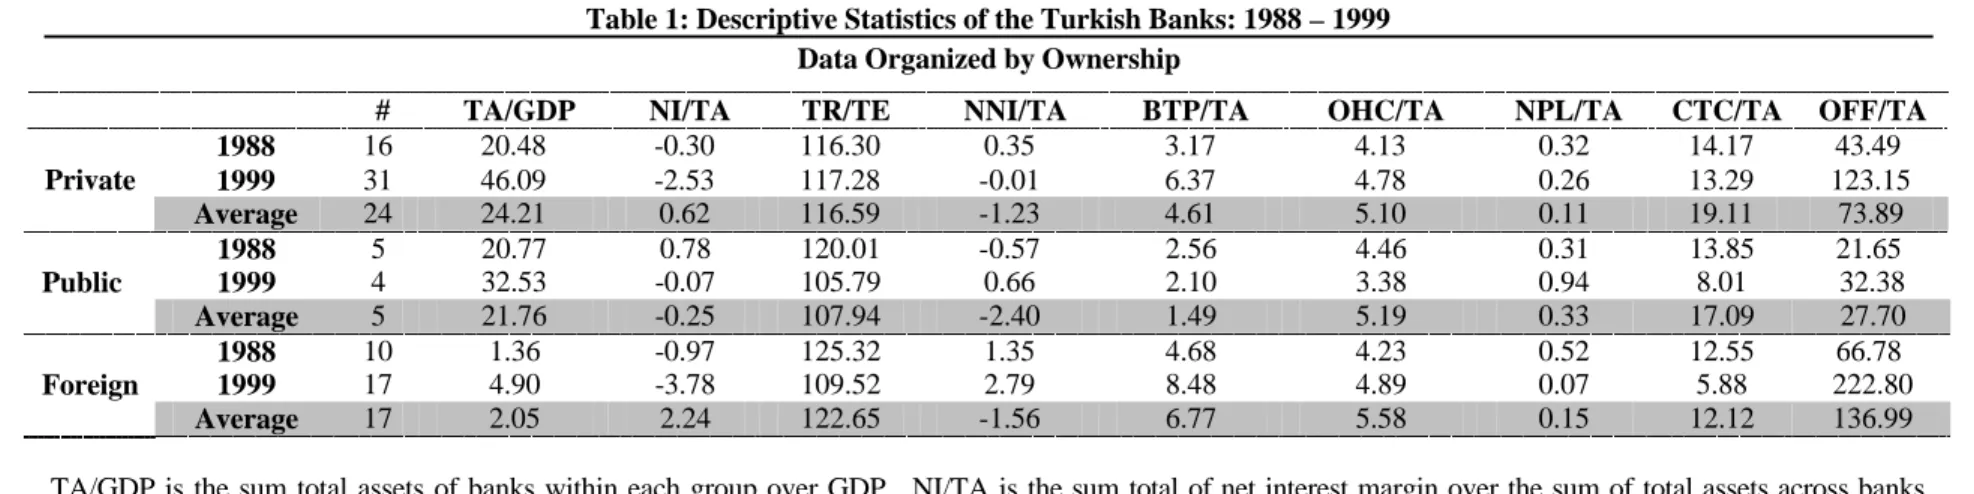
Table 1: Descriptive Statistics of the Turkish Banks: 1988 – 1999 Data Organized by Ownership
# TA/GDP NI/TA TR/TE NNI/TA BTP/TA OHC/TA NPL/TA CTC/TA OFF/TA
1988 16 20.48 -0.30 116.30 0.35 3.17 4.13 0.32 14.17 43.49 1999 31 46.09 -2.53 117.28 -0.01 6.37 4.78 0.26 13.29 123.15 Private Average 24 24.21 0.62 116.59 -1.23 4.61 5.10 0.11 19.11 73.89 1988 5 20.77 0.78 120.01 -0.57 2.56 4.46 0.31 13.85 21.65 1999 4 32.53 -0.07 105.79 0.66 2.10 3.38 0.94 8.01 32.38 Public Average 5 21.76 -0.25 107.94 -2.40 1.49 5.19 0.33 17.09 27.70 1988 10 1.36 -0.97 125.32 1.35 4.68 4.23 0.52 12.55 66.78 1999 17 4.90 -3.78 109.52 2.79 8.48 4.89 0.07 5.88 222.80 Foreign Average 17 2.05 2.24 122.65 -1.56 6.77 5.58 0.15 12.12 136.99
TA/GDP is the sum total assets of banks within each group over GDP. NI/TA is thesum total ofnet interest margin over the sum oftotal assets across banks within each group. In contrast to the previous literature, the net interest margin is defined as the net interest revenue plus net income from foreign exchange transactions and the net interest revenue does not include interest revenues obtained from securities portfolio. Net gains from exchange rate is added since this item is generally incurred due to interest related activities while the latter item is subtracted due to reveal the interest obtained through credit extension. TR/TE stands for the ratio of sum total gross revenues of banks divided by sum total gross expenditures. NNI/TA is the totalnet non-interest related income over total assets. Net non-interest income excludes net income from foreign exchange transactions. BTP/TA is the before tax profit over total assets. OHC/TA is the overhead costs over the total assets. Overhead costs are defined as the sum of personnel related expenditures plus other non-interest related expenditures. CTC/TA is the annual change in total credits over total assets. OFF/TA is the ratio of the off-balance sheet total to the total assets.
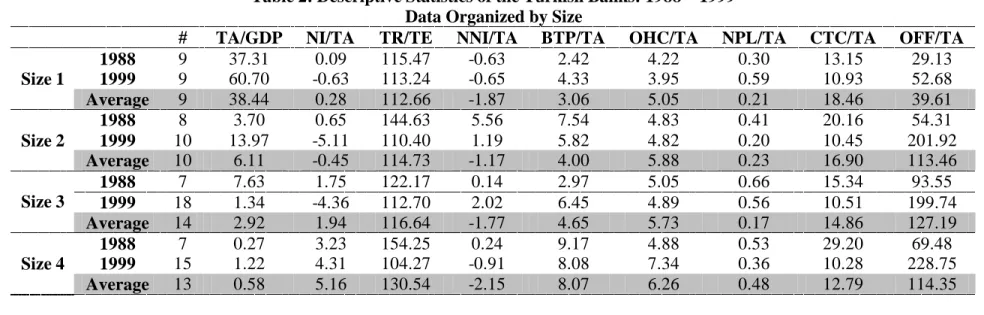
Table 2: Descriptive Statistics of the Turkish Banks: 1988 – 1999 Data Organized by Size
# TA/GDP NI/TA TR/TE NNI/TA BTP/TA OHC/TA NPL/TA CTC/TA OFF/TA 1988 9 37.31 0.09 115.47 -0.63 2.42 4.22 0.30 13.15 29.13 1999 9 60.70 -0.63 113.24 -0.65 4.33 3.95 0.59 10.93 52.68 Size 1 Average 9 38.44 0.28 112.66 -1.87 3.06 5.05 0.21 18.46 39.61 1988 8 3.70 0.65 144.63 5.56 7.54 4.83 0.41 20.16 54.31 1999 10 13.97 -5.11 110.40 1.19 5.82 4.82 0.20 10.45 201.92 Size 2 Average 10 6.11 -0.45 114.73 -1.17 4.00 5.88 0.23 16.90 113.46 1988 7 7.63 1.75 122.17 0.14 2.97 5.05 0.66 15.34 93.55 1999 18 1.34 -4.36 112.70 2.02 6.45 4.89 0.56 10.51 199.74 Size 3 Average 14 2.92 1.94 116.64 -1.77 4.65 5.73 0.17 14.86 127.19 1988 7 0.27 3.23 154.25 0.24 9.17 4.88 0.53 29.20 69.48 1999 15 1.22 4.31 104.27 -0.91 8.08 7.34 0.36 10.28 228.75 Size 4 Average 13 0.58 5.16 130.54 -2.15 8.07 6.26 0.48 12.79 114.35
Size 1 denotes banks with TA/GDP average over 1 %; Size 2 over 0.5 % less than 1%; Size 3 over 0.1% less than 0.5% during 1988-99.
As a measure of efficiency of and profitability due to bank intermediation, net interest margin over the total assets, NI/TA, which reflects the difference between the interest revenues and expenditures over the total assets, is analyzed.5 In contrast to the previous usage,6 the net interest margin is defined as the net interest revenue plus net income from foreign exchange transactions. The latter item is generally incurred due to interest related activities as a result of net open positions and hence is included. Also, the net interest revenues item excludes interest income from securities portfolio7. Interest income from securities portfolio is subtracted from net interest margin in order to reveal the group(s) of banks that will encounter difficulties in the post-stabilization program period, when the public sector borrowing requirement as well as the real return on the government securities portfolio will go down. As a measure of efficiency, TR/TE, the ratio of gross total revenues to the gross total expenditures, is used. The NNI/TA variable is the net non-interest related income over total assets excluding net income from foreign exchange transactions and is used to reflect the importance of brokerage services and commission fees, generally reflecting income from more sustainable sources. BTP/TA is the before tax profit over total assets and reflects bank’s profitability. OHC/TA is the overhead costs over the total assets, reflecting the importance of the banks’ entire overhead costs associated with all its activities. Overhead costs are defined as the sum of personnel related expenditures plus other non-interest related expenditures. NPL/TA is the annual change in the net non-performing loan stock over the total assets and measures the importance of bad debts. CTC/TA is the annual change in total credits over total assets. OFF/TA is the ratio of the off-balance sheet total to the total assets. The latter two variables reflect the importance of traditional versus emerging activities in the banks’ total activities.
Table 1 summarizes the data set by organizing the data according to ownership and giving within group averages as well as the initial and the final observations. Similarly, Table 2 presents the same data set by breaking it down with respect to the size of the banks. Banks in size-1 group have individual total assets over the GDP greater than 1% when averaged over the 12 years. Size-2 banks have total assets over the GDP less than or equal to 1% but greater than 0.5% when averaged over the years. Size-3 banks have total assets over the GDP greater than 0.1% and less than 0.5%. Some striking observations from Tables 1 and 2 may be given as follows:
v In terms of the share of net interest margins (adjusted for interest revenue from government securities) in the total assets, public banks’ performance is dismal. The high share of average non-performing loans in total assets for public banks is not a surprising statistic given the fact that public banks were regarded as extra-budgetary subsidy disbursing devices by the fiscal authorities in the high inflation period.
v Even though foreign banks constitute the group smallest in size, the shares of before tax profits as well as the net interest margins are the largest. In terms of the ratio of total revenues to expenditures, again the foreign banks and the smallest size banks seem to be the most efficient. In the pre-stabilization high inflation environment, arbitrage related activities did not seem to be subject to economies of scale. This observation also explains the phenomenon of the survivability of a large number of relatively small sized banks in the sector.
5
It is important to note that a reduction in NI/TA does not necessarily imply an improvement in efficiency. An increase in interest expenditures, ceteris paribus, reduces the net interest margin.
6
See for example, Demirgüç and Huizinga (1998).
7
However, the results are not qualitatively sensitive to the exclusion of the interest income from securities portfolio. See Alper et al. (2001) for results using the definition of net interest margin including interest revenue from government securities portfolio.
v Even though the share of net interest margin item was not subject to economies of scale, the share of net non-interest income in total assets was. It is evident that banks on the average incurred losses from these activities, and more importantly smaller sized banks suffered more. However, in an environment where the average before tax profits over total assets stood at 8.07, a value of –2.15 for net non-interest income did not receive enough emphasis for the smallest size banks.
v Similarly, the average share of the overhead costs are highest at the foreign and the smallest size banks. One can also observe the same pattern for the average share of change in the stock of total credits extended in total assets variable.
v The smallest size banks have the highest average share of change in the non-performing loans in total assets variable.
v Combining these points, one can come up with certain predictions about the future structure of the Turkish banking sector. Under the assumptions of:
Ø a successful finale to the current stabilization effort and the significant reduction in the outstanding government debt and real interest rates;
Ø the privatization or “autonomization” of the public banks; and
Ø the continuation of the current trend in the international banking activities in which the traditional banking related activities are being displaced by off-balance sheet and non-interest related service provision that require scale economies;
one can conjecture that
§ bank consolidation is expected, smaller banks will not be able to survive in the stable environment;
§ foreign banks will grow in size to be able to compete with larger size banks and not to incur losses. The growth in size can be in the form of direct investment and opening up new branches or through mergers and acquisitions.
v One should also note that when the outstanding government debt stock reduces, sovereign risks carried by the commercial banks would be replaced by credit risk. Also, since Turkish conglomerates will prefer direct financing through issues of private securities, banks will be financing medium to small sized firms. In the very near future, just like the case of Brazil following the launching of the Plano Real, non-performing loans will increase. Maturity mismatch risk will also grow. There is yet no secondary market for illiquid assets presently; securitization will be an important issue in the very near future.
v The explosive growth of the share of the off-balance sheet activities in total assets of the private and foreign banks is mostly due to the volume of forward foreign exchange market. The importance of guarantees and warranties will also contribute to this growth with the emergence of private bonds and bills markets in Turkey.
The descriptive analysis was based on data broken down with respect to ownership and size. The analysis based on ownership did not control for size, and similarly the analysis based on size did not control for ownership. Also, changes in the macroeconomic environment were not controlled for. These problems are dealt with in the next section where we investigate results from the regression analysis using individual bank data.
3. Analyses Based on Panel Regressions
This section presents results gathered from dynamic panel regressions. The estimation method is the generalized least squares with cross section weights. The unbalanced panel data set has maximum 494 observations for 52 banks during 1988-1999. The existence of the lagged dependent variables as an exogenous variable in the regressions imply that the observed coefficients will be the impact multipliers and that medium-to-long-run effects of each variable will be much larger if the lagged dependent variable is statistically significant. The ensuing analysis will interpret the regression results as being descriptive in nature: rather than focusing specifically on the magnitude of the coefficients the signs of the coefficients will be receiving emphasis. Table 3 presents estimation results from four individual panel regressions.
The dependent variables are the share of net interest margin (that includes foreign exchange related income and excludes interest revenues from securities portfolio) in total assets (NI/TA), the ratio of total revenues to total expenditures (TR/TE), and the shares of net non-interest related income (excluding income from foreign exchange related transactions, NNI/TA), and overhead costs (OHC/TA) in total assets. The effects of size and ownership are queried through the use of intercept and slope dummy variables. A dummy variable that takes the value of unity in 1994, zero otherwise, is also included in regressions to account for effects, brought about by the 1994 crisis8. Other changes in the macroeconomic environment are incorporated in the model via the inclusion of variables such as the annual growth of GDP, the annual CPI based inflation rate, and the ex-post annual real interest rate9. The intercept dummy variables are set up such that the coefficients of ownership dummy variables should be interpreted relative to private-owned banks and the coefficients of the size dummy variables are to be interpreted relative to the smallest size banks. Rather than interpreting each regression equation separately, the ensuing analyses will be based on the interpretation of the estimated coefficients of explanatory variables across regressions.
Controlling for ownership and macroeconomic environment changes, it can be seen that relative to smallest size banks, average net interest margins are significantly lower for larger size banks. We should note that interest income from holding government securities is excluded, thus this figure represents interest income from “core” banking operations only. On the other hand, the average share of the net non-interest related income is significantly higher for larger size banks. These results also conform to those obtained from the descriptive analysis. It is important to note that once the smallest size banks are excluded, the relation between the bank size and the average interest and non-interest income related activities breaks since the magnitude of the coefficients of size 1, 2, and 3 banks are quite similar. When we consider the share of overhead costs in total assets, we again encounter the evidence of returns to scale gains: average share of overhead costs are smaller for larger size banks. Measuring efficiency in terms of TR/TE, size 3 banks seem to be the least efficient among size 1, size 2, and size 4 banks. Thus, in the high-inflation environment of the 1990s, bank efficiency was not subject to scale economies.
8
See Özatay (1996) for a detailed analysis of the 1994 crisis.
9
The regression results are robust to inclusion of variables such as market capitalization of the Istanbul Stock Exchange, and the concentration variable, which is the share of the largest three banks’ assets in total banking assets.
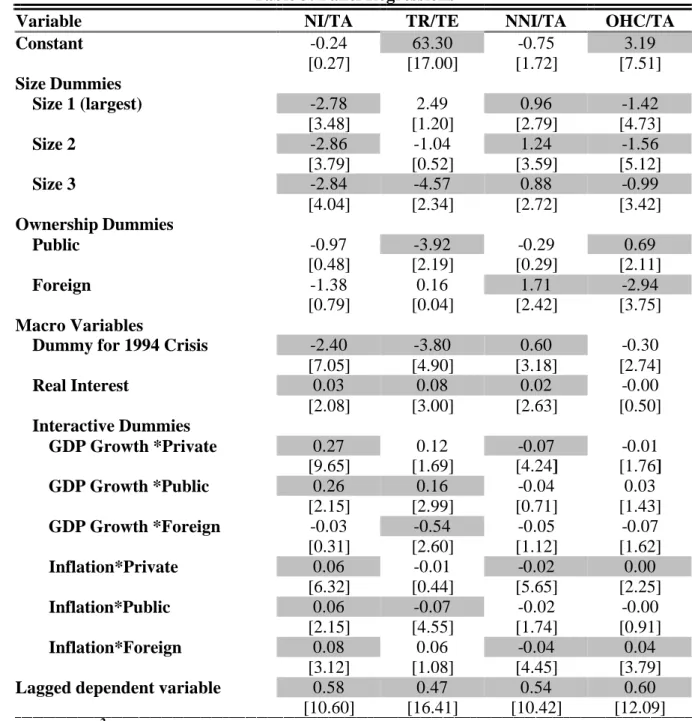
Table 3: Panel Regressions
Variable NI/TA TR/TE NNI/TA OHC/TA
Constant -0.24 63.30 -0.75 3.19 [0.27] [17.00] [1.72] [7.51] Size Dummies Size 1 (largest) -2.78 2.49 0.96 -1.42 [3.48] [1.20] [2.79] [4.73] Size 2 -2.86 -1.04 1.24 -1.56 [3.79] [0.52] [3.59] [5.12] Size 3 -2.84 -4.57 0.88 -0.99 [4.04] [2.34] [2.72] [3.42] Ownership Dummies Public -0.97 -3.92 -0.29 0.69 [0.48] [2.19] [0.29] [2.11] Foreign -1.38 0.16 1.71 -2.94 [0.79] [0.04] [2.42] [3.75] Macro Variables
Dummy for 1994 Crisis -2.40 -3.80 0.60 -0.30 [7.05] [4.90] [3.18] [2.74] Real Interest 0.03 0.08 0.02 -0.00 [2.08] [3.00] [2.63] [0.50] Interactive Dummies GDP Growth *Private 0.27 0.12 -0.07 -0.01 [9.65] [1.69] [4.24] [1.76] GDP Growth *Public 0.26 0.16 -0.04 0.03 [2.15] [2.99] [0.71] [1.43] GDP Growth *Foreign -0.03 -0.54 -0.05 -0.07 [0.31] [2.60] [1.12] [1.62] Inflation*Private 0.06 -0.01 -0.02 0.00 [6.32] [0.44] [5.65] [2.25] Inflation*Public 0.06 -0.07 -0.02 -0.00 [2.15] [4.55] [1.74] [0.91] Inflation*Foreign 0.08 0.06 -0.04 0.04 [3.12] [1.08] [4.45] [3.79]
Lagged dependent variable 0.58 0.47 0.54 0.60 [10.60] [16.41] [10.42] [12.09]
Adjusted R2 0.45 0.98 0.36 0.72
Durbin’s h test 0.13 0.30 -0.02 -0.32
Number of Observations 492 489 494 494 The regression is estimated using Generalized Least Squares with cross section weights, pooling an unbalanced bank level data of 52 banks during the 12 years 1988-1999. Absolute value of the t- ratios using standard deviations from the White’s heteroskedasticity-consistent variance-covariance matrix are provided inside brackets below each coefficient. Shaded coefficients imply significance at 5% level.
Based on the results for the size dummies, one may conjecture that in a low inflation environment characterized by lower net interest margins, smallest size banks will have difficulty in surviving since they have the lowest average non-interest income and the highest overhead costs. In the high-inflationary macroeconomic environment of the 1990s, persistent negative net non-interest margins and high overhead costs did not receive enough emphasis due to the high profitability of holding government securities. However, with the reduction in the real interest rates and the public sector borrowing requirement, these items, which are subject to economies of scale, will receive more emphasis and will constitute reasons for the Turkish banking sector consolidation.
Controlling for size, the foreign and public banks on the average do not differ significantly from private banks and foreign ownership seems to lower net interest margins. This is an important result. We can conclude that the reason the public banks fared worse in terms of net interest margins according to Table 1 is due to their size attributes rather than ownership. However, in terms of efficiency, as evidenced by the ratio of total revenues to total expenditures, public banks are significantly worse off than private banks. Foreign banks are as efficient as the private banks. When we analyze the net non-interest income, as argued previously, economies of scale seem to matter and larger size banks seem to do better than the smallest size banks. Controlling for size, foreign banks seem to do better than private banks in the non-interest income related activities. This is also not very surprising because other than treasury related operations, foreign banks have specialized in foreign sector related transactions and are earning commission fees. In terms of overhead costs, conforming to the results concerning efficiency, public banks have higher share in total assets and the foreign banks have lower shares. With a speedy privatization or “autonomization” measures, we expect an increase in efficiency and a reduction in the share of overhead costs in the banking sector.
The real interest rate seems to increase the share of net interest margin, total revenue over total expenditures and the share of net non-interest related revenues. Following a successful conclusion of the revised stabilization program, permanent level reductions in the real interest rates are to be expected. The reduction in net interest revenues in such an environment is not surprising. However, we expect certain structural changes in the banking system such that the currently free banking services will be fee-based in the very near future. The importance of the non-interest related income should be emphasized. Thus even though a reduction in the interest rates implied a reduction in the share of net non-interest income, due to the expected structural change, we expect the share to go up.
The coefficients of the interactive dummy variables explain the relevance of macroeconomic changes on the shares of net interest margin, net non-interest income and overhead costs in total assets as well as the ratio of total revenues to total expenditures according to ownership. Regardless of the ownership, a reduction in the inflation rate reduces the share of the net interest margins. This is consistent with observations on countries going through similar disinflation programs. It is also noteworthy to observe that a reduction in the inflation rate increases the net non-interest revenues and decreases the overhead costs of the private and the foreign owned banks but not public banks. However, with measures taken to privatize or “autonomize” the public banks, we expect the share of non-interest revenues to go up and the overhead costs to go down for the whole banking sector.
4. Conclusion
The descriptive analysis of the commercial banks operating in Turkey during 1988-1999 points out to the following facts: the chronic inflation of the past 15 years and the resulting high real interest rate displaced income from core banking activities by arbitrage income through open positions. The prevailing high net interest margins allowed for the existence of large number of small banks and persistent net losses from non-interest related activities. The foreign banks in such an environment did not need to increase their size since scale economies did not matter as evidenced by the highest before tax profits accruing to smaller size banks.
With the successful completion of the currently revised stabilization program, investment horizons will be lengthened; arbitrage gains and high net interest margins will be eliminated. Banks will have to switch to non-interest income related activities and have to generate sustainable sources of fee-based income. Compared to the environment when the public sector borrowing requirement was high and the existing banks did not have to compete with each other for asset management, economies of scale will be an important issue. Consolidation within the sector will be taking place and small size banks will not be able to survive. Foreign banks will also need to grow in size to be able to compete with large size banks in retail banking through most probably mergers and acquisitions.
Since the market risk of the banks will mostly be due to credit risk (rather than the sovereign risk of holding Turkish government securities) in this future stable environment, securitization will be an important issue. In such an environment, bank financing will be mostly channeled to medium and small sized firms since Turkish conglomerates will prefer direct financing through issuing commercial papers. In the very near future, just like the case of Brazil following the launching of the Plano Real, banks profitability will be closely linked to the business cycles: during recession non-performing loans will increase. Maturity mismatch risk will also grow. The development of a mortgage based securities market and establishment of a secondary market for other illiquid assets by the authorities at the earliest is a prerequisite to avoid future liquidity crises and to increase the strength of the banking system, which has currently a very fragile structure.
References
Alper, C. E. (2001). The Turkish Liquidity Crisis of 2000: What Went Wrong, Russian and East
European Finance and Trade, Vol. 37, No. 6, pp. 51-71.
Alper, C. E., H. Berument, and K. Malatyalý (2001). The Disinflation Program and the Structure of the Turkish Banking Sector. Forthcoming in: Boðaziçi Journal, Vol. 15, No. 2.
Claessens, S., A. Demirgüç-Kunt and H. Huizinga (1998). How Does Foreign Entry Affect the Domestic Banking Market? Mimeo, Washington, DC: World Bank.
Demirgüç-Kunt, A., H. Huizinga (1999). Determinants of Commercial Bank Interest Margins and Profitability: Some International Evidence. World Bank Economic Review, 13/2: 379-408. Demirgüç-Kunt, A., E. Detragiache and P. Gupta (2000). Inside the Crisis: An Empirical
Analysis of Banking Systems in Distress. IMF Working Paper, No. 00/156.
Eichengreen, B. and A. Rose (1998). Staying Afloat When the Wind Shifts: External Factors and Emerging-Market Banking Crises. National Bureau of Economic Research Working Paper, No. 6370.
Ersel, H. (2000): “Ýþler Niçin Ýstenildiði Gibi Sonuçlanmaz? Ýstikrar Programý - 2000 Üzerine. Mimeo, Istanbul.
IMF Staff Country Reports (2000). Turkey - Recent Economic Developments and Selected Issues. No: 00/14, pp. 37-53, available at: http://www.imf.org/external/pubs/ cat/longres.cfm?sk&sk=3408.0.
IMF Staff Country Reports (1998). Turkey - Recent Economic Developments and Selected Issues. No: 98/104, pp. 118-133, available at: http://www.imf.org/external/ pubs/cat/longres.cfm?sk&sk=2809.0.
Ýnan, E. A. (1999). Dezenflasyon Programýnýn Türk Bankacýlýk Sistemine Olasý Etkileri. Istanbul: Türkiye Bankalar Birliði, Araþtýrma Raporu.
Mendonca de Barros, J. M. and M. Facunda de Almeida, Jr. (1997). An Analysis of Financial Adjustment in Brazil. Available at: http://www.fazenda.gov.br/ingles/ orgaos/ispe/infinan.html. Mendonca de Barros, J. M. and M. Facunda de Almeida, Jr. (1997). Restructuring Brazil’s
Financial System. Available at: http://www.fazenda.gov.br/ingles/orgaos/ispe/ inproer.html. Özatay, F. (1996). The Lessons from the 1994 Crisis in Turkey: Public Debt (Mis)Management
and Confidence Crisis. Yapý Kredi Economic Review, 7/1: 21-37.
Van Rijckeghem, C. (1997). The Political Economy of Inflation: Are Turkish Banks Potential Losers from Stabilization? Istanbul Stock Exchange Review, 3: 1-16.