THE IMPACTS OF PROCUREMENT POLICY CHANGES ON DEFENSE STOCKS: EVIDENCE FROM THE US DEFENSE INDUSTRY
The Institute of Economics and Social Sciences of
Bilkent University
By
Feyzi MİNTAŞ
In Partial Fulfillment of the Requirements for the Degree of
MASTER OF BUSINESS ADMINISTRATION
in
THE DEPARTMENT OF MANAGEMENT BİLKENT UNIVERSITY
ANKARA September 2003
I certify that I have read this thesis and have found that it is fully adequate, in scope and in quality, as a thesis for the degree of Master of Business Administration.
Assist. Prof. Aydın YÜKSEL
I certify that I have read this thesis and have found that it is fully adequate, in scope and in quality, as a thesis for the degree of Master of Business Administration.
Assist. Prof. Aslıhan SALİH ALTAY
I certify that I have read this thesis and have found that it is fully adequate, in scope and in quality, as a thesis for the degree of Master of Business Administration.
Assist. Prof. Aslı BAYAR
Approval of the Institute of Economics and Social Sciences
Prof. Kürşat AYDOĞAN Director
ABSTRACT
THE IMPACTS OF PROCUREMENT POLICY CHANGES ON DEFENSE STOCKS: EVIDENCE FROM THE US DEFENSE INDUSTRY
Mintaş, Feyzi
M.B.A.,Department of Management Supervisor: Assist.Prof. Aydın Yüksel
September 2003
The purpose of this study is to examine the relative stock market performance of US defense stocks over different time periods and analyze the impact of changes in Federal Acquisition Policy on defense stock returns. The data set covers monthly returns of 67 defense stocks during the period 1945-2000. The analysis consists of two parts. Relative performance analysis and the event study analysis. The results of the relative performance analysis showed that defense stocks portfolio is both more profitable and riskier than the size based benchmark. However, the difference was not found to be statistically significant. On the other hand, the event study analysis indicates that defense firms significantly reacted to nine major regulatory changes that occurred during the sample period. Only two of the nine regulatory changes examined resulted in statistically significant average excess returns. For other regulations, the sign and the magnitude of the reaction varies across firms.
ÖZET
TEDARİK POLİTİKALARINDAKİ DEĞİŞİKLİKLERİN SAVUNMA SANAYİİNE ETKİLERİ: AMERİKA ÖRNEĞİ
Feyzi MİNTAŞ
YÜKSEK LİSANS TEZİ, İŞLETME FAKÜLTESİ Tez danışmanı: Yrd. Doç. Dr. Aydın YÜKSEL
Eylül, 2003
Bu çalışmanın amacı Amerikan savunma sanayii hisselerinin değişik periyotlardaki rölatif performansını ve tedarik politikasında meydana gelen başlıca değişikliklerin savunma sanayii hisselerine olan etkilerini araştırmaktır. Data seti, 67 savunma sanayii şirketinin 1945-2000 yılları arasındaki aylık getirilerini kapsamaktadır. Analizler iki parçadan oluşmaktadır: Rölatif performans analizi ve olay etki analizi. Rölatif performans analizleri savunma sanayii şirketlerinden oluşan portföyün benzer bir piyasa değerine sahip olan diğer bir portföyden daha karlı ve daha riskli olduğu sonucuna varmıştır. Fakat iki portföy arasındaki fark istatistiksel olarak belirgin bulunmamıştır. Olay etki analizi, savunma sanayii şirketlerinin 9 ana kanunsal düzenlemeye belirgin olarak reaksiyon gösterdiğini bulmuştur. 9 kanunsal düzenlemeden yalnızca ikisinde istatistiksel olarak ortalama anormal getiriler belirgin bulunmuştur. Savunma sanayii firmaları diğer kanunsal düzenlemelere heterojen bir reaksiyon göstermiştir; reaksiyonun büyüklüğü, pozitif veya negatif oluşu firmadan firmaya farklılık göstermiştir.
Anahtar kelimeler: Savunma sanayii, Savunma tedariki, olay etki analizi, çok değişkenli regresyon modeli
ACKNOWLEDGMENTS
I am very grateful to Assist. Prof. Aydın Yüksel for his supervision, constructive comments, and patience throughout the study. I also wish to express my thanks to other committee members for their comments on the study. Finally, I am very grateful to my family members; my mother, my wife, my brother and my sister, for their patience and support. I dedicate this thesis to my father, who passed away in 1997.
TABLE OF CONTENTS
Abstract………. iii
Özet………... iv
Acknowledgments………... v
Table of Contents……….. vi
List of Tables………. viii
List of Figures………. x
CHAPTER 1:Introduction………. 1
CHAPTER 2: Defense Industry………. 3
2.1 Military Power……… 3
2.1.1 Buying Weapons from Other Countries……….. 5
2.1.2 Developing a National Defense Industry………. 6
2.1.3 Military Cooperation through Alliances……….. 7
2.2 Defense Industry………. 9
2.2.1 Structure of Defense Industries………..…9
2.2.2 Characteristics of Defense Industry………...10
CHAPTER 3: Defense Procurement and Regulation in the US 3.1 US Defense Industry……… 13
3.2 US Defense Procurement………... 15
3.3 Regulation and Defense Profits in US Defense Industry……... 18
CHAPTER 4:Literature Review……….... 22
4.1 Studies Related to Relative Profit Performance of Defense Firms…… 23
4.2 Studies Related to Defense Procurement and its Efficiency…………... 25
CHAPTER 5: Methodology And Data………... 29 5.1 Relative performance analysis………. 29 5.1.1 Classification and Periods examined……… 30 5.1.2 Methodology Used in the Relative Performance Analysis…... 35 5.2. The Impact of Regulatory Changes……… 40 5.2.1 Event Studies……… 40 5.2.2 Multivariate Regression Model in Event Studies……… 43 5.2.3 Methodology of the analysis examining the impact of. …….. 46 regulatory changes
5.3 Data and the Sample………... 53 CHAPTER 6: Results……… 59 6.1 Relative Performance Analysis Results……….. 59 6.2 Results of the Analysis Examining the Impact of Regulatory Changes. 67 CHAPTER 7: Conclusion……….. 74 BIBLIOGRAPY………... 76
LIST OF TABLES
TABLE 1 Top 15 Countries in Military Expenditures (2002)……… 4
TABLE 2 Top 15 Countries in Exports of Conventional Weapons…….. 6
TABLE 3 Summary of Studies Related to Relative Performance of Defense Firms………. 28
TABLE 4 Major Periods In Defense Acquisition History………. 31
TABLE 5 Delisting Codes……… 37
TABLE 6 Hypotheses……… 45
TABLE 7 The sample of Regulatory reform Initiatives……… 51
TABLE 8 Major Reforms in Federal Acquisition………. 52
TABLE 9 Sic Codes……… 55
TABLE 10 Sample Securities List……… 56
TABLE 11 Distribution of Sample Firms across Deciles……… 58
TABLE 12 Market Values for Decile Portfolios………. 58
TABLE 13 Risk and return measures for the portfolios (1945-1999)…… 62
TABLE 14 Statistical Test Results for the comparison of the Sample Portfolio and the Benchmark Portfolio (1945-1999)……… 62
TABLE 15 Statistical Test Results for the comparison of Sample Portfolio and Market Index (1945-1999)………. 63
TABLE 16 Risk and Return Measures for the Two Portfolios (1948-1961, 1970-1989)………. 64
TABLE 17 Statistical Test Results for the Comparison of Sample Portfolio and Benchmark Portfolio (1948-1961, 1979-1989)……… 64
TABLE 18 Statistical Test Results for the Comparison of Big Firms’
Portfolio and Benchmark Portfolio (1948-1961, 1970-1989)……… 65 TABLE 19 Results for the Comparison of Big firms’ Portfolio and
Market index (1948-1961, 1970-1989)……… 65 TABLE 20 Risk and Return Measures for the Big Firms’ portfolio and the Benchmark Portfolio (1952-1956, 1976-1980)………. 66 TABLE 21 Statistical Test Results for the Comparison of Big Firms’
Portfolio and Benchmark Portfolio (1952-1956, 1976-1980)……….. 66 TABLE 22 Statistical Test Results for the Comparison of Big Firms’
Portfolio and Market Index (1952-1956, 1976-1980)………. 67 TABLE 23 Tests with monthly returns of the hypothesis that average
excess returns equal zero……… 71 TABLE 24 Results for the Individual Parameter Estimates (γia)………….. 72 TABLE 25 Tests with monthly returns of the hypothesis that all excess
LIST OF FIGURES
CHAPTER 1
INTRODUCTION
The presence of a large defense industry in an economy, as the one in the US, traditionally raises the issue of whether such an industry profits from the misery of others. That is why defense industries are sometimes called as ‘merchants of dead’ or ‘war profiteers’. In the US, there has frequently been a great deal of discussion in private and official circles about the profitability of defense business over time. A popular opinion that defense profits are excessive is based largely on occasional public reports of wastes and inefficiencies over different time periods. According to Bohi (1973) the issue is of critical importance, for if profit rates are too high the nation is wasting resources, while if profit rates are too low, resources will flow out of defense business and jeopardize the quantity and quality of sources of supply. Defense industry distinguishes itself from a typical industry in several ways: an unusual product market, heavy use of quickly changing technology, multiproduct firms, and regulation. This final characteristic will be addressed in this study. The purpose of this study is to examine the long-run stock market performance of US defense stocks over different time periods and analyze the impact of changes in Federal Acquisition Policy on defense stock returns. Acquisition policy, which is the focus of this study, is just one of the factors that affect defense industry profits. Other factors can be the general demand for weapon systems, which may change due to political considerations and wars, the level of competition in the defense industry or the speed of technological improvements. This type of a study that measures the
The empirical analysis consists of two parts: Examination of the relative profit performance of defense stocks and the event study analysis. To address the issue of excess defense profits, relative performance of defense stocks is examined over the period 1945-1999. This period is divided into five major sub-periods. A size benchmark portfolio is used to measure long-run excess returns. For the event study analysis, a version of the Multivariate Regression Model (MVRM) is used to measure the impact of regulatory changes on defense firms. MVRM is a popular way to deal with the clustering problem in standard event studies. Another advantage of MVRM compared to the standard methodology is that it allows the testing of a richer set of hypothesis.
The results of the relative performance analysis show that, in the long run (1945-1999), defense firms do not earn statistically significant excess profits. However, there is evidence that for specific and relatively short time periods, big defense firms are able reap excess profits. The results of the event study analysis indicate that defense firms reacted significantly to the regulatory changes examined in this study. However, out of nine regulatory changes examined, the reaction was homogenous in only two. These two changes affected the defense firms negatively. For other regulatory changes the sign and the magnitude of the impact varies across firms.
CHAPTER 2
DEFENSE INDUSTRY
This chapter is organized as follows: First, the military power concept and the means to obtain military power are explained. Second, the structure and major characteristics of defense industries are covered. The chapter concludes with the discussion of the US defense procurement.
2.1 Military Power
Military power is a crucial tool in dealing with conflicts in international relations, together with political and economic power. The decision about having a strong military power, and a strong army depends on the following factors:
• The perceived threats to the nation and a desire for security, • A desire for national power and international status,
• The size of national income and wealth,
These factors consequently affect the military expenditure decisions, which varies a lot across countries. Table 1 depicts the top 15 countries regarding military expenditures. The five countries with the highest military expenditures are USA, Japan, UK, France and China. These countries (US alone) accounted for 62 (48) percent of world total in 2002. Military expenditures consist of operating costs, procurement and construction costs and research and development costs related to
TABLE 1
Top 15 Countries in Military Expenditures (2002)
Country Size World share
(%) USA 335.7 43 Japan UK 46.7 36.0 6 5 France 33.6 4 China 31.1 4 Sub-total top 5 483.1 62 Germany S. Arabia Italy Iran 21.1 21.6 21.1 17.5 4 3 3 2 South Korea Sub-total top 10 584.5 13.5 75 2 India 12.9 2 Russia Turkey Brazil 11.4 10.1 10.0 2 1 1 Israel 9.8 1 Sub-total top 15 638.7 82 World 784 100
Note: Numbers for size are in US Billions dollars Source: Military expenditure: Stockholm
International Peace Research Institute (SIPRI) Yearbook 2003.
Military power can be obtained by forming a strong army, making use of alliances, or both. A strong army requires necessary weapons. In order to obtain these weapons, countries have two alternatives. One is buying weapons from other countries; the other is developing a national defense industry. Military cooperation through alliances may lead to great savings in military expenditures. Each of them will be briefly discussed in the following sections.
2.1.1 Buying weapons from other countries
Today, the international arms market is a buyers’ market in which modern tanks, fighter aircrafts, submarines, missiles, and other weapons are, in general, available to any nation that can afford them. Increasingly, sales of major weapons also include the transfer of the underlying technologies necessary for local production, resulting in widespread proliferation of modern weapons and the means to produce and even develop them. For example, the Gulf War (1990-1991) showed that although Iraq had little or no defense industrial capability, it had been able to obtain a vast arsenal of modern weapons from the Soviet Union, Western Europe, China, Eastern Europe.
Although feasible, buying weapons from other countries can be too costly. In addition, the lack of a national defense industry leads to increasing dependence to other countries. There is an optimal point for each country related to production of weapons systems. Some arms products will inevitably be purchased from other countries, and some will be produced by the country. The difficulties related to forming a national defense industry will be discussed later.
Table 2 displays the total exports of conventional weapons over the period 1997-2001 by country. Conventional weapons are the weapons, which are not nuclear, biological or chemical. The figures in Table 2 show that the US has a dominant role in the weapons market. The US exceeds other important players in the market, namely Russia, France, the UK and Germany, by a wide margin.
2.1.2 Developing a National Defense Industry
A large number of governments support the indigenous development and production of weapons for several reasons. First, a high level of domestic production of arms is perceived as an important factor for guaranteeing autonomy in foreign policy. This factor can be called as the basic security value of self-reliance. No country wishes to be dependent on weapons from abroad if it can be avoided. Not surprisingly, the countries that have gone furthest in developing defense industries from scratch during the last decades are also the ones that have felt their security most acutely threatened. Israel, North Korea and Pakistan are examples of
TABLE 2
Top 15 Countries in Exports of Conventional Weapons
Country Total Sales (1997-2001)
USA 44.82 Russia 17.35 France 9.80 UK 6.70 Germany 4.82 Ukraine 2.62 Netherlands 1.86 Italy 1.67 China 1.55 Belarus 1.52 Sweden 1.2 Israel 0.97 Spain 0.87 Canada 0.64 Australia 0.62 Note: All figures are US Billion Dollars.
Source: Stockholm International Peace Research Institute (SIPRI)
these countries. Israel-Arabian, North Korea-South Korea and Pakistan-India conflicts forced these countries to form a defense industrial base.
Second, arms production is also believed to add to economic autonomy through its contribution to overall economic output, employment, and technological innovation. Moreover, spin-off from military technology to civilian industry has also been viewed as an essential driving force of national innovation and competitiveness.
Finally, a domestic defense industrial base can also be used as a tool in foreign and trade policies. A well-developed arms industry grants a government influence in military alliances and cooperative arms projects. Arms transfers can be used to support allies and to win friends as well as to improve the balance of payment.
Today, two major difficulties exist related to arms production. First one is the rapid development of military technology and the increasing R&D costs of advanced weapon systems. These factors have led to a high level of international interdepence in armaments production. Second one is the increasing competition especially after the end of cold war. The end of the Cold War has brought profoundly decreased demand for weapons by the United States, the Soviet Union, and most European governments. As a result of worldwide overcapacity in defense production, competition is fierce.
2.1.3 Military Cooperation through Alliances
Cooperation among countries may ease the task. For that purpose, many countries in the world seek alliances to ensure and safeguard their freedom and security in a more effective and less costly way. International security organizations like the North Atlantic Treaty Organization (NATO) and the Warsaw Pact have been important organizations in this respect. The former is a successful example while the latter is an unsuccessful one.
NATO is an alliance of 19 countries from North America and Europe and was established on 4 April 1949. In accordance with the Treaty, the fundamental role of NATO is to safeguard the freedom and security of its member countries by political and military means. During the last fifteen years, NATO has also played an increasingly important role in crisis management and peacekeeping. All member countries that participate in the military aspect of the Alliance contribute forces and equipment, which together constitute the integrated military structure of the Alliance. These forces and assets remain under national command and control until a time when NATO requires them for a specific purpose (i.e. conflict or crisis, peacekeeping).
The Warsaw Pact alliance was set up in 1955 by Albania, Bulgaria, Czechoslovakia, East Germany, Hungary, Poland, Romania, and the Soviet Union. The organization was the Soviet block's equivalent of the North Atlantic Treaty Organization. A unified military command, with headquarters in Moscow, directed the united forces, which included Soviet divisions stationed in some of the member nations prior to the signing of the treaty. The 1989 collapse of the Communist governments in Eastern Europe made the treaty superfluous, as the new governments repudiated their former ally, the Soviet Union. The Warsaw Treaty Organization dissolved in June 1991.
An attempt to form a new military alliance appeared in Europe recently. On 20 November 2000, European Union Defense Ministers met in Brussels and agreed to the creation of a EU Rapid Reaction Force. The EU force is not a standing army. It follows a similar character to NATO's Allied Command Europe (ACE) Rapid Reaction Corps (ARRC) where certain elements of member states armed forces are earmarked for rapid deployment if the need arises.
2.2 Defense Industry
This section starts with a brief explanation regarding the structure of the defense industry. The rest of the discussion focuses on the characteristics of defense industries.
2.2.1 Structure of Defense Industries
A significant of portion of defense industry in major arms-producing countries were managed and owned by national governments during the 20th century. In the structure of defense industry, the share of public sector and private sector changes according to a country’s political and economic structure in addition to the level of industrialization. In a country without a sufficient capital accumulation and a strong industrial base, it is unlikely to observe private firms. Even in those that met those criteria, governmental support is needed for the success of private firms. Only if enough incentives offered by the government to the private sector, will the private defense industry operate and grow.
Generally defense industries in the world display a mixed structure. Government undertakes the production especially when the demand and profitability is low and when it is strategically undesirable to leave some products to private sector. Especially the production of weapons like rockets and ammunition cannot be orientated to private sector, thus it is supported by the government due to demand changes in time of war and peace.
There are three main models used in this field:
1.GOGO (Government Owned Government Operated): Ownership and operation belongs to the government.
2.GOCO (Government Owned Contractor Operated): Ownership belongs to the government but the operation of the establishment is left to the private sector. Such institutions do not operate when there is no demand but they are kept operatable. 3.COCO (Contractor Owned Contractor Operated): These are the production lines operated when the government needs specific defense products. When there is an industry campaign they can be completely allocated to military production.
2.2.2 Characteristics of Defense Industry
There are four important characteristics of defense industry (Demski and Magee (1992)): an unusual product market, heavy use of quickly changing technology, multiproduct firms, and regulation.
First, the product market is unusual on the demand side because it is dominated by a single customer: national government. There are also other customers, such as foreign countries, but the government dominates the market. Governments, in all parts of the world, generally exert complete control over the size
and timing of demand and indeed, whether there will be a market. Products usually do not even exist before they are needed or demanded by the government. Therefore the amount of risk and uncertainty involved in the defense business has often been considered higher than those in comparable commercial business. This demand side uncertainty depends on changes in the external threat, changes in the availability of substitute weapons or simply changes in governments’ willingness to purchase certain weapons.
Second, technology plays an important role in the industry. Heavy use of quickly changing technology increases the importance of research and development (R&D), which is a costly process. Therefore it is important to spread such high fixed costs over a large level of output. Moreover, there is uncertainty regarding the cost, the performance characteristics of the product as well as the feasibility of underlying technology. This product side uncertainty (internal uncertainty) further increases the total risk of defense industry.
Third, producers are usually multiproduct firms. Commercial products are present as well as various defense products. Some are developed for military purposes, such as combat aircraft, combat ships, armored vehicles, and guns. Others are produced for military purposes but can also be used for civilian purposes as well. Certain transport and communications equipment, logistical services and a wide range of general–purpose goods—such as food, clothing, fuel, and office equipment are examples.
Finally, the defense industry is heavily regulated. Governments regulate accounting practices, procurement standards, pricing and sourcing procedures and even the industry profits.
To sum up, defense industry differentiates from non-defense sector in several aspects. In the following chapter, the focus will be on the US defense industry and the US procurement system.
CHAPTER 3
DEFENSE PROCUREMENT AND REGULATION IN THE US
The structure of this chapter is as follows: The first section presents a brief explanation related to the US defense industry. The second section covers the US procurement system. The chapter concludes with the discussion the regulation and defense profits in the US.
1.1 US Defense Industry
As was suggested by Table 2, the US has a large and strong defense industry. Several laws and regulations give the president and congress extensive authority regarding the development, production and procurement of defense systems. The laws in the US hinder the sale or merger of critical defense systems to foreign firms. In addition, Buy American Act is valid. For military products that is procured by the government, it means a foreign ask should be at least 50 percent lower than a domestic ask to be accepted.
Nonetheless, the US Department of Defense supports international partnerships by American defense companies, where they coincide with US security policy goals or allow US production lines to remain open. US global partnerships can be divided into three groups: Wholly owned subsidiaries, Joint ventures and Government to government programs.
Wholly owned subsidiaries:
In countries where foreign ownership of defense companies is permitted, the establishment of wholly owned subsidiaries is a popular route for US defense companies seeking a local presence. This allows them to claim "local identity" in competitions with national leaders of defense industry, without having to enter into complex joint venture arrangements.
Joint ventures:
In many countries (e.g. Middle Eastern countries), the outright foreign ownership of defense interests is prohibited. These restrictions have forced American defense companies to enter into joint ventures with local companies. Most of these programs have their origin in the Cold War era and many US companies have had mixed results from them in recent years. As defense spending has declined over the last decade, US government aid and local funding for co-production projects has dried up.
Government to government programs:
It is increasingly common for governments to pool resources with allies to fund the development of hi-tech defense equipment. The most important example of this is the Joint Strike Fighter (JSF), which has brought several foreign governments on board as partners and observers.
3.2 US Defense Procurement
Procurement can be described as the process of obtaining services, supplies, and equipment in conformance with applicable laws and regulations in the Federal Government. Procurement is widely used by government agencies and private firms to perform their research, development and production projects. The relationship between the buyer and the seller is in general partly governed by a contract.
The aim of Defense Procurement in the US is to ensure Department of Defense (DOD) contracts and business arrangements provide the best quality weapons, equipment, and services for defense in a timely manner at the lowest affordable cost to the taxpayer, consistent with public laws. The Department of Defense is the only authority in defense procurement.
Defense Procurement has several informational and incentive problems arising out of the complexity of products purchased. Firstly, defense contractors possess private information on technology and cost parameters. This gives them an informational advantage that they would use to extract rents. This problem is called as the self-selection problem. Secondly, contractors’ actions are highly costly to monitor. Hence, appropriate incentives must be provided to elicit the best actions for the purchaser to avoid the moral hazard problem. Thirdly, huge uncertainties exist, both on the demand and supply sides, so that risk-taking is a major entrepreneurial problem. Fourthly, R&D is a major output and hence a major measurement challenge for the purchaser. Finally, appropriate incentives must be provided to the firms engaged in unique projects. This problem is called the hold-up problem.
The life cycle of a defense procurement program can be divided into three phases. In the design phase, multiple firms pursue competing designs. This process often begins with five or more firms, and then decreases to a smaller number. DOD funds most of this research directly. The second phase is selecting the sole source for production. In this phase, firms submit prototypes and final design plans to DOD and typically bid on the next increment of work, which involves finalizing the design, establishing the production line, and producing the first items. Contracts are made in this phase with the firms. The third phase is production, which may last a decade or more. Prices in the production phase are generally cost-based.
Before a discussion of the contracting mechanism in defense procurement, it is useful to review two major contract types described in Federal Acquisition Regulations (FAR, 1984). Federal Acquisition Regulations cover all kinds of government acquisitions.
Fixed-Price Contracts:
Fixed-price contracts require the contractor to deliver the supplies on time and within the price restraints of the contract. These contracts place most of the burden of risk on the contractor. Therefore, contractors will not be interested in fixed-price contracts unless the uncertainties associated with performance are at a manageable and predictable level.
Cost-Reimbursement Contracts:
The Government pays all allowable contract costs when contracts in this category are used. These contracts are primarily used when there is no valid basis for estimating performance costs. Negotiations establish an estimated cost that will be the basis for obligating funds and will act as a ceiling that the contractor may not
exceed without risk. This means the contractor incur expenses in excess of the established cost estimate. Cost-reimbursement contracts impose an administrative burden on both the Government and the contractor, requiring careful surveillance and auditing of costs. These contracts are appropriate for research and development because of the technical and price uncertainty.
In defense procurement, DOD currently uses a version of the cost-reimbursement contracts. This contract type is described in Truth in Negotiation Act (TINA). In a TINA contract, the firm estimates the cost for production and signs a certificate to its accuracy. If the firm produces the product below estimated costs, it must refund the difference to the government. Therefore TINA contract functions like a cost-reimbursement contract. The firm is subject to audit for accuracy and can face criminal prosecution if there is an unreported discrepancy favorable to the firm. The reason for these stringent policies within the TINA contracting process is “asymmetrical information.” The contractor doesn’t know the exact price of manufacturing a product, the firm most likely does. TINA is designed, therefore, to protect DOD from overpricing due to this lack of information.
Nonetheless, TINA contract has also been subject to criticism. For example, Rogerson (1999) argues that through its protective mechanisms for accurate pricing, TINA inhibits incentives for firm efficiencies. DOD cannot monitor a firm’s “unobservable effort:” how efficiently and with what quality a firm works on the product. Because all under-expenditures must be refunded to the government, the firm has no incentive to work harder and lower production costs. If a fixed-price contract option is given to the contractor, the manufacturing of the product would be more efficient. In a fixed-price contract, DOD would price low, but still high enough
the firm keeps profits made through its unobservable efforts. If the firm chooses not to take the fixed-price contract, it can still turn back on the cost-based TINA contract.
Obviously, defense procurement, which is subject to Federal Acquisition Regulations, affects the profits of defense firms. This fact points to the significance of regulation in defense industry. Therefore, in the next chapter regulation and profits in defense industry will be reviewed.
3.3 Regulation and Defense Profits in US Defense Industry
Since the defense industry is a regulated industry it can be expected that the regulatory changes affect the future expected cash flows of related defense firms. There is indeed empirical evidence in the literature that such regulatory activities have considerable impacts on the market value of defense firms. A good example can be the study by Pownall (1986). He examined the shareholder wealth effects of accounting changes made by Cost Accounting Standards Board. Stock prices of defense firms reacted negatively to the debates of changes in legislative standards. It means that market perceived these changes as a deterrent to their profits. Every reform or act that is brought up about the acquisition process aims to make the process more efficient, thus, has a potential to reduce directly firms’ operating cash flows. On the other hand, these regulatory changes may have positive impacts as well. The impact may change according to the properties of the legislation.
There is a strategic importance for the US to have a leading defense industry. On the other hand, large amounts of money spent on military equipment naturally attracts public attention. According to Bohi (1973) the issue is of critical
importance, for if profit rates are too high the nation is wasting resources and taxpayers are overburdened, while if profit rates are too low, resources will flow out of defense business and jeopardize the quantity and quality of sources of supply.
Throughout the history there has always been a natural discussion about the profits of defense contractors. After World War 2, it was said that defense firms had earned excess profits due to urgent demand for weapons and other military products during the war. These discussions led to the foundation of the renegotiation board. The renegotiation board was established under the renegotiation act of 1951. The aim of the board was to insure that contractors do not reap unusual profits.
To understand what the renegotiation board does, there is a need to clarify the profit-limitation process in the defense sector. Rogerson (1994) points to two phases of profit limitation. The first phase is the negotiation of individual contracts by the procurement agencies and the contractors. At this point the profit on each contract is established ex ante, usually as a component of the total estimated cost (price) of the contract. Disputes that arise at contract settlement over allowable costs and fees are usually settled by negotiation. In some cases this fails and parties go to the Armed Forces Board of Contract Appeal. The second phase is profit renegotiation, an ex post review of a contractor’s total profit from all contracts during his fiscal year. This is the responsibility of the Renegotiation Board, which is independent of procurement agencies. When the board finds excess profits in its review, it recaptures them, either by agreement or by order. Contractors may petition the United States Court of Claims for a redetermination of the issue if they feel that the conclusion is unfair.
Gallaway (1970) discuss the criteria that the board considers in order to determine this issue. These criteria can be summarized as follows:
• The reasonableness of costs to the government
• Contractor profits based on net worth and the amount of capital employed in the productive process
• The extent of the risk entailed in the activity
• The character and complexity of the techniques used to produce the product
• Considerations of the public interest
The effectiveness of the board was evaluated empirically by Agapos and Gallaway (1970) and rationale of the board as a regulatory device in the aerospace industry has been found debatable.
The debate did not stop after the establishment of the renegotiation board and there appeared a need for more efficient acquisition policies that will neither lead to waste of public resources nor eliminate all the profits in the defense industry. This accelerated the efforts for reforming the federal acquisition policy. As explained in the previous chapter, federal acquisition is a more general concept. It comprises the regulations related to non-defense acquisition as well as defense acquisition. However, in federal spending on goods and services, the Department of Defense plays a dominant role, accounting for two-thirds of all federal acquisition spending.
There have been several major acquisition reform initiatives in history and these are likely to affect the profits of defense industry. These reforms have been motivated by several factors. The first factor is the perceived contractor waste, fraud and abuse that led to regulations regarding the contracting mechanism. The second factor is the efforts to centralize the acquisition decision-making process. This factor
is motivated by the complexity and confusion surrounding the procurement system. Finally the last factor is the desire for increasing the competition in the acquisition environment. The major reforms will be discussed in chapter 5.
To sum up, defense industry has been the focus of discussions in private and official circles. The question was whether excess profits exist in the industry. The next chapter gives a review of literature on defense procurement and profits of US defense contractors.
CHAPTER 4
LITERATURE REVIEW
There are several studies related to the defense industry, the defense procurement and specifically to the profits of US defense contractors. These studies point to different aspects of the topic and vary in terms of scope. The question of whether defense contractors earn greater returns than other companies is controversial, and despite numerous studies the issue remains unsettled. The disagreement is not surprising because studies in the literature are not comparable. They consider different groups of firms and different time periods, and they employ different measures of profitability (Trevino and Higgs 1992). These studies can be divided into three groups. The first group of articles directly tests the hypothesis that profitability of defense contractors is higher than that of other firms. The second group of articles examines the procurement process and offer alternative strategies for efficiency. Finally, the third group of studies investigates the reason why there may be excess profits in the defense industry. The reason for excess profits can be the procurement process itself. Thus, the process itself poses some problems. These studies test the so-called cost-shifting hypothesis, which is a result of joint costs problem in defense procurement.
4.1 Studies Related to Relative profit performance of Defense Firms
Before 1970, there are two important studies related to defense profits in the US. The first study is Weidenbaum (1968), which examines the profit rates (profits as a percentage of net worth) of six aerospace contractors doing more than 75 percent of their total business with the Department of Defense or NASA. The study compares sample firms with six commercial firms having similar total sales volumes based on profits over two time periods: 1952-1955 and 1962-1965. Weidenbaum study concludes that the defense business is more profitable than nondefense business and, argues that the defense industry is becoming more concentrated and as a result less competitive. The second study is that of Logistics Management Institute (LMI, 1969) for the Department of Defense. The LMI study concludes that, between 1962 and 1968, profit rates of defense firms (as a percentage of net worth) are consistently lower than profit rates of a broad sample of commercially oriented firms. Moreover, the study finds a downward trend in industry profits since 1962 and argues that this is the result of increasing competition in the industry.
Agapos and Gallaway (1970) investigate defense firms’ profits over the period 1942-1967 to see the effect of the renegotiation board. Their empirical model that explains profits includes a dummy variable to measure the effect of the renegotiation board. The coefficient of the renegotiation board dummy variable is insignificant showing that the presence of the renegotiation board does not affect the profits of defense firms.
Stigler and Friedland (1971) examine the profitability record of the defense business with regard to stock market performance over two periods, 1948-61 and
market by a large margin, and the difference disappears in the second period. Therefore they conclude that the popular view of unusual profits of defense contractors is correct for the 1950s and incorrect for the 1960s.
Bohi (1973) examines the profit performance of defense industry firms to determine whether the profit rates of firms engaged heavily in defense contracting differ significantly from profit rates of non-defense oriented firms between 1960 and 1969. On the basis of the sample of 36 defense contractors considered, he concludes that there is no evidence for arguing that the defense industry is more or less profitable than other industries in general.
Greer and Liao (1986) analyzed defense firms’ profits and risks between 1963 and 1982. The study concludes that defense business has generally been less profitable than commercial business even though the risk level is higher.
Trevino and Higgs (1992) examine the profits of the top 50 defense contractors and compare them with the profits of comparable non-defense companies. They find that profit rates of defense contractors exceeded those of comparable non-defense companies during the period 1970-1989. Their conclusion holds regardless of whether profits are measured by the firms’ accounting rate of return or by the stock market payoff to shareholders in the form of dividends and capital gains. They also conclude that investing in defense contractors was not significantly riskier than investing in comparable non-defense companies.
Using longitudinal data on almost 9,300 industry segments from the compustat file, Lichtenberg (1992) tests and finds strong support for the hypothesis that government contractors (especially defense contractors) are more profitable than other firms. According to his estimates, from 1984 to 1989, the average annual profit
rate (return on assets) of these contractors as a whole is 68 to 72 percent higher than that of other segments.
4.2 Studies related to defense procurement and its efficiency
Pownall (1986) examines the impact of regulatory changes that arise from the Cost Accounting Standards Board (CASB). In general, his results indicate that, at least for the less competitive defense contractors, security returns declined at the time of the initial debates concerning regulation of contractors’ cost accounting practices, indicating anticipated decreases in profitability associated with defense contracting activities. These results suggest that market agents viewed the accounting standard-setting agency as a deterrent to at least some firms’ abilities to extract excessive cost reimbursements from the government.
Rogerson (1989) argues that informational and incentive constraints inherent in the innovation process require that regulatory institutions in defense procurement create prizes for innovation. He claims that since the quality of an innovation is difficult to describe or measure objectively, the most natural method for awarding prizes is to allow firms to earn positive economic profit on production contracts. He uses stock market data to estimate the size of the prize that firms compete for. His basic idea is to calculate the change in market values of firms competing for a prime contract award around the day it was announced which firm won. The values of the prizes on 12 major aerospace projects are found to be large.
Kovacic and Smallwood (1994) discuss the issue of mergers and acquisitions in the defense industry over the period 1992-1994. They discuss how DOD could
them, if DOD would not develop an effective capability for analyzing the competitive effects of consolidation events, then either contractors would have free rein to determine the structure of the defense supplier base, or the task would fall to other government institutions, such as the antitrust agencies and the federal courts. Karpoff et al. (1999) examine the market and legal penalties imposed on firms suspected or accused of procurement fraud between 1983 and 1995. They find that on average, firms investigated for procurement fraud suffer statistically significant in market value around the announcement dates. The negative reaction is less pronounced for firms ranked among the top 100 military suppliers.
4.3 Cost Shifting Hypothesis
It may be argued that a major reason for the interest in defense profits is the so-called cost-shifting hypothesis. Rogerson (1992) claims that the cost allocation rules used in government contracting enable and encourage contractors to shift some of the costs of their commercial operations to the government. He argues that the methods used by defense firms for calculating the cost of products- in particular, the allocation of overhead in proportion to directly charged labor use- enable these firms to shift overhead from commercial to defense business.
Thomas and Tung (1992) argue that government contractors are able to reduce their cost of doing nongovernmental business by overfunding pension plans when employees work on defense contracts (these contributions are reimbursed by the government) and withdrawing excess pension assets when employees work on commercial business. They empirically examine the relation between funding levels and proportion of revenue from defense contracts for a sample of 80 major
Department of Defense contractors between 1971 and 1980. They also compared the pension funding empirically between defense and non-defense samples. The study suggests that the ability to shift costs from commercial to defense business should allow ‘mixed’ firms to be more profitable than purely commercial firms.
A recent study about the cost-shifting hypothesis is the one by Mcgowan and Vendrzyk (2002). They test the conjecture from prior research that defense contractors’ excess profitability stemmed from their ability to shift common overhead costs to government contracts that typically allow cost reimbursement or price renegotiation. Although they confirm that defense contractors enjoyed abnormally high profits on their government work over the 1984-1989 period, they find no evidence that these excess profits are attributable to cost shifting.
Table 3 displays the summary of studies related to relative profit performance of defense firms. Most of the studies used accounting data for the analysis while a few of them relied on stock data. These studies cover different time periods from 1952 to 1989 and most of them find abnormal returns for defense firms.
TABLE 3
Summary of Studies Related to Relative Performance of Defense Firms
Author Date of publication Period Examined Findings Measure
Weidenbaum 1968 1952-1955 High Accounting
1962-1965 High Accounting
LMI
(Log.Man.Ins.)
1969 1962-1968 Low Accounting Agapos&Gallaway 1970 1942-1967 Normal Accounting
Stigler&Friedland 1971 1948-1961 High Stock
1958-1968 Normal
Bohi 1973 1960-1969 Normal Accounting
Greer&Liao 1986 1963-1982 Low Accounting
Lichtenberg 1992 1984-1989 High Accounting
Trevino&Higgs 1992 1970-1989 High Accounting&
Stock McGowan&
Vendrzyk
2002 1984-1989 High Accounting
CHAPTER 5
METHODOLOGY AND DATA
The purpose of this study is to examine the long-run stock market performance of US defense stocks over different time periods and analyze the impact of changes in Federal Acquisition Policy on defense stock returns. Acquisition policy, which is the focus of this study, is just one of the factors that affect defense industry profits. Other factors can be the general demand for weapon systems, which may change due to political considerations and wars, the level of competition in the defense industry or the speed of technological improvements. This type of a study that measures the impact of specific events on the value of firms is called ‘event study’ in the literature. The structure of this chapter is as follows: The first two sections describe the methodology used in measuring the relative performance of defense stocks and conducting the event study. The third section describes the data
5.1 Relative performance analysis
In chapter 3, the literature on defense firms’ profits was discussed. These studies differ in several ways: sample formation, the period of the analysis, and the measure of profitability. Not surprisingly, their findings also varied.
In this study, relative performance of defense stocks is examined over the period from 1945 to 2000. This is a long enough period and includes the periods
5.1.1 Classification and Periods examined
The sample period is examined by focusing on sub periods based on the structure in the Defense Acquisition History project1 of the US Department of Defense. The aim of this ongoing project is to examine the evolution of defense acquisition process over time. It divides US defense acquisition history into five major sub-periods. Table 4 depicts these sub-periods, and the events that start them. The major characteristics of each sub period can be summarized as follows:
Into the cold war, 1945-1958
This period starts with the end of World War 2, which can be called the beginning of the cold war era. The international role of the US has been very important during the first decade of the Cold War. Acquisition organizations, policies, and processes were important to support the country in this respect. In an atmosphere of intense rivalry, the Armed Services applied new organizational structures and management theories to the development of increasingly complex weapon systems, such as the Atlas intercontinental ballistic missile and the Polaris submarine-launched ballistic missile. To a greater extent than ever before in peacetime, the Armed Services came to rely on the resources of the private sector to fulfill their material requirements as the scope, scale, and complexity of acquisition increased.
Not very much effort was exerted to reform the acquisition system in this period. Moreover, there was an increasing political tension with Soviet Union and it led to development of complex weapon systems. These features make this period suitable for defense firms to earn excess profits.
TABLE 4
Major Periods In Defense Acquisition History
Name of the Period Date Event That Starts the Period Date of the Event Into the Cold War 1945-1958 The end of world war 2 September 2, 1945 Centralization and
Systematization 1958-1968
Enactment of Defense
Reorganization Act April 3, 1958 Retrenchment and
Reform 1968-1980 Election of Nixon as president
November 5, 1968 From the Reagan
Buildup to the end of the Cold War
1980-1989 Election of Reagan as president November 4, 1980
The Post-Cold War
Era 1989-2000
The end of cold war (Fall of Berlin Wall)
November 9, 1989 Source: Defense Acquisition History Project, US Department of Defense
Centralization and Systematization, 1958-1968
This period starts with the Defense Reorganization Act of 1958, which gave the Office of Secretary of Defense (OSD) significantly greater control over the acquisition process. Several changes in the acquisition process occurred during the tenure of Secretary of Defense Robert S. McNamara. Utilizing his authority, McNamara introduced a new program to ensure that weapons procurement supported the Kennedy Administration's new national military strategy, which emphasized flexible nuclear response and the strengthening of conventional force capabilities.
contracting. By the time he resigned from his post in 1968, McNamara’s strategies and methods in the field of acquisition had become the focus of considerable criticism within and outside the U.S. Government. Nonetheless, several of McNamara’s reforms have had far-reaching effects.
In summary, the new national military strategy for nuclear and conventional weapons created new opportunities for the defense industry to increase its sales to the government. However, the reform efforts may have negative impacts for the defense industry profits.
Retrenchment and Reform, 1968-1980
The election of Nixon as president is the starting point for this period. The first important characteristic of this period is Davis Packard’s efforts. David Packard, the Deputy Secretary of Defense in the Nixon Administration, initiated the overview of the reforms upon his assumption of office in 1969. Packard’s efforts focused on changes in the acquisition process that were intended to reduce dependence on concurrent development. He emphasized competition to improve system performance. Moreover, Packard initiated the development of a group of government acquisition professionals. Foundation of the Defense Systems Management School is an example of this effort.
The second important characteristic of this period is the budget reductions of the 1970s. Popular opposition to the Vietnam War led to pressure for reduced U.S. defense spending, which consequently resulted in a lower state of operational readiness for U.S. forces. Moreover, quantitative and qualitative gains by the Soviets in military forces (and strategic weapons in particular) threatened the military
technological dominance of the United States. This fact forced the US to develop high-profile weapon systems like F-15 fighter aircraft.
To sum up, the interaction of acquisition reforms with budget reductions of 1970s characterizes this period. Although it is hard to predict the net effect of these on defense profits, it is clear that budget cuts and Packard’s efforts related to improving competition should affect defense firms in a negative way, especially in an environment where the US is eager for new weapons due to Soviet Union threat.
From the Reagan Buildup to the End of the Cold War, 1980-1989
This period starts with the election of Reagan as president. There are two main features of the period. First, this period saw an increase in defense budget and the resulting deficit. Second, it was a period of successful and intense efforts to reform the acquisition process.
In the first years of the period, defense budgets increased rapidly in response to the perception that the US had allowed its armed forces to dwindle, while the Soviet Union had continued to boost its armed forces. In order to deal with the budget deficits that resulted from increasing spending, while cutting tax revenues, Congress passed the Gramm-Rudman-Hollings Deficit Reduction Act in October 1985.
In terms of the efforts related to defense acquisition reform, there are several initiatives in this period. During the 1980s Congressional reformers launched the Military Reform Caucus, an informal coalition of House and Senate members. The Caucus’ efforts resulted with the 1984 Competition in Contracting Act (CICA),
Management (the Packard Commission) in 1986. The Commission considered not only the management of the acquisition process, but also the budget process and legislative oversight. Finally, defense acquisition had to address the growing importance and impact of technology and technological change. Advanced technologies were the object of acquisition in the form of such weapon systems as cruise missiles, and stealthy aircraft. Technology also helped to simplify acquisition processes through the automation of acquisition management and logistics.
In the first five years of the period, it can be expected that defense firms earned excess profits. However, the Gramm-Rudman-Hollings Deficit Reduction Act and the several regulatory initiatives have a considerable potential to restrict excess profits during the rest of 1980s.
The Post-Cold War Era, 1989-1999
The end of cold war starts this period. The first feature of this period is the uncertainty and difficulty of strategic planning after the end of cold war. The second feature is the effort of the Armed Services to transform themselves. The third feature is the deficit reduction after the end of Gulf War. Finally, landmark regulation and legislation characterized the period.
First, the collapse of the Cold War international regime brought much uncertainty about the future direction of U.S. military policy and the source of future threats. The Persian Gulf crisis of 1990-91 revealed the difficulty of strategic planning in an ever-changing world. Security threats were increasingly difficult to measure or even define; terrorism, humanitarian disasters, and even information attack became military problems.
Second, rapid technological change, especially in information technology and other high-tech fields resulted in the Revolution in Military Affairs (RMA). By the end of the 1990s, the Armed Services were all engaged in efforts to transform themselves, technologically and organizationally, in accordance with RMA concepts.
Third, after the Gulf War a deficit reduction occurred. The Armed Forces steadily declined in size, as defense budget was reduced. This limited the funding available for research, development and procurement, and it led to consolidation within the defense industry.
Finally, this period witnessed the passage of landmark legislation and the promulgation of new regulations to professionalize the acquisition workforce and introduce new acquisition practices and organizations. 1993 National Performance Review (NPR), 1994 Federal Acquisition Streamlining Act (FASA) and 1996 Clinger-Cohen Act were among these regulations. These reform efforts were driven not only for the purpose of efficiency, but also by the extreme scarcity of resources. In summary, the end of cold war, decreasing defense budgets and the landmark reforms in the acquisition process are factors that have the potential to reduce defense industry profits. However, there may be defense firms, which benefited from the potential reduction in competition caused by the consolidation in the industry.
5.1.2 Methodology Used in the Relative Performance Analysis
The analysis compares the performance of a defense stocks portfolio to that of a benchmark portfolio in each of the five sub-periods. Thus, two different portfolios
defense firms; the other is the benchmark portfolio, which is composed of Center for Research in Security Prices (CRSP) New York Stock Exchange (NYSE) market capitalization deciles.
The choice of benchmark is more important when long-term rather than short-term performance is measured. Evidence in Dimson and Marsh (1986) suggests that an adjustment for firm size is important in studies of long-run performance. They demonstrate that size effect can distort long-term performance measures. They point out that performance measures can be seriously distorted (1) when event stocks differ in size or weighting from the index constituents, (2) when the size effect is large (3) when the measurement interval is long. Fama and French (1992) document that stock returns are related to firm size and book-to-market ratios. Barber and Lyon (1997) argue matching sample firms to control firms based on these two characteristics gives more reliable results since it eliminates new listing, rebalancing and skewness biases. Due to data limitations, it was not possible to control for the book-to-market ratio characteristic in this study.
Defense stocks portfolio:
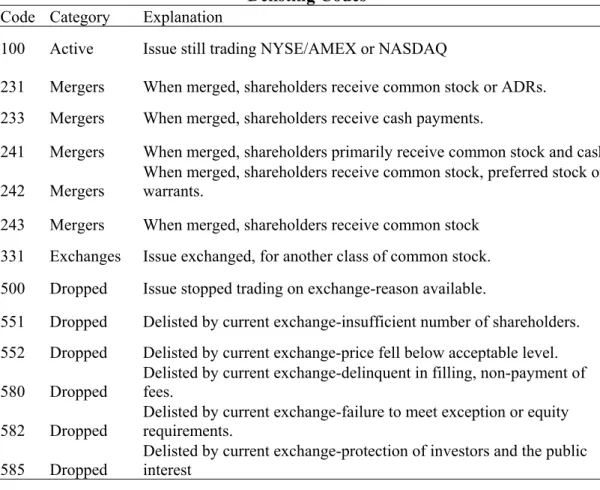
For each period, securities available at the beginning of the period are used to form the defense stocks portfolio, which is equally weighted and rebalanced monthly. If a security drops out from one month to the next, the equally weighted average return is calculated using the remaining securities. Delisting of a security can be because of a merger, exchange or liquidation. Delisting information is demonstrated by the delisting codes in CRSP, which classify the cause of delisting into 57 categories. Table 5 depicts the delisting codes observed for the sample firms in this study.
TABLE 5 Delisting Codes Code Category Explanation
100 Active Issue still trading NYSE/AMEX or NASDAQ
231 Mergers When merged, shareholders receive common stock or ADRs. 233 Mergers When merged, shareholders receive cash payments.
241 Mergers When merged, shareholders primarily receive common stock and cash 242 Mergers
When merged, shareholders receive common stock, preferred stock or warrants.
243 Mergers When merged, shareholders receive common stock 331 Exchanges Issue exchanged, for another class of common stock. 500 Dropped Issue stopped trading on exchange-reason available.
551 Dropped Delisted by current exchange-insufficient number of shareholders. 552 Dropped Delisted by current exchange-price fell below acceptable level. 580 Dropped Delisted by current exchange-delinquent in filling, non-payment of fees. 582 Dropped Delisted by current exchange-failure to meet exception or equity requirements. 585 Dropped
Delisted by current exchange-protection of investors and the public interest
Source: Data Description Guide for the CRSP US Stock Database and CRSP US Indices Database.
Benchmark portfolio:
The design of the benchmark portfolio is similar to Agrawal et al. (1992). CRSP NYSE market capitalization decile portfolios are used for this purpose. These portfolios are rebalanced by CRSP each year, using the security market capitalization at the end of the previous year to rank the securities. The largest securities are placed in portfolio 10 and the smallest securities are placed in portfolio 1. Using the capitalization values of sample firms and the minimum and maximum market values
falling into that decile. Benchmark portfolio is rebalanced monthly to account for any changes in weights due to delistings of sample stocks.
As a result, for each of the five periods, two portfolios were constructed with monthly time series of returns. Using the monthly returns, four measures were calculated for both portfolios. These measures are; Rp (Average return of the portfolio), BHR (Buy and hold return of the portfolio), β (Beta) and σ (Standard deviation).
1.
R
p : Average monthly return of the portfolio over each period, is calculated as: ∑ = T pt p R T R 1 1 , ( 1 )where
R
pt is the return of the portfolio in month t and T is the number of months in the period.2. BHR: Buy and hold return of the portfolios, at the end of each period is given by: ∏ + = = T t Rpt BHR 1(1 ), ( 2 )
where
R
pt is the return of the portfolio in month t, T is the number of months in the period.We can always split the variance of the return on a security or portfolio into two parts:
( )
β σ( )
σ( )
ε σ2 = 2 2 + 2r
r M . ( 3 )
The first term on the right hand side of the equation is called the systematic risk of the investment. It accounts for that part of the security’s variance, which cannot be diversified away. This part of the variance measures the contribution of an
asset to the variance of a well-diversified portfolio. The second term is called residual variance or unsystematic risk. It represents the part of a security’s total variance that disappears as we diversify.
3. β (Beta) of the portfolio: β represents the systematic risk of the portfolio. This measure was calculated for each portfolio by regressing portfolio returns on CRSP NYSE value-weighted index.
4.σ (Standard deviation) of the portfolio: This measure represents the total risk of the portfolio. It is calculated as follows:
σ =
(
)
T R p R pt T t ∑ − =1 2 , ( 4 )where Rp is the mean of the monthly portfolio returns over the period, Rpt is the return on portfolio in month t and T is the total number of months in the period. In testing the difference between sample and benchmark returns, t-test and Wilcoxon ranksum test were employed. These are parametric and non-parametric tests, respectively. A parametric test assumes that data come from a specific distribution, usually the normal distribution. A non-parametric approach is free of such an assumption. The inclusion of a non-parametric test provides a check of the robustness of conclusions based on a parametric test. Therefore, both tests were employed in the analysis.
t-test tests the equality of means. The test statistics for µx=µy for unknown σ and σ σx≠ y, is given by:
(
)
S y S x y x t 2 2 + − = , ( 5 )Wilcoxon ranksum test is based on ranks and tests the hypothesis that two independent samples come from distributions with equal medians. The test statistic is: ) ( ) ( T Var T E T z = − , ( 6 )
where T is the sum of ranks for the observations in the sample.
5.2. The Impact of Regulatory Changes
This section is organized as follows. First, the event study concept is reviewed. Next, the advantages of using the multivariate regression model (MVRM) in event studies are described. Finally the version MVRM used in this study is discussed.
5.2.1 Event Studies
An event study measures the impact of a specific event on the value of a firm. The usefulness of such a study comes from the fact that, given rationality in the market, the effects of an event will be reflected immediately in security prices. (Mackinley (1997)) According to Mackinley, by using the event study methodology a measure of the event's economic impact can be constructed using security prices observed over a relatively short time period. In contrast, direct productivity related measures may require many months or even years of observation. The event study has many applications. In accounting and finance research, event studies have been applied to a variety of firm specific and economy wide events. Some examples
uity, and announcements of macro-economic variables such as the trade. According to Megginson (1997) event studies became an important tool of research because of their clarity of purpose, flexibility, and absence of confusing influences.
There are four types of event studies:
1. Market efficiency studies: They assess how quickly and correctly the
market reacts to a particular type of new information.
2. Information usefulness studies: They assess the degree to which company
returns react to the release of a particular bit of news.
3. Metric explanation: In a metric explanation study, the event study is only the
first step. Early studies explained the metrics (extra returns) by splitting the sample into different sub samples and examining whether the unusual element of returns differed among the sub samples. More recent studies use excess returns as dependent variables in cross-sectional regressions to explain the source of the extra returns.
4. Methodology studies: These are related to event study design, research that
considers how best to run event studies.
Although there is not a unique method, most of the event studies use the following main steps:
1. Defining the event date: The event can be a dividend announcement, a
regulation, or any news that the market may react. Event date is the date when the market anticipated the news related to the event.
2.Measuring abnormal returns: Abnormal returns are the difference between