FINITE ELEMENT MODELING OF MICRO-PARTICLE SEPARATION USING
ULTRASONIC STANDING WAVES
Süleyman Büyükkoçak TOBB University of Economics &
Technology Ankara, Turkey
Barbaros Çetin Ihsan Dogramaci Bilkent
University Ankara, Turkey
Mehmet Bülent Özer TOBB University of Economics &
Technology Ankara, Turkey
ABSTRACT
Acoustophoresis which means separation of particles and cells using acoustic waves is becoming an intensive research subject. The method is based on inducing an ultrasonic compression standing wave inside a microchannel. A finite element approach is used to model the acoustic and electro-mechanical behavior of the piezoelectric material, the micro-channel geometry as well as the fluid inside the channel. The choices of silicon and PDMS materials are investigated as the chip materials for the resonator.
A separation channel geometry which is commonly used in the literature is implemented in this study and the fluid flow inside the microchannel geometry is simulated using computational fluid dynamics. The acoustic field inside the fluid channel is also be simulated using the finite element method. For the separation process to be successful micro-particles of different diameter groups should end up in different channels of the micro-separator. In order to simulate real life scenarios, each particle size group have a size distribution within themselves. For realistic simulation results the particles will be released into the micro separator from a different starting locations (starting location distribution). The results of this Monte-Carlo based finite element simulation approach will be compared with the reported experimental results.
INTRODUCTION
Separation of particles using ultrasonic standing waves is becoming an important research area. One reason for such an interest from research community is the potential of the method in cell separation applications. Conventionally, high throughput cell separation applications generally rely on centrifugal separation or membrane filtration techniques. Both techniques may expose the cells under shear stress which may affect viability of the cells. For instance, platelets under stress may activate and start clotting which can result in failure of an aphaeresis process. Therefore, there is a need for separation
methodologies which induces minimal stress on cells. This need makes acoustophoresis an active research field.
The particle/cell separation using ultrasonic standing waves relies on acoustic radiation force being directed on the particles in a microchannel. The acoustic radiation force on a particle depends on particle’s size, density and acoustic property. Different properties of particles creates different amount of acoustic radiation force on these particles. Different amplitude of radiation force acts on particles with different properties which results in different amount of deflection for each particle during the fluid flow in the micro-channel. As a result, the particles can be directed into different locations of the micro-channel depending on the properties of these particles which leads to separation of particles according to their properties. Using this principle, several experimental studies were performed where separation of particles and cells was succeeded [1-7].
In order to apply the methodology, there needs to be an actuator which induces the ultrasonic pressure waves. Particles need to be in a channel within a fluid where they may be transported and separated in. The generated ultrasonic waves are transmitted to the channel and the fluid through the chip material. The system composed of aforementioned components is called a resonator. The generation of sufficient acoustic radiation force depends on the selection of the correct parameters for the resonator design. In literature typical way to excite the resonator system is to use piezoelectric materials. There is a wide range of materials for the choice of chip material which includes glass [8], steel [9], silicon [1], ceramic based materials [10] and PDMS [11]. The fluid medium is generally saline or buffer. This would not make a difference since most of these conducting or preserving fluids have similar acoustic impedances and acoustic wavelengths.
Proceedings of the ASME 2014 12th International Conference on Nanochannels, Microchannels, and Minichannels ICNMM2014 August 3-7, 2014, Chicago, Illinois, USA
The number of studies in literature where numerical methods are used to understand the performance of resonators and separation process is significantly less compared to experimental studies that show the feasibility of the acoustophoretic process with tests. The modeling efforts so far have been mainly on the finite element modeling (FEM) of acoustic radiation force applied on the particles [12-13]. There are a few studies where the resonators are numerically modeled and their performance is tried to be optimized through numerical simulation tools [14-15].
In this study, a finite element model of the resonator is developed in 3D. The piezoelectric material, the chip material and the fluid within the channel are modeled using a finite element tool. The acoustic field inside the chip and the channel is determined through an electromechanical-structural-acoustic coupled analysis. Once the acoustic pressures inside the channel are obtained, the trajectory of the particles is simulated by determining the acoustic radiation force and the drag force on the particle using the acoustic and flow field. To the best of authors’ knowledge, this study is the first study which couples the electro-mechanical, structural, acoustic and fluidic domains in 3D to simulate the trajectories of particles.
In the next section, the theoretical background and analytical relationships used for the solution of the problem will be presented. Section II of the study will summarize the resonator and the flow characteristics as well as the numeric solution approach for the problem. The results of the sample numerical simulations will be presented in Section III. Finally, some conclusions and discussions about the method and the simulation results will be provided in Section IV.
I. THEORY
This study contains a semi analytic and semi numerical approach. Once the acoustic field due to the piezoelectric material is calculated using FEM, the acoustic radiation force on a particle inside the microchannel is calculated as follows [1]:
rad acoust U
F , (1)
where in the above equation Frad is the acoustic radiation force and Urad is the radiation potential.
2 in f 2 2 in 2 f f 1 3 rad v 4 3 f p c 2 1 f a 3 4 U (2) 2 p p 2 f f 1 c c 1 f , (3)
f p f p 2 2 2 f (4)In equation (2), the expression for the acoustic radiation potential is given. In that equation ‘a’ represents the radius of a spherical particle, ‘f’ is the density of the fluid inside the
channel and ‘cf’ is the speed of sound in the fluid. In the same equation ‘pin’ is the incident field on the particle and the ‘vin’ is the particle velocity at the location of the particle. ‘< >’ operator represents an average calculation with respect to time. In equations (3) and (4) ‘p’ and ‘cp’ represent the density and speed of sound of the particle, respectively.
Using equations (1)-(4) one can calculate the acoustic radiation force field around a particle in a micro-channel. The acoustic pressure field and acoustic particle velocities are calculated through FEM. Therefore, ‘pin’ and ‘vin’ terms are known once the acoustic solution inside the micro-channel is obtained. Using the particle acoustic and density properties and the acoustic properties of the solution around the particle, one can calculate the spatial derivatives; hence, calculate the acoustic radiation force vector on the particle. The main assumptions in this calculation are:
the particle size is much smaller than the acoustic wavelength,
and the acoustic field does not scatter from other particles (low concentration of particles).
During the acoustic separation process, the only force acting on the particle is not the acoustic radiation force, but there exists a force due to fluid flow around the particle. If a force balance was to be written around the particle, there would also be a fluid drag force on the particle. The force on the particle due drag is calculated using the following equation:
p
drag 6 au u F (5) acoust drag F F (6)Equation (5) is the equation for well-known Stoke’s Law. It approximates the drag force under low Reynolds number on a spherical particle. In the above equation, ‘u’ vector is the fluid velocity at the location of the particle. This value is known once the flow field is calculated by solving the Navier-Stokes equation using a finite element approach. The parameter ‘’ represents the dynamic viscosity of the fluid. One can solve for the particle velocity ‘up’ if the drag force is equated to acoustic radiation force. This velocity information allows determining the trajectory of the particle.
The other two forces that are omitted in this analysis is the force related to Brownian motion as well as inertial forces. The range of particle diameters 3-10 m is too small for inertial forces to be considered, and too large for Brownian motion related forces to be dominant. Moreover, forces due to weight of the particle is neglected since the particles are in the separation channel for around a second which is not enough time for particles of the given sizes to experience sedimentation.
II. MODELING OF THE SEPARATION SYSTEM AND NUMERICAL MODELING
II.1 Modeling And Components of the Separation System
The separation system is composed of the following components: 1. Piezoelectric material 2. Chip 3. Microchannel 4. Glass material 5. Fluid 6. Micro-particles
In the following sub-topics, each component of the acoustophoretic separation channel will be explained.
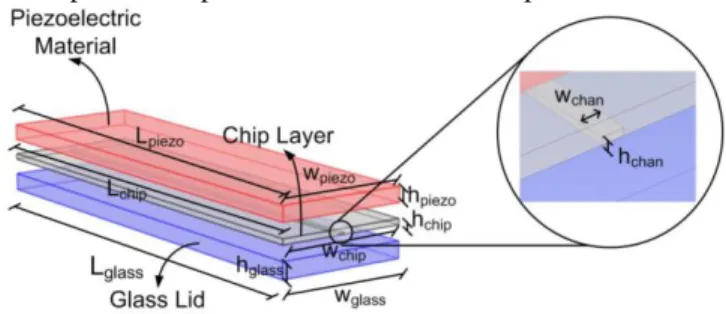
Figure 1. Acoustophoretic separation system components
II.1.a. Piezoelectric Material:
The purpose of using a piezoelectric material is to induce waves in the ultrasonic frequency range onto the chip. This creates acoustic standing waves on the channel that will result in acoustic radiation force on the particles. The electro-mechanical properties of a PZT-4 material is used in the simulations. The piezoelectric material is given an electric potential along the z-direction (thickness z-direction in Figure 1) which results in oscillations along all principal directions. Depending on the excitation frequency piezoelectric material assumes a shape which is close to the nearest modeshape of the material. The modeshape determines along which direction maximum amplitude oscillations will be experienced by the piezoelectric material. The model assumes perfect binding of the piezoelectric material and the chip. Hence the chip assumes the shape given by the piezoelectric material at the piezoelectric material-chip material interface.
II.1.b. Chip:
The chip component of the acoustic separation system is in between the glass layer and the piezoelectric material as shown in Figure 1. The micro-channel is machined (or etched) onto the chip. The piezoelectric material sends the pressure waves onto the chip, and the chip transfers these waves to the channel and
the solution (carrying fluid) through the chip walls. This results in standing waves across the channel which induces acoustic forces on the micro-particles suspended inside the fluid. Chip materials used in the numerical studies are silicon and PDMS. II.1.c. Micro-channel:
The microchannel of the separation system is machined onto the chip material and the width of the channel is half the acoustic wavelength in water at the excitation frequency. Hence, a half acoustic pressure wave fits across the x-direction of the microchannel (width direction in Figure 1). It is aimed to get an acoustic pressure distribution which would cause the acoustic radiation force to move the particles to the center of the channel along the width direction in Figure 1. This would require absolute value of the acoustic pressure at the centerline of the channel (center along x-direction) to be minimum. The half pressure wave across the width of the channel can be of cosine or sine form which will be determined from the channel wall boundary conditions. The cosine form of the pressure waves in the channel creates zero acoustic pressure along the centerline, however a sine form of the acoustic pressure waves depending on the values of the acoustic impedances of the fluid and the chip material, may or not may not create a minimum pressure along the centerline.
The width and the height of the channel is shown in zoomed out portion of Figure 1. The micro-channel extends beyond the acoustically active region and non-scaled drawing for the channel is shown in Figure 2. As shown in Figure 2 only the 20mm portion of the microchannel is inside the acoustic separator. The remaining of the network is machined in the chip but there exist no piezoelectric material in contact other than the 20 mm portion. As can be seen the microfluidic circuit has three inlets and three outlets. The micro-particles and the suspension medium enters the channel from the inlets and the particles of different size groups exit from the outlets. The microfluidic channel shown in Figure 2 is the experimental setup used in the study of Petersson et al [1]. In this study for numerical simulations, their experimental setup parameters will be used.
Figure 2. Microfluidic circuit used in the simulations II.1.d. Glass
The glass material is used for creating a channel from the machined (or etched) portion of the chip. The glass becomes the base of the channel by being bonded onto the chip surface. Hence, the fluid flows in the space between the chip and the glass layer. In practice, a transparent glass like material is chosen for visual accessibility of the channel.
II.1.e. Fluid:
Particles suspended inside the fluid enters the microchannel network form Inlet 1,2 and 3. In the experimental study of Petersson et. al [1], the suspension fluid (buffer) enters from Inlet 3 (center channel) and mixed sizes of micro-particles enter from the side inlets of 1 and 2. The flow rates inside at Inlet 1 and 2 are 5-10 times smaller than the flow rate of Inlet 3. This will be further discussed in the next sub-section and the specific values for flow rates will be provided in the Numerical Simulations Section. In terms of acoustic properties, the fluid type does not make a big difference since buffer types which are commonly used have similar acoustic impedance.
II.1.f. Micro-particles:
The micro-particles used in the simulation are three different diameter micro-particles of 3 m, 7m and 10 m. The particles enter to the separator system through Inlet 1 and Inlet 2 in mixed form with the same flow rates. As mentioned above, the buffer solution is pumped from Inlet 3 which is 5-10 times larger in flow rate. Therefore after entering the main channel from the side channel the particles are pushed to the channel walls due to this higher flow rate at the center channel. Later along the straight portion of the channel, the micro-particles start to move to the center portion of the channel under the influence of acoustic radiation force after entering the acoustically excited region. Magnitude of the acoustic force depends on the particle’s properties and size. In the simulations it is assumed that particles are made of polystyrene.
II.2. Numerical Solution
The finite element analysis in this study is performed by using COMSOL software and the analytical calculations are performed with MATLAB software. The coupling between the analytical and numerical solutions are performed using MATLAB. The compatibility between COMSOL and MATLAB software considerably eases the coupling process between the analytical and numerical solutions.
II.2.a. Electro-Mechanical-Structural Analysis
In this part of the numerical solution the dynamic behavior of the piezoelectric material is simulated using COMSOL software. The main input to the model is the voltage applied on the piezoelectric material. Piezoelectric component is bonded to the chip material. Acoustic response of the chip material is affected by the piezoelectric material response. Therefore, there is two way coupling between the piezoelectric material and the chip. This numerical coupling is performed by COMSOL. The piezoelectric material is bonded to the chip material. Therefore, acoustic-structural coupling is performed at the surface between the piezoelectric material and the chip.
Electro-Mechanical-Structural Analysis (FEM) (Sect. II.2.a)
Acoustic Analysis (FEM) (Sect. II.2.b)
Computational Fluid Dynamics Analysis (FEM) (Sect II.2.d)
Acoustic Analysis (Analytical) (Sect II.2.c)
Piezoelectric
Material Channel Chip Glass
Fluid Micro-Particles
Eqn
(1
) & Eqn(2)
Eqn (5) & Eqn (6)
MICRO-PARTICLE TRAJECTORY DETERMINED
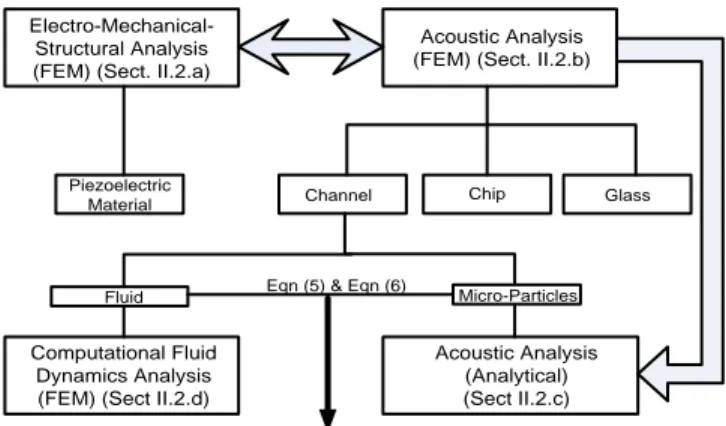
Figure 3. Numerical solution procedure for the simulation of ultrasonic standing wave particle separation
II.2.b. Acoustic Analysis (FEM)
Acoustic field induced by the piezoelectric material and the chip is numerically simulated using COMSOL software as well. The numerical modeling of the acoustic domains includes the chip layer, the glass material and the acoustic response inside the channel. Acoustic pressures and velocities are calculated in this step of the calculations. This part of the simulation neglects the presence of the particles; therefore, it is assumed that the micro-particles does not disturb the acoustic field. The acoustic response inside the channel is fed into MATLAB software in order to calculate the acoustic radiation forces on particles. II.2.c. Acoustic Analysis (Analytical)
This part of the analysis is performed in MATLAB. The acoustic pressure and velocity field is imported from COMSOL. The acoustic radiation force is calculated using equations (1) and (2). Micro-particle acoustic and size properties are also input to acoustic radiation force calculations. However, in order to calculate the trajectories of the particles one needs to calculate the drag force which will be explained in the next sub-section.
II.2.d. Computational Fluid Dynamics (CFD) Analysis In order to find the fluid velocity field inside the channel, fluid dynamics module of COMSOL is used. Inputs to the model are fluid flow rates at the inlets and outlets of the micro-channel. Inlets and outlets of the micro-channel fluid circuit is shown in Figure 2. The fluid flow field is exported to MATLAB as a grid where at each point of the grid the fluid flow velocities in three directions are stored. Now, Eqn. (5) can be used since the fluid flow field is calculated, and the acoustic radiation force was also calculated in MATLAB. Using Eqn. (6) in MATLAB, one can find the velocity of the particle at a point. This particle velocity is assumed to be constant for a small time step during which the particle moves to a new location. Then, the whole process of finding the fluid flow and acoustic radiation force at this new position is carried out. 750 particles are used for the simulation and each particle’s trajectory is calculated separately. Interactions between particles are also neglected.
II.3. Boundary Conditions and Meshing
In the simulations, different physical domains have different boundary conditions. The boundary conditions for the acoustic domains (chip, channel and glass) are the impedance boundary condition. This states that the physical boundaries which are in contact with air are assigned as the acoustic impedance of air. The mechanical boundary conditions are free boundary conditions for the piezoelectric material except the surface where chip material and the piezoelectric material are in contact. That surface is the acoustic-structural coupling surface. The electrical boundary conditions are electric potential boundary conditions. A voltage boundary condition is applied for the top surface of the piezoelectric material, and the ground boundary condition for the surface where it is in contact with the chip material. For the fluid flow analysis, boundary conditions are given at the inlet channels’ entry surfaces and the outlet channels’ exit surfaces. The boundary conditions are given as flow velocity boundary conditions which are calculated from the input flow rates and the surface areas. For the meshing, it was aimed to adjust the mesh density such that there are around 10 elements per wavelength. The order of the elements used in FEM is quadratic.
Figure 4. Mesh used in finite element analysis of the acoustic resonator
III. SIMULATION RESULTS
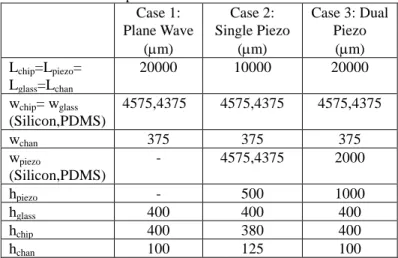
In this part of the study numerical simulations of a resonator in the ultrasonic separator system will be performed. The numerical simulations will be composed of three sub-sections. The acoustic properties of the materials as well as the geometric properties of the resonators used in each simulation case are given in Table 1 and Table 2.
Table 1. Acoustic Properties of the Materials used in the simulations Density (g/cm3) Speed of Sound (m/s) Silicon 2330 8400 PDMS 970 1000 Water 1000 1500 Glass 2230 5500 PZT-4 7700 ~4000 Polystyrene 1050 2350
Table 2. Geometric parameters used in numerical simulations Case 1: Plane Wave (m) Case 2: Single Piezo (m) Case 3: Dual Piezo (m) Lchip=Lpiezo= Lglass=Lchan 20000 10000 20000 wchip= wglass (Silicon,PDMS) 4575,4375 4575,4375 4575,4375 wchan 375 375 375 wpiezo (Silicon,PDMS) - 4575,4375 2000 hpiezo - 500 1000 hglass 400 400 400 hchip 400 380 400 hchan 100 125 100
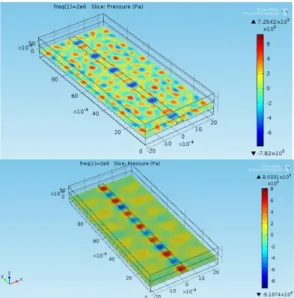
III.1. Resonator without a Piezoelectric Actuator The first configuration simulates a resonator without a piezoelectric actuator. A plane acoustic wave is provided from the top of the resonator, and the pressure waves inside the micro-channel is simulated for a PDMS and a silicon chip. The amplitude of the plane wave that is applied from the top of the chip is 0.2MPa. The acoustic pressure distribution along the whole chip cross section including the channel is shown in Figure 5.
Figure 5. Acoustic pressure distribution across the PDMS chip Top: For PDMS chip material, Bottom: For silicon chip material.
It can be observed from Figure 5 that the acoustic pressure distribution along the length is more uniform for the PDMS material whereas there are clear pressure maxima and minima in the channel of the silicon material. Figure 6 shows the acoustic pressure distributions across the channel width at 10 different locations along the length for the PDMS and silicon materials. It can be observed from this plot that the variations of pressure
along the length for the PDMS material is significantly less compared to silicon chip material.
(a) (b)
Figure 6. Pressure distribution across the channel along length of the chip (a) For PDMS chip material. (b) For silicon chip material
Figure 6 also shows that acoustic pressure has larger amplitude at the center of the channel for silicon compared to channel edges (walls) whereas the PDMS material has minima for acoustic pressures at the center of the channel. Such pressure distributions would cause the micro-particles to move towards the center of the channel for PDMS material; however, the micro-particles would be pushed towards the channel walls for the silicon chip material which is not the desired direction for particles to move.
III.2. Resonator with Piezoelectric Actuator
In this section, the simulation of the more realistic case which is induction of acoustic waves with piezoelectric material is performed. In this case study, the acoustic waves are not plane and they excite the channel from different directions due to piezoelectric material vibrating along several directions.
Figure 7. Acoustic pressure distribution across the PDMS chip Top: For PDMS chip material, Bottom: For silicon chip material.
The acoustic response along a slice of the chip material and the channel is shown in Figure 7. It is shown in the figure that acoustic response of the PDMS chip got a lot more complicated in appearance, and there are clear resonance and anti-resonances along the micro-channel. The acoustic response of the silicon chip as shown in the bottom plot of Figure 7 also has resonance and anti-resonances, and the amplitudes of acoustic pressure inside the micro-channel are about an order of magnitude larger than the PDMS material acoustic pressures. The acoustic pressure across the channel along the channel length for the PDMS and silicon materials are shown in Figure 8. Figure 8 shows with the addition of the piezoelectric material the acoustic pressure landscape completely changes especially for PDMS. Figure 8a shows that PDMS acoustic response greatly changes in amplitude along the length of the micro-channel. At some locations, the amplitude of acoustic pressure has a minimum at the center of the channel and at some location has a maximum. This indicates that the particles are moved towards the center and the channel walls depending on the location of the micro-particle. Figure 8b shows that for silicon, the acoustic pressure amplitude is significantly higher compared to the acoustic pressure inside the PDMS channel. Moreover, since the maximum of acoustic pressure amplitude is always located in the center, the particles would be pushed towards the channel walls at all locations along the length of the micro-channel.
(a) (b)
Figure 8. Pressure distribution across the channel along length of the chip. (a) For PDMS chip material. (b) For silicon chip material.
III.3. Resonator with Dual Piezoelectric Actuators It was shown in the previous sub-section that acoustic radiation forcing was changing directions for the PDMS material and was in a direction that would push the particles to the channel walls for a silicon material at 2MHz frequency. Therefore when a single piezoelectric material is used depending on the frequency, the acoustic radiation force may not be guaranteed to result in successful separation of particles. In order to get more consistent directions for the acoustic radiation forcing, a two piezoelectric configuration with opposing polarities will be investigated. The configuration is shown in Figure 9.
In this configuration, the two piezoelectric materials are driven with equal but opposite (in polarity) voltages. This would create
an asymmetry which is expected to result in asymmetric pressure distribution. This would create in zero acoustic pressure at the center of the microchannel which would result in an acoustic radiation force that would move micro-particles to the center of the channel as intended.
Figure 9. The model for the dual piezoelectric configuration The acoustic pressure distributions across the chip is simulated and the results are shown in Figure 10 for the PDMS and silicon. Due to opposite phase pressure waves induced by the piezoelectric materials, there is asymmetry in the acoustic field with respect to the centerline of the resonator. Consistent with previous case study the acoustic pressure field is more complicated for the PDMS material due to short acoustic wavelength compared to the silicon material.
Figure 10. Acoustic pressure distribution across the PDMS chip Top: For PDMS chip material, Bottom: For silicon chip material.
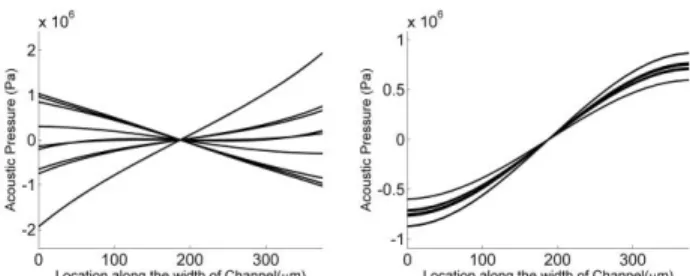
Figure 11 shows that as expected the acoustic pressure at the center of the micro-channel is zero, and the pressure distribution along the length of the microchannel is tighter for the silicon material when compared to PDMS material. Figures 10 and 11 are simulated at frequencies around 2MHz where peak amplitudes for the acoustic pressures are observed. These
frequencies correspond to 1.9 MHz for the PDMS and 2.4MHz for the silicon material.
(a) (b)
Figure 11. Pressure distribution across the channel along length of the chip (a) For PDMS chip material. (b) For silicon chip material
III.4. Particle Separation Results with Dual Piezoelectric Material Configuration
As described previously, using the FEM results of the flow in the channel, the trajectories of the micro-particles are simulated. The flow rates used during the simulation are the same as the experimental flow rates reported in [1]. The flow rates for Inlet 1 and Inlet 2 are 0.02 ml/min each. The flow rate of Inlet 3 is 0.386 ml/min and 0.13 ml/min is the flow rate for each of the Outlets 1, 2 and 3. Micro-particles are of three size groups of 3m, 7m and 10m. In order make the simulation realistic, each size group is given a standard deviation in diameters. There exists a standard deviation of 5% of the nominal diameter for 3m. Similarly, the standard deviations are 10% of 7m and 15% of 10m for the other two size groups. There is also a uniform distribution for the starting locations of the particles at Inlets 1 and 2.
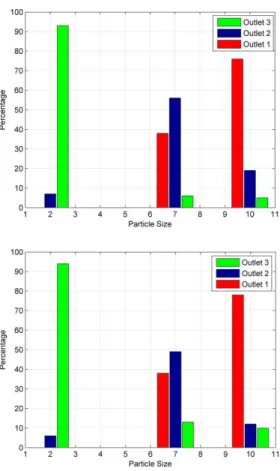
Figure 12 shows the results of the simulations. It shows a bar plot of percentage of each size group exiting from a certain outlet channel. This simulation is performed for both the PDMS chip material as well as the silicon chip material. The intended exit outlet for 3m particles is Outlet 3, intended outlet for 7m particles is Outlet 2, and intended outlet for 10m particles is Outlet 1. From Figure 12, it can be seen that in both the PDMS chip and the silicon chip ~90% of the 3m particles exited from the intended outlet of Outlet 3. Roughly half of the 7m particles exited from the intended outlet of Outlet 2 whereas ~80% of the 10m particles exited form the intended outlet of Outlet 1. Without acoustic radiation force, all of the particles would exit from Outlet 3. This can be deduced from destinations of the 3m particles which are affected lightly from the acoustic field.
These results are similar to the experimental results reported in Petersson et.al. [1]. The study reports that ~80% of the 3m particles, ~65% of the 7m particles and ~95% of the 10m particles exited from the correct outlet. So most of the results are accurate within 10%-15%.
Figure 12. Exit channels for the outlet of each micro-particle size group in percentages. a. For PDMS material, b. For silicon material.
IV. CONCLUSIONS
In this study acoustic particle separation process is simulated using a Monte-Carlo based finite element-analytic combined approach. The simulations showed that the pressure waves created in the micro-channel are different for plane waves and waves induced by piezoelectric material. There is significant amount of resonance like behavior of the pressure waves when the channel is excited with piezoelectric material. Therefore, the results show that it is important to consider the dynamics of the piezoelectric material for numerical simulations of acoustic particle separation. Moreover, it was shown in the case of plane waves, the particles were not moving toward the center of the channel for silicon material. At the frequency of simulation for the single piezoelectric material case, it was observed that there was not a consistent movement of micro-particles to the center of the channel for PDMS which is the intended direction for the separation process. At the chosen excitation frequency, the particles were moving towards the channel walls for the single piezoelectric case with a silicon chip. Hence, it may be required to try several frequencies to find the field distribution which would lead the particles to the center of the channel.
As a remedy to this problem, a two piezoelectric material configuration is investigated and shown to give zero acoustic pressure at the center of the beam which would cause acoustic radiation force to direct all the micro-particles to the center of the channel. This configuration was also used to simulate the particle separation with 3m, 7m and 10m diameter micro-particles. It was shown that the separation results were similar for silicon and PDMS material. However, the PDMS material required higher voltage values to be applied to get results similar to silicon chip separation. The results of the simulation process is also found to be in-line with the reported experimental result from literature [1]. The implementation of the proposed computational model for the design of a microfluidic separation device will be our future direction. ACKNOWLEDGMENTS
Financial support from the Turkish Scientific and Technical Research Council, Grant No. 112M102, is greatly appreciated. REFERENCES
1. F. Petersson, L. A. Berg, A. Sward-Nilsson, T. Laurell, Free Flow Acoustophoresis: Microuidic-Based Mode of Particle and Cell Separation, Anal. Chem. 79 (2007) 5117-5123 2. J. Shi, H. Huang,, Z. Stratton, Y. Huang, T. J. Huang,
Continuous particle separation in a microfluidic channel via standing surface acoustic waves (SSAW), Lab Chip 9 (2009) 3354–3359.
3. J. D. Adams, H. T. Soh, Tunable acoustophoretic band-pass particle sorter, Appl. Phys. Lett., 97, (2010) DOI: 064103. 4. A. Haake, A. Neild, D. Kim, J. Ihm, Y. Sun, J. Dual, B. Ju,
Manipulation of cells using an ultrasonic pressure field, Ultrasound in Med. & Biol., 31 (2005) 857–864.
5. S. Limaye and W.T. Coakley, Clarification of small volume microbial suspensions in an ultrasonic standing wave, J. Appl. Microbiol.,84 (1998) 1035–1042.
6. J. Shi, H. Huang,, Z. Stratton, Y. Huang, T. J. Huang, Continuous particle separation in a microfluidic channel via standing surface acoustic waves (SSAW), Lab Chip 9 (2009) 3354–3359.
7. M. Kumar, D. L. Feke, J. M. Belovich, Fractionation of Cell Mixtures Using Acoustic and Laminar Flow Fields, Biotechnology And Bioengineering, 89 (2005) DOI: 10.1002/bit.20294
8. A. Haake, A. Neild, D. Kim, J. Ihm, Y. Sun, J. Dual, B. Ju, Manipulation of cells using an ultrasonic pressure field, Ultrasound in Med. & Biol., 31 (2005) 857–864.
9. J.J. Hawkes, D. Barrow, W. T. Coakley, micro-particle manipulation in millimetre scale ultrasonic standing wave chambers, Ultrasonics, 36, (1998), 925931.
10. P. Glynne-Jones, R. J. Boltryk, N.R. Harris, A.W.J. Cranny,
M. Hill., Mode-switching: A new technique for
electronically varying the agglomeration position in an acoustic particle manipulator, Ultrasonics, 50, (2010), 58-75. 11. J. Shi, H. Huang ,Z. Stratton, Y. Huangband and T.J. Huang, Continuous particle separation in a microfluidic channel via
standing surface acoustic waves (SSAW), Lab on a Chip, 9, (2009), 3354-3359.
12. A.Neild, S. Oberti, A. Haake, J. Dual, Finite element modeling of a micro-particle manipulator, Ultrasonics 44 (2006) 455460.
13. P. Glynne-Jones, P. P. Mishra, R. J. Boltryk, M. Hill, Effcient finite element modeling of radiation forces on elastic particles of arbitrary size and geometry, J. Acoust. Soc. Am. 133 (2013) 1885-1893.
14. A. Neild, S. Oberti, J. Dual, Design, modeling and characterization of microfluidic devices for ultrasonic manipulation, Sensor Actuator B, 121 (2007) 452–461 15. M. Hill, Y. Shena, J.J. Hawkes, Modelling of layered
resonators for ultrasonic separation, Ultrasonics, 40 (2002), 385–3