REGULATION OF MINERALOCORTICOID RECEPTOR AND ITS DOWNSTREAM TARGETS BY ESTROGEN AND ALDOSTERONE
IN BREAST CANCER
A THESIS SUBMITTED TO
THE GRADUATE SCHOOL OF ENGINEERING AND SCIENCE OF BILKENT UNIVERSITY
IN PARTIAL FULFILLMENT OF THE REQUIREMENTS FOR THE DEGREE OF
MASTER OF SCIENCE IN
MOLECULAR BIOLOGY AND GENETICS
By Bircan ÇOBAN November 2016
ii
REGULATION OF MINERALOCORTICOID RECEPTOR AND ITS DOWNSTREAM TARGETS BY ESTROGEN AND ALDOSTERONE IN BREAST CANCER
By Bircan ÇOBAN November, 2016
We certify that we have read this dissertation and that in our opinion it is fully adequate in scope and in quality, as a thesis for the degree of Master of Science.
_________________________ Özlen KONU
(Advisor)
_________________________ Murat Alper CEVHER
_________________________ Sreeparna BANERJEE
Approved for the Graduate School of Engineering and Science
_________________________ Ezhan KARAŞAN
iii
Abstract
REGULATION OF MINERALOCORTICOID RECEPTOR
AND ITS DOWNSTREAM TARGETS BY ESTROGEN
AND ALDOSTERONE IN BREAST CANCER
Bircan ÇOBAN
M.S. in Molecular Biology and Genetics Supervisor: Özlen KONU
November, 2016
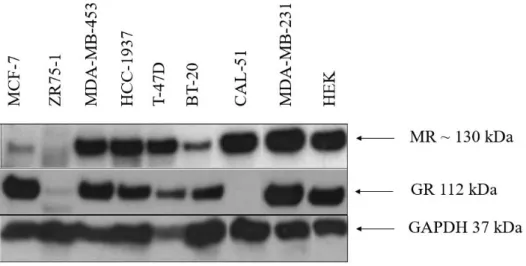
Many women suffer from breast cancer worldwide thus accurate diagnosis of this disease has become an important issue for treatment options and improved clinical outcomes. Members of steroid hormone receptors, are a subfamily of nuclear receptors can serve as biomarkers in molecular classification of breast cancer. One of these, Mineralocorticoid Receptor (MR) takes part in many physiological processes in epithelial tissues including mammary epithelia, yet it is not well studied in the context of breast cancer. In this thesis, we investigated expression patterns of MR together with Glucocorticoid Receptor (GR) across multiple breast cancer cell lines at the protein level. Our study revealed that expressions of MR and GR were modulated in breast cancer as a subtype specific manner. We then enquired regulation of MR and its downstream targets, SGK1, NEDD4-2 and subunits of ENaC i.e., α, β and γ, by estrogen (E2) and aldosterone (ALDO) treatment in breast cancer via qPCR and Western Blotting. We found differential responses in expression of MR and its downstream targets to E2 and ALDO suggesting ER status was an important mediator of MR action. We also overexpressed MR in MCF7 cells and then showed that MR, NEDD4-2, β and γENaC mRNA levels increased in response to ALDO only when MR was overexpressed.
iv
Keywords: Diagnosis, GR, MR signaling, downstream targets, SGK1, NEDD4-2, ENaC subunits, Estrogen, Aldosterone, breast cancer.
v
Özet
MEME KANSERİNDE MİNERALOKORTİKOİD
RESEPTÖR VE MİNERALOKORTİKOİD RESEPTÖRÜN
ALT AKIŞINDA YER ALAN HEDEFLERİNİN ÖSTROJEN
VE ALDOSTERON TARAFINDAN DÜZENLENMESİ
Bircan ÇOBAN
Moleküler Biyoloji ve Genetik Bölümü Yüksek Lisans Tez Danışmanı: Özlen KONU
Kasım, 2016
Dünyada pek çok kadın meme kanserinden mustarip olduğundan meme kanserinin kesin tanısı, hastalığın tedavi seçenekleri ve klinik sonuçları açısından önemli hale gelmektedir. Nükleer reseptörler ailesinin bir alttipi olan steroid hormon reseptörlerinin üyeleri, meme kanserinin moleküler sınıflandırmasında biyomarkör olarak kullanılmaktadırlar. Nükleer reseptör ailesinin bir üyesi olan mineralokortikoid reseptör (MR) meme epitelyal dokusunun da dahil olduğu epitelyal dokularda, pek çok fizyolojik süreçte görev almaktadır, henüz meme kanseri bağlamında yeterli olarak çalışılmamıştır. Bu tezde, MR ve GR’ın ekspresyon modelini protein seviyesinde farklı meme kanseri hücre hatlarında araştırdık. Çalışmamız MR ve GR’ın ekspresyonlarının meme kanserinin alt tiplerine özgü bir şekilde düzenlendiğini ortaya çıkarmıştır. Daha sonra, MR’ın ve MR’ın alt akışındaki hedefleri olan SGK-1, NEDD4-2 ve ENaC’ın α, β ve γ alt ünitelerinin estrojen (E2) ve aldosteron (ALDO) tarafından regülasyonlarını meme kanserinde, qPCR ve Western Blot aracılığıyla inceledik. MR ve alt akışındaki hedeflerin E2 ve ALDO’ya yanıtlarında, ER ekspresyon durumunun MR’ın aktivitesinde önemli bir aracı olduğunu belirten farklı cevaplar sergilediklerini bulduk. Ayrıca, MCF-7 hücrelerinde MR’ın ekspresyon seviyesini arttırdık ve sonra sadece MR’ın
vi
ekspresyon seviyesi arttırıldığı zaman, MR, NEDD4-2, βENaC ve γENaC mRNA seviyelerinin ALDO maruziyetine yanıt olarak arttıklarını gösterdik.
Anahtar kelimeler: Diagnoz, GR, MR sinyal yolağı, alt akış hedefleri, SGK1, NEDD4-2, ENaC subunits, Östrojen, Aldosteron, meme kanseri.
vii
viii
Acknowledgement
First of all, I would like to thank my supervisor Dr. Özlen Konu, who has given me the chance to be a part of this project. I would like to thank COST ADMIRE (BM1301) action for supporting my Short Term Scientific Mission (STSM) through a collaboration between the Konu and Staub labs. I have special thanks to Dr. Olivier Staub and his lab members for all their support and hospitability. I thank the members of the jury, Dr. Sreeparna Banerjee and Dr. Murat Cevher, who were kind to spend their valuable time reviewing my thesis.
I would like to thank all members of Konu Lab, but especially Seniye Targen for her support and friendship. I am happy that I met her and have worked with her in the same project. I also would like to thank Erçağ Pinçe for his support and relieving coffee break conversations.
I owe special thanks to my dearest friends Ece Kartal, Ulduz Sobhiafshar, İlknur Çoban and Yağmur Ersoy, whose efforts made me forgot the distance between them and me; and to Aslı Taşpolatoğlu and Dilara Özkan, who have tried to be with me as much as possible.
I’m grateful to Erdem Akın Temel for all his support. My life in Bilkent would unbearable without him, since he tried to solve each problem of mine with kindness and love.
Finally, and most importantly, I’m deeply grateful to my father, who have thought me the value of endeavor and being respectful to my work, and to my mother who have always supported me, unconditionally.
This project was supported by a research grant (to OK) funded by The Scientific and Technological Research Council of Turkey (TUBITAK) (114S226) and COST
ix
Action ADMIRE (BM1301). I was supported by Bilkent University Molecular Biology and Genetics department, and TUBITAK for my graduate studies.
x
Table of Contents
Abstract ... iii
Özet ... v
Acknowledgement ... viii
List of Figures ... xiii
List of Tables ... xvii
Abbreviations ... xix
Chapter 1 ... 1
Introduction ... 1
1.1. Breast cancer ... 1
1.2. Steroid Hormone Receptors and cancer ... 2
1.2.1. Mineralocorticoid Receptor (MR) signalling ... 4
1.2.2. MR signalling in cancer ... 7
1.2.3. Glucocorticoid Receptor (GR) signalling ... 8
1.2.4. GR signalling in breast cancer ... 9
1.3. Downstream targets of MR in epithelial tissues ... 9
1.3.1. Serum Glucocorticoid Kinase-1 (SGK1) ... 10
1.3.2. Neural precursor cell expressed developmentally downregulated gene 4-like (NEDD4-2) ... 11
1.3.3. Epithelial Sodium Channel (ENaC) ... 12
1.4. Regulation of downstream targets of MR ... 14
1.4.1. Mechanism of ENaC Regulation by SGK1 and NEDD4-2 ... 14
1.4.2. E2 and ALDO treatments: Effects on MR targets ... 15
1.4.3. MR overexpression ... 16
1.5. Aim of the Study ... 17
Chapter 2 ... 19
Materials and Methods ... 19
2.1. Materials ... 19
xi
2.1.2. Chemicals ... 21
2.1.3. Cell culture media and reagents: ... 23
2.1.4. Primers ... 24
2.1.5. Antibodies ... 24
2.1.6. DNA constructs ... 25
2.1.7. Buffers ... 26
2.2. Methods ... 28
2.2.1. Cell Culture studies ... 28
2.2.2. Gene expression analyses ... 36
2.2.3. Statistical analyses: ... 44
2.2.4. GEO2R analyses: ... 45
2.2.5. Heat map analyses:... 46
2.2.6. Illustrative figures for discussion: ... 46
Chapter 3 ... 47
Results ... 47
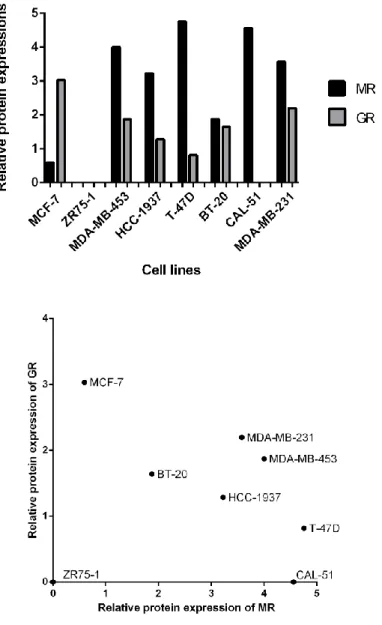
3.1. Expressions of MR and GR across multiple subtypes of breast cancer cells ... 47
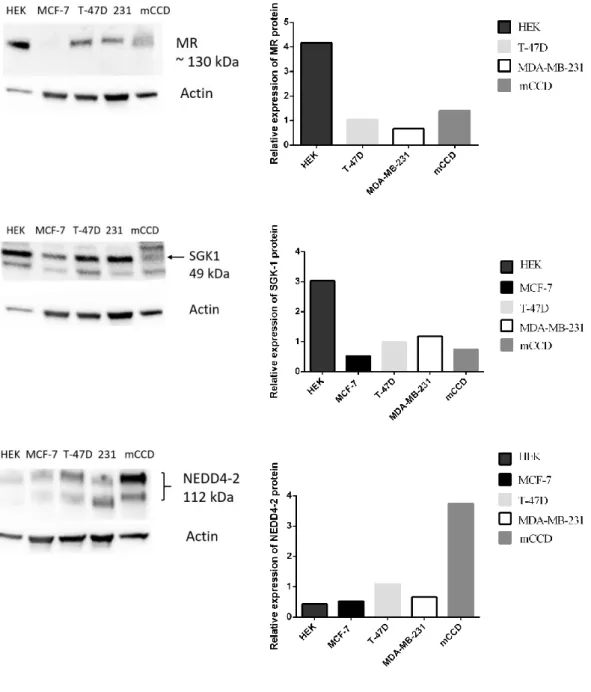
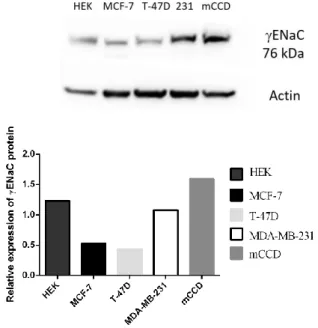
3.2. Protein expression profiles of MR and its downstream targets in ER (+) and ER (-) breast cancer cell lines... 49
3.3. Effects of E2 on expression levels of MR downstream targets in breast cancer cells: In silico findings ... 53
3.3.1. E2-regulatory role on expressions of MR downstream target genes in ER (+) breast cancer cells ... 54
3.3.2. E2-regulatory role on the expression of MR downstream target genes in an ER (-) breast cancer cell line, MDA-MB-231 ... 57
3.4. Effects of E2 treatments on MR and its downstream targets in breast cancer: Validation by qPCR and Western Blot ... 59
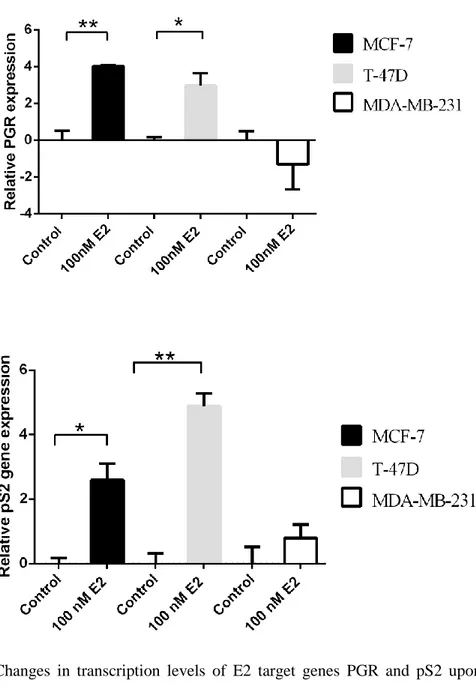
3.4.1. Determining the E2 response in breast cancer cell lines ... 59
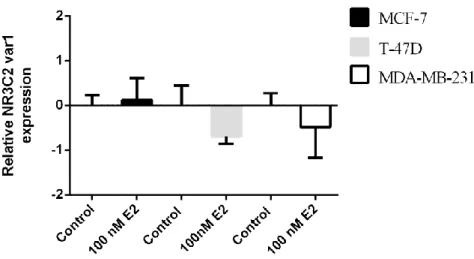
3.4.2. Alterations in MR/NR3C2 mRNA expression levels in response to E2 ... 61
3.4.3. Alterations in SGK1 mRNA expression levels in response to E2 ... 62
3.4.4. Alterations in NEDD4-2 mRNA and protein expression levels in response to E2 ... 63
3.4.5. Alterations in ENaC subunits expression levels in response to E2 ... 65
3.5. Effects of ALDO on MR and its downstream targets in breast cancer .... 70
3.5.1. Determining the effect of ALDO in breast cancer cell lines ... 71
3.5.2. Detection of changes in MR expression levels ... 72
3.5.3. Detection of changes in NEDD4-2 expression levels in response to ALDO ... 73
xii
3.6. Heat map analyses of E2 and ALDO response in ER (+) and ER (-) breast
cancer cell lines ... 79
3.7. Summary tables for observed changes in response to either E2 or ALDO treatments ... 81
3.8. Overexpression of Mineralocorticoid Receptor/MR ... 85
3.8.1. Optimization studies of MR overexpression in breast cancer cell lines... 85
3.8.2. q-PCR Analyses of MR overexpression in MCF-7 cells ... 88
3.8.3. Western Blot analysis of MR overexpression in MCF-7 cell line ... 90
3.8.4. Effects of MR overexpression and activation on MR and its downstream targets ... 91 Chapter 4 ... 96 Discussion ... 96 Chapter 5 ... 105 Future Perspectives ... 105 References ... 107 Appendix ... 121
Appendix A: In silico results: E2 response of downstream targets of MR in ER (+) and ER (-) breast cancer cells ... 121
xiii
List of Figures
Figure 1.1: Genomic structure of human mineralocorticoid receptor……….5 Figure 1.2: Genomic actions of mineralocorticoid receptor………6 Figure 1.3: Regulation of ENaC in cardiovascular diseases and kidney….………..15 Figure 3.1: Expression patterns of MR and GR in breast cancer cell line protein panel………....47 Figure 3.2: Graphical representations of MR and GR expressions in different subtypes of breast cancer.………...49 Figure 3.3: MR, SGK1 and NEDD4-2 expressions across ER (+) and ER (-) breast cancer cell lines………..……….………51 Figure 3.4: ENaC subunits expressions among ER (+) and ER (-) breast cancer cell lines……….………52 Figure 3.5: Changes in transcription levels of E2 target genes PGR and pS2 upon E2 stimulation……….…….….61 Figure 3.6: Response of NR3C2/MR var1 gene expression to E2 treatment in ER (+) and ER (-) breast cancer cell lines………..……62 Figure 3.7: Alterations in expression levels of SGK-1 mRNA across ER (+) and ER (-) breast cancer cell lines………..….63 Figure 3.8: Alterations in expression levels of NEDD4-2 mRNA across ER (+) and ER (-) breast cancer cell lines in response to E2……….………...64 Figure 3.9: E2 effect on NEDD4-2 protein levels detected by Western blot in ER (+) and ER (-) breast cancer cell lines…...65 Figure 3.10: aENaC response to E2 at mRNA level in ER (+) and ER (-) breast cancer cell lines………..……….66 Figure 3.11: βENaC response to E2 at mRNA level in ER (+) breast cancer cell lines………...…..67
xiv
Figure 3.12: βENaC response to E2 at protein level in ER (+) and ER (-) breast cancer cell lines………...68 Figure 3.13: γENaC response to E2 at mRNA level in ER (+) and ER (-) breast cancer cell lines………..………..………...69 Figure 3.14: γENaC response to E2 at protein level in ER (+) and ER (-) breast cancer cell lines...………....70 Figure 3.15: Changes in transcription levels of ALDO target genes αENaC and SGK-1 upon ALDO stimulation…....……….72 Figure 3.16: Changes in the expressions of MR mRNA in MCF-7 and MDA-MB-231 cells………..…73 Figure 3.17: Changes in the expressions of NEDD4-2 mRNA in MCF-7 and MDA-MB-231 cells………...74 Figure 3.18: ALDO effect on NEDD4-2 protein levels detected by Western blot in ER (+) and ER (-) breast cancer cell lines..………...75 Figure 3.19: Changes in the expressions of βENaC mRNA in MCF-7 and MDA-MB-231 cells………..………..………...76 Figure 3.20: ALDO effect on βENaC protein levels detected by Western blot in ER (+) and ER (-) breast cancer cell lines…..………..77 Figure 3.21: Changes in the expressions of γENaC mRNA in MCF-7 and MDA-MB-231 cells………...78 Figure 3.22: ALDO effect on γENaC protein levels detected by Western blot in ER (+) and ER (-) breast cancer cell lines..………..79 Figure 3.23: Heat map analysis of MR and its downstream targets genes in response to E2 or ALDO at mRNA level………...………...80 Figure 3.24: Heat map analysis of MR and its downstream targets genes in response to E2 or ALDO at protein level………...81 Figure 3.25: Image representing GFP transfected MCF-7 cells………86 Figure 3.26: Images showing control (upper) and pEGFP transfected (below) breast cancer cell lines………...………87
xv
Figure 3.27: Western blot image and Ponceau Red staining of MR overexpression in MCF-7, T-47D and HEK cell lines………...……..88 Figure 3.28: Overexpression of MR at mRNA level by using HiPerFect or Lipofectamine® transfection reagents………..………..89 Figure 3.29: Western Blot analysis of MR overexpression………...91 Figure 3.30: Effects of overexpression and activation of MR on MR, SGK-1 and NEDD42 mRNA expression levels………...……….93 Figure 3.39: Effects of overexpression and activation of MR on subunits of ENaC mRNA expression levels……….………95 Figure 4.1: Alterations in expression levels of MR and its downstream targets in response to E2 across ER (+) (MCF-7, T-47D) and ER (-) (MDA-MB-231) breast cancer cells. ………...………..….103 Figure 4.2: Alterations in expression levels of MR and its downstream targets in response to ALDO across ER (+) (MCF-7, T-47D) and ER (-) (MDA-MB-231) breast cancer cells.………...……….104 Appendix Figure 1: E2 effect on expression levels of SGK1 and NEDD4-2 mRNA in MCF-7 cells………….……….121 Appendix Figure 2: Changes in expression levels of SGK1 and NEDD4-2 mRNA in response to E2 starvation in MCF-7 cells……….122 Appendix Figure 3: Changes in expression levels of SGK1 and NEDD4-2 in response to E2 in MCF-7, T-47D and BT-474 cells...………..123 Appendix Figure 4: E2 effect on expression levels of ENaC subunits (namely α, β and γ) mRNA in MCF-7 cells……..………...125 Appendix Figure 5: Changes in expression levels of ENaC subunits (α, β and γ) mRNA in response to E2 starvation in MCF-7 cells..………..127 Appendix Figure 6: Changes in expression levels of ENaC subunits (α, β and γ) mRNA in response to E2 in MCF-7, T-47D and BT-474 cells………128 Appendix Figure 7: Changes in expressions of SGK1 and NEDD4-2 in MDA-MB-231 cells treated with 10 nM E2 for 48 hrs………..………...129
xvi
Appendix Figure 8: Changes in expression levels of ENaC subunits (α, β and γ) mRNA in response to E2 in MDA-MB-231 cells………...…………..…131
xvii
List of Tables
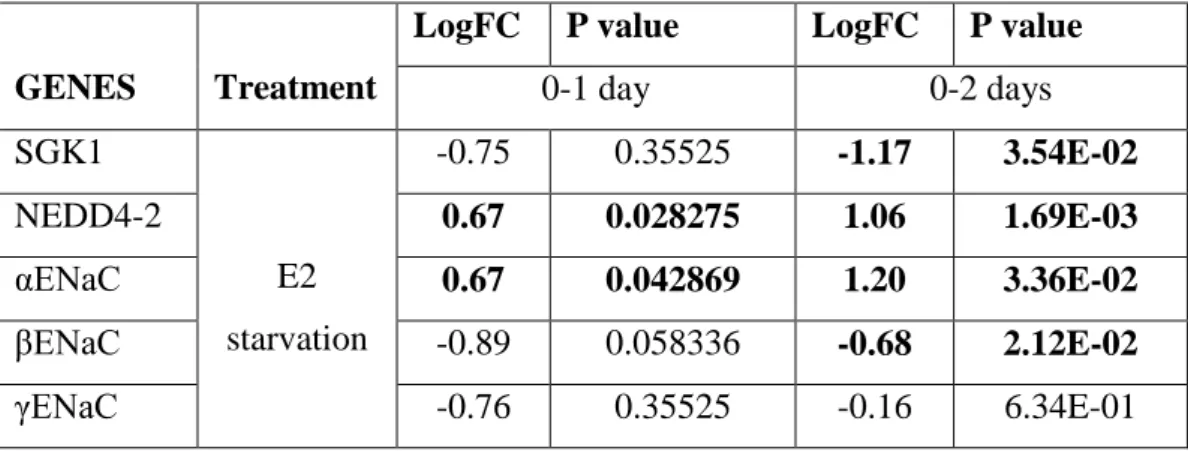
Table 1.1: Steroid hormone receptors, specific nomenclatures and ligands…………3 Table 1.2. Downstream targets of MR in epithelial tissues……….……...10 Table 2.1: General laboratory reagents, materials, and kits………...19 Table 2.2: Chemicals used in protein, RNA, plasmid and cell culture studies……..21 Table 2.3: Cell culture media, reagents and chemicals used in the study………...23 Table 2.4: Primer list………..…24 Table 2.5. List of antibodies used in this study………..25 Table 2.6: Buffers commonly used in Western blot, protein, and plasmid studies...26 Table 2.7: Gene expression profiles and molecular subtypes of breast cancer cell lines…...28 Table 2.8: Genes analyzed by GEO2R and corresponding Affymetrix prob set names………..45 Table 3.1: Log fold changes observed in expressions of MR downstream targets at mRNA levels in response to MCF-7 cells treated to 0, 3, 6, 12 hrs E2 were shown with their P values………...56 Table 3.2: Log fold changes observed in expressions of MR downstream targets at mRNA levels in response to E2 starvation for 1 day and 2 days in MCF-7 cells were indicated with their P values………...57 Table 3.3: Log fold changes observed in expressions of MR downstream targets at mRNA levels in response to 10 nM E2 treatment for 48hrs in MCF-7 and T-47D cells were indicated with their P values……….……...57 Table 3.4: Log fold changes observed in expressions of MR downstream targets at mRNA levels in response to 10 nM E2 treatment for 48hrs in MDA-MB-231 cells were indicated with their P values………..58
xviii
Table 3.5: Log fold changes in mRNA expression levels of MR and its downstream targets in response to either 100 nM E2 or 100 nM ALDO with their significance values………...83 Table 3.6: Log fold changes (relative to Actin) in protein expression levels of MR and its downstream targets in response to either 10, 100 nM E2 or 10, 100 nM ALDO……….84
xix
Abbreviations
11β-HSD1 / 2 11β-Hydroxysteroid dehydrogenase 1/2ALDO: Aldosterone
AR: Androgen receptor
BRCA-1 / 2 Breast cancer 1/2
BSA Bovine serum albumin
Dex Dexamethasone
DBD DNA binding domain
DMSO Dimethyl sulfoxide
EGTA Ethylene glycol-bis(β-aminoethyl ether)-N,N,N',N'-tetraacetic acid
ENaC Epithelial sodium channel ER/ESR1 Estrogen receptor
ERC EnaC regulatory complex
ERE Estrogen response element
Her2 Human epidermal growth factor receptor 2
FBS Fetal bovine serum
GAPDH Glyceraldehyde 3-phosphate dehydrogenase
GEO Gene Omnibus database
GFP Green fluorescent protein
GPL / GSE Platform or Series accession number
GR Glucocortioid Receptor
GRE Glucocorticoid response element HCC Hepatocellular carcinoma
HEPES 4-(2-hydroxyethyl)-1-piperazineethanesulfonic acid
hrs Hours
hGR Human glucocorticoid receptor hMR Human mineralocorticoid receptor HRE Hormone response element
Hsp90 Heat shock protein
xx
LB Luria broth
LBD: DNA binding domain
LogFC Log fold change
MR Mineralocorticoid receptor mTORC Mammalian target of rapamycin NEDD4-2 or
NEDD4L
Neural Precursor Cell Expressed, Developmentally Down-Regulated 4-Like
PBS Phosphate buffered saline
PDK1: Phosphoinositide-dependent protein kinase-1 PGR / PR Progesterone receptor
PI3K Phosphatidyl-inositol 3-kinase PKB Protein kinase beta
PVDF Polyvinylidene difluoride
RT Room temperature
SDS Sodium dodecyl sulfate
SGK1 Serum and glucocorticoid kinase-1 SHR Steroid hormone receptor
SOB Super optimal broth
TBS Tris buffered saline
TEMED Tetramethylethylenediamine TFF1/pS2 Trefoil factor 1
1
Chapter 1
Introduction
1.1. Breast cancer
Breast cancer is a common cause of death for women. Although many prevention strategies and treatment options were developed over time, approximately 1 out of 10 women still face breast cancer throughout their lives1. The most important obstacle in front of forming successful therapies for breast cancer is its complexity that arises from genetic heterogeneity2 among breast tumors. Therefore, researchers focus on understanding the molecular basis of this heterogeneity by categorizing breast cancer into types, based on histological, pathological and molecular features of breast tumours3.
Broadly, breast cancer can be categorized under two histological types, which are in
situ carcinoma and invasive (infiltrating) carcinoma3. In situ carcinomas are divided into two sub-types by being either ductal or lobular. Invasive carcinoma has six main sub-types: Tubular, ductal lobular, invasive lobular, infiltrating ductal, mucinous (colloid), medullary and infiltrating ductal3. Breast cancer arises from hyper-proliferative ductal cells and differentiates into ductal carcinoma in situ and may become metastatic at final stages1-2. Many breast cancer cases are invasive ductal carcinomas1.
Pathological classification of breast cancer relies on histological features of breast tumours4. Grade of tumor is defined by differentiation and proliferation potential of
2
breast tumours4-5 and grading scores (from 1 to 3) are finalized by adding each feature as points into the grading scores6.
Molecular subtypes of breast cancer are defined by molecular expression profiles of three hormone receptors: Estrogen receptor (ER), Progesterone receptor (PR) and human epidermal growth factor receptor 2 (Her2). A sub-type classification based on these hormonal status forms the five molecular subtypes of breast cancer: Luminal (A and B), Basal, Her2 overexpressing, Claudin-low, Normal like- breast cancers7.
Many genes are also dysregulated in breast cancer and classifications can be generated by using mutations that occur in tumors. Mutations in BRCA1 and BRCA2 genes disrupt the cell cycle progression involved in DNA damage thereby leading to genomic instability. P53 as a tumor suppressor gene in breast cancer also takes a crucial part in regulation of cell cycle, growth and apoptosis1.
1.2. Steroid Hormone Receptors and cancer
As a member of nuclear receptors, Steroid Hormone Receptors (SHRs) are synthesized from cholesterol and transported to the blood circulation via proteins such as albumin and transcortin.8
Steroid receptor family is composed of five members: Androgen, Estrogen, Glucocorticoid, Progesterone and Mineralocorticoid receptors. Receptors with corresponding ligands are listed in Table 1.2.
3
All members of the steroid receptor family resemble each other in terms of structure. They possess an N-terminal domain also called as ligand binding domain (LBD) for ligand-dependent transcriptional activity, and a DNA binding domain (DBD) recognizing the hormone response element (HRE) of target genes in a sequence specific manner. There is a link between DBD and LBD provided by hinge region responsible for forming sites for posttranslational modifications of the receptors and interfaces for dimerization9-10-11.
SHRs function in many physiological processes such as metabolism, inflammation and lipid signaling12-13-14. Functions of SHRs rely on their action as transcription factors in response to certain types of ligands (e,g, glucocorticoids, estrogen15/17-ß Estradiol (E2).) or signal molecules (e.g., retinoid, vitamin D3, thyroid hormone15) within cells. Therefore, SHRs are called as ligand-dependent transcription factors in the literature.
Genomic actions of SHRs are triggered by binding of steroid hormone/ligand to their cognate receptors either in the cytosol or membrane. SHRs undergo conformational changes upon ligand binding thus they are released from chaperons which are bound to receptors in their inactive state. SHRs translocate into nucleus and then make homodimers. They act as transcription factors by binding to sequence specific recognition elements/hormone response element (HRE)/enhancer sequences within regulatory region of target genes and recruit general transcription factors and
Table 1.1: Steroid hormone receptors, specific nomenclatures and ligands. Steroid receptors Abbreviation Nomenclature Ligand
Androgen receptor AR NR3C4 Testosterone
Estrogen receptor ERα
ERβ
NR3A1 NR3A2
Oestradiol-17β
Glucocorticoid receptor GR NR3C1 Cortisol
Mineralocorticoid receptor MR NR3C2 Aldosterone (ALDO),
cortisol
4
coregulatory proteins to target DNA resulting in either transcriptional activation or repression of target genes15-16-17.
Considering the physiological roles of SHRs, disruption of SHR signal transduction may contribute to growth and development of various types of cancers. Alterations in steroid hormone receptor signaling affect breast cancer since it is hormone dependent. Certain members of SHR family have pivotal roles in progression, development and maintenance of tumor growth in breast cancer18. For example, it has been previously shown that E2 signaling acts a mitogen thereby activating several cyclin genes resulting in cell cycle progression of breast cancer cells19. It also takes part in activation of major signaling pathways related to growth and progression of breast cancer by cross-talking with other growth factor receptors19. On the other hand, glucocorticoids possessing an anti-inflammatory feature, induce apoptosis in lymphomas and leukaemia20 whereas androgen receptor signaling (AR), a key regulator of normal prostate development, is disrupted in prostate cancer21. Since they have crucial roles in initial stages and progression of cancers, SHRs are used as targets for drug therapy against many hormonally-responsive cancers22.
1.2.1. Mineralocorticoid Receptor (MR) signalling
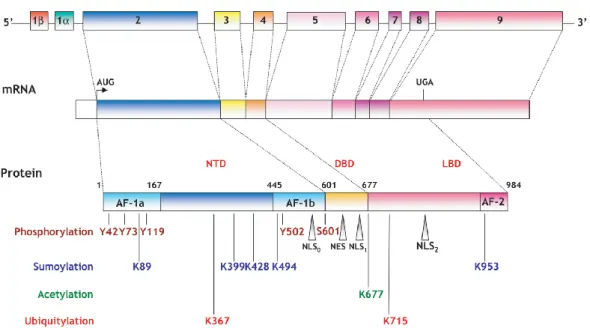
NR3C2 gene localized on chromosome 4q31.1-4q31.2 encodes the Mineralocorticoid Receptor (MR) in human23. Human MR (hMR) is composed of 10 exons of which first two are called as “1α and 1β”, and are not translated into protein. Transcripts of hMR, hMRα and hMRβ are constituted by these two untranslated exons while promoters located in these exons regulate gene expression of MR24. A 107kDa MR protein is translated from hMR mRNA in target tissues of mineralocorticoid hormone25. MR shares a common structure with other members of steroid hormone receptor family (Figure 1.2).
5
Figure 3.1: Genomic structure of human mineralocorticoid receptor.
*Figure was taken from “Viengchareun et. al. The mineralocorticoid receptor: insights into its molecular and (patho) physiological biology. Nucl Recept Signal 2007 30; 5:e012”
Expression of MR is seen in various epithelial and non-epithelial tissues. MR is mostly known as a regulator of salt and water balance in kidney, colon and skin26. MR expression is also reported in the ducts and secretory tubules of mammary epithelia27. MR exhibits tissue specific functions in non-epithelial tissues28 such as adipocyte differentiation28-29, regulation of blood pressure, hemodynamic homeostasis, salt appetite30 in cardiovascular system and behavioral responses like memory31 in brain. A pro-inflammatory role of MR has also been demonstrated in cardiovascular system in the Rickard et. al.32 study.
Tissue specific ligands of MR decide the genomic actions of MR that has two main physiological ligands, ALDO (mineralocorticoids) and cortisol (glucocorticoids) 33.MR possesses higher affinity towards its ligands in both the epithelial and non-epithelial tissues besides both ligands exhibit same affinity to MR in epithelial tissues.33-34 Ligand selectivity of MR in epithelial tissues relies on activity of 11β-hydoxy-steroid dehydrogenase type 1 (HSD11B1) and 11β-11β-hydoxy-steroid dehydrogenase type 2 (HSD11B2) enzymes35. Type 1 enzyme possesses a reductase function thereby producing active cortisol/glucocorticoid from inactive 11-dehydro metabolites (corticosterone). As a result of this reaction, level of circulating
6
glucocorticoids in blood increase and receptor becomes occupied by glucocorticoids. Type 2 dehydrogenase/11β-HSD2 converts cortisol into cortisone, which is an inactive form of the ligand, thereby decreasing the circulating level of cortisol and making the ligand binding site of the receptor available for aldosterone binding in epithelial tissues35-36-37.
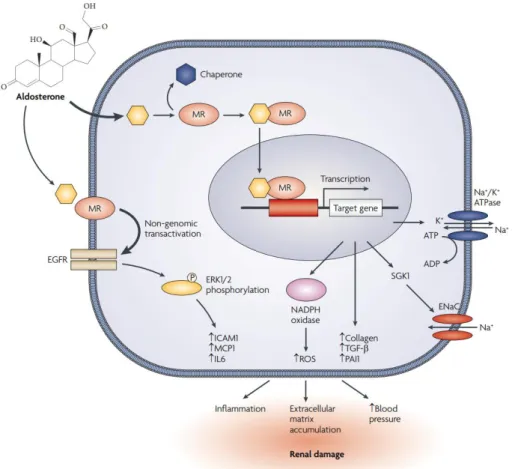
Once MR is occupied by its tissue specific ligand, a conformational change is triggered. In the inactive state, MR makes a hetero-oligomeric complex with heat shock protein 90 (Hsp90) in the cytosol and conformational change of MR results in disruption of this complex38-39. After dissociation, MR translocates to the nucleus; receptor homodimerization occurs; and MR binds to the hormone response element of its target gene(s). All these results in transcriptional activation or repression of target gene(s) 32-39-40-41 (Figure 1.2).
Figure 1.4: Genomic actions of mineralocorticoid receptor.
*Figure was taken from “Norberto Perico et. al, Nature Reviews Drug Discovery, 2008 vol 7 no 11.”
7
Non-genomic actions of MR are mediated through its activation by its tissue specific ligand, aldosterone (ALDO) for most of the epithelial tissues, and then transactivation of epidermal growth factor receptor (EGFR). EGFR further phosphorylates and activates extracellular signal-regulated kinases (Erk 1/2) thus stimulates tissue-specific non-genomic actions of ALDO induced-MR40.
MR activity and signaling is regulated by post-translational modifications such as phosphorylation, ubiquitination, methylation and other modifications. Receptor stability and turnover of MR are modulated by phosphorylation and ubiquitination42. It has been previously demonstrated that MR is a phospho-protein and commonly, phosphorylated at the serine/threonine residues within ligand binding domain. Phosphorylation leads to an upward shift in molecular weight of MR in immunoblots43. On the other hand, ubiquitination also affect MR activity. Receptor activation upon ligand binding triggers poly-ubiquitination of MR that remains in a mono-ubiquitiylated form in the cytosol44 and later, the MR receptor is degraded by proteasomes45.
1.2.2. MR signalling in cancer
Members of steroid receptor family are commonly dysregulated in hormonally responsive cancers such as lung, breast, colon, prostate. As mentioned earlier, expression patterns of these receptors could be utilized in categorization of hormone-dependent diseases. However, there are only a few studies showing importance of MR function and its potential dysregulation in cancer.
MR has been considered as a biomarker for lung cancer and increased MR expression is linked with better patient prognosis45. MR also participates in development of hepatocellular carcinoma (HCC) by regulating energy metabolism of the liver. In fact, the downregulation of MR expression results in poor prognosis in HCC46. On the other hand, decreases in expression level of MR might influence tumor growth and progression by inducing angiogenic pathways as shown in colorectal cancer.47-48 Moreover, research has shown that glucocorticoid receptor expression decreases in breast tumor progression. Due to the possible interactions of
8
glucocorticoid and mineralocorticoid receptors in the breast tissue, it is suggested that MR expression may be lower in breast tumorigenesis49.
1.2.3. Glucocorticoid Receptor (GR) signalling
Human glucocorticoid receptor (hGR) is another member of SHR family and encoded by NR3C1 gene (located in 5q31Y32) that is constituted by 9 exons50. Two alternative splices in Exon 9 form two isoforms of hGR protein which are hGRα and hGRβ having 97kDa and 94kDa molecular weights, respectively51. There are 13 identified variants of hGR formed by multiple promoter regions within exon 152-53. HGR is generated by common domain structures of steroid hormone receptors. HGR has functions in almost all tissues and organs in human body. Many cellular processes i.e., cell differentiation and proliferation, glucose metabolism, maintenance of homeostasis as response to stress54, and regulation immune system55, are controlled by GR.
Genomic action of GR is initiated by binding of glucocorticoids/cortisol to the receptor and then continues with GR’s dissociation from heat shock proteins and its shuttling to nucleus. After nuclear translocation, GR binds to glucocorticoid response element56 (GRE) in the promoter site of target genes and mediates transactivation of these genes57-58-59.
GR exhibits its activity as a transcription factor via either DNA-dependent or independent actions which are through either crosstalk with other transcription factors like other members of steroid receptor family, NF-κB60-61 or interactions with kinases62. GR also make interactions with other members of SHR family and this results in various tissue-specific actions. For example, ALDO and synthetic agonist of glucocorticoids called as Dexamethasone (Dex) interact with PR, mimicking the progesterone functions and leading to growth inhibition and focal adhesion in breast cancer cells63. In another study, GR antagonist exerts its effects on ER transcriptional activity through direct protein-protein interactions in the E2-induced ERα + breast cancer cells64. A recent work by Karmakar et. al shows that coexpression of GR and ER results in better survival in the ER + breast cancer patients65.
9 1.2.4. GR signalling in breast cancer
Glucocorticoids are commonly used as premedication for chemotherapy in hormonally responsive cancers like breast and prostate to reduce toxicity and side effects of chemotherapeutic reagents66. Moreover, studies with normal breast cells revealed presence of anti-proliferative and anti-apoptotic properties of glucocorticoids in mammary epithelia67-68. These features of glucocorticoids and GR are also studied in the context of breast cancer. It has been shown that GR protects cancer cells from apoptosis by modulating survival genes like SGK169. There is a recent study indicating inhibitory effect of Dex on proliferation of the breast cancer cell line, MCF-770. On the other hand, GR expression is reduced in parallel with breast cancer progression71-72. When the disease becomes more progressive and aggressive, GR expression is downregulated in breast tumours. In addition, expression levels of GR in tumour cells affect patient survival in a molecular subtype specific manner in breast cancer. It has been reported that tumour cells with high GR expression show poor survival in ER – breast cancer73.
1.3. Downstream targets of MR in epithelial tissues
Mineralocorticoid receptor signalling affects expression patterns of several genes since it is expressed in multiple tissues. Several tissue-specific downstream targets of MR are summarized in Table 1.3.
10
Table 1.2. Downstream targets of MR in epithelial tissues.
*Table was taken from “Viengchareun, S., Le Menuet, D., Martinerie, L., Munier, M., Pascual-Le Tallec, L., & Lombès, M. (2007). The mineralocorticoid receptor: insights into its molecular and (patho) physiological biology. Nuclear Receptor Signaling, 5, e012.”
1.3.1. Serum Glucocorticoid Kinase-1 (SGK1)
SGK1 is one of the downstream targets of MR in colon and kidney (Table 1.3). It belongs to the AGC protein kinase family, a subfamily of serine/threonine kinases. The members of this subfamily phosphorylate their targets/substrates at serine or threonine residues within the target proteins. The gene controlling SGK1 expression (located in 6q23) consists of 14 exons and encodes 49 kDa protein product74. SGK1 has two paralogs expressed in human, named as SGK-2, SGK-375. SGK proteins that have similar structure of protein kinase B (PKB)/Akt family of kinase. The SGK structure is constituted by an N-terminal domain, a kinase domain for its catalytic activities involving threonine residues in its activation loop, and a C-terminal domain involving serine residues76. Serine and threonine residues modulate complete activity of SGK1 and phosphorylation of its substrates76.
11
SGK1 expression occurs nearly in all tissues. Activation of SGK1 is controlled by external stimuli. SGK1 has transcription factor binding sites for GR as well as MR77 and its activation relies on its phosphorylation by phosphatidyl-inositol 3-kinase (PI3-K) on serine residues and by 3-phosphoinositide dependent kinase PDK1 on threonine residues. Upon activation, growth factors such as serum and glucocorticoids as well as mineralocorticoids stimulate SGK1 translocation to the nucleus78-79.
SGK1 facilitates the regulation of cell volume, ion channel activity and thus cell survival and apoptosis. In colon and kidney, epithelial sodium channel (ENaC) activity is modulated by SGK1 expression known to be stimulated upon ALDO induction through MR signaling80. It has been reported that SGK1 expression is upregulated during cell shrinkage thus SGK1 induces the activity of ion channels which take part in increase of cell volume81. Role of SGK1 in survival relies on its activation by PI3K that belong to a survival signaling pathway- and its relation with Akt, the serine/threonine kinase. SGK1 stimulates the survival signals via phosphorylating the downstream targets in the PI3K-Akt pathway82. A study with low and high grade DCIS demonstrates that SGK1 expression is increased in parallel with the disease grades83. Another study demonstrated that increases in the expression of SGK1 exerted anti-apoptotic role in breast cancer cells. When knock down study was performed to decrease expression levels of SGK1, breast cancer cells became more sensitive to chemotherapy in response to the decrease in SGK1 expression levels84.
1.3.2. Neural precursor cell expressed developmentally downregulated gene 4-like (NEDD4-2)
MR signaling modulates the activity of certain genes as its downstream targets. Neural precursor cell expressed developmentally downregulated gene 4-like, NEDD4-2 (NEDD4L) is one of those genes regulated by MR activity in epithelial tissues85.
NEDD4-2 is a member of NEDD4-like E3 ubiquitin ligases and encoded by NEDD4 gene (located in 15q21.3) which has 30 exons. The NEDD4-2 protein product is
12
~120 kDa and family consist of 9 members (NEDD4-1, NEDD4-2, WWP1, WWP2, Smurf1, Smurf2, ITCH, NEDD4L1, NEDDL2)85. All members share a common structure involving C2 domain for membrane binding WW domains for controlling substrate selectivity through interactions with phospho-serine/threonine residues or PY (PPXY) motif in substrates, and a HECT domain for ubiquitin ligase function86. NEDD4-2 is mainly localized in the cytoplasm and exerts its function in tissues such as kidney, lung, and heart87.
As an E3 ubiquitin ligase, NEDD4-2 tags substrates for ubiquitination mediated proteosomal degradation85. NEDD4-2 mainly functions as a regulator of growth factor signaling and ion transport. ENaC is one of the substrates of NEDD4-2; and NEDD4-2 leads to proteosomal degradation of ENaC in epithelial tissues. SGK1 as an ALDO induced gene facilitates the NEDD4-2 mediated alterations in expression and degradation of ENaC in the colon and kidney88-89. In addition, cell surface expression of insulin-like growth factor (IGF-1) receptor is modulated through NEDD4-2 actions90.
Besides its normal physiological role, NEDD4-2 also participates in tumorigenesis. Altered expression patterns of NEDD4-2 are associated with tumour invasiveness and worse clinical outcomes of the disease. Furthermore, copy number loss in the chromosomal location of NEDD4-2 gene appears in many cancer types including the breast cancer and affect tumour aggressiveness91.
1.3.3. Epithelial Sodium Channel (ENaC)
Epithelial Sodium/Na+ channel (ENaC) as a transmembrane protein is another downstream target of MR signaling in epithelial tissues. There are four subunits of ENaC (α, β, γ and δ) and trimeric complexes made up of α, β, γ92-93 constitute the functional epithelial sodium channel. Chromosomal locations of genes encoding β and γ subunits are chromosome 16p while αENaC is on chromosome 12p and δENaC is on chromosome 1p. Subunits have 13 exons and encode 100 kDa, 73kDa, 76 kDa and 70 kDa gene products for α, β, γ and δ, respectively94.
13
Subunits of ENaC are the members of Degenerin superfamily. Each subunit is structured by the extracellular loop/domain, two helices crossing the membrane thus forming cytoplasmic N-terminal and C-terminal domains. Cytoplasmic parts of the channel involving PY motifs provide sites for protein-protein interactions and posttranslational modifications for channel trafficking and gating whereas extracellular loop directs the movement of channels to the cell surface95. ENaC is also known as amiloride sensitive sodium channel; and amiloride blocks Na+ transport by binding domains within the extracellular loop of ENaC96.
ENaC is placed in apical membrane of epithelial cells. All three subunits of ENaC come together in the endoplasmic reticulum, undergo posttranslational modifications through Golgi and then they are delivered to the membrane. Receptor is placed to the membrane in an unstable form and matured by ENaC regulatory molecules. These processes are fundamental for the maximum activity of the channel93. ENaC activity depends on the number of channels which is managed by a dynamic relation between degradation and new synthesis of the channel on the cell surface. ENaC activity, expression and its stability on membrane are controlled by ENaC regulatory complex involving SGK1 and NEDD4-297-98.
ENaC is expressed in the lung, kidney and mammary epithelial cells as well as in breast cancer cells (MCF-7 and T-47D)98-99. The main role of ENaC in epithelial tissues is to facilitate in regulation of Na+ transport and and the blood pressure in a hormone dependent manner97. SGK1 and NEDD4-2 modulates Na+ transport and ion homeostasis via ALDO induction in colon and kidney100. On the other hand, ENaC is post-translationally modified by NEDD4-2. NEDD4-2 binds to PY motifs of αENaC and γENaC by its WW domains and stimulates receptor internalization and further degradation by the proteasome thus functioning in receptor stability and abundance100. Another regulatory mechanism influencing the ENaC activity is proteolytic cleavage of α and γ subunits of ENaC. Tissue-specific proteases take part in these cleavage processes. For example, Furin acts as a protease cleaving αENaC and γENaC from their extracellular loops thus functioning in channel maturation and activation101.
14
Unlike physiological functions, ENaC is also involved in different mechanisms in cancer. Contribution of αENaC to cell proliferation was shown in hepatocellular carcinoma cells. It has been suggested that ENaC mediated Na+ influx might act as a mitotic signal triggering cell cycle of cancer cells102. Since ENaC modulate Na+ transport, it affects cell shape and stiffness through regulating cell volume. Therefore ENaC takes part in cell migration and invasion in cancers. Silenced αENaC expression results in decrease migration of melanoma cells103. In addition, αENaC and γENaC participate in invasion of glioma cells104. As a result of these actions, it has been suggested that ENaC might contribute cancer development. There is also a study showing potential action of ENaC in breast cancer. Increased release of reactive oxygen species is found to be associated with upregulated of γENaC levels in breast cancer105.
1.4. Regulation of downstream targets of MR
1.4.1. Mechanism of ENaC Regulation by SGK1 and NEDD4-2
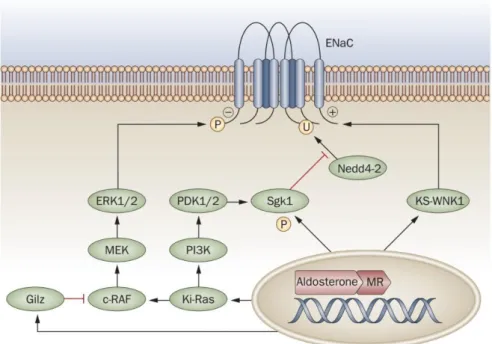
Epithelial sodium channel has a pivotal role in regulation of Na+ homeostasis and blood pressure. Molecular mechanism underlying the ENaC regulation is constituted by an interplay between SGK1 and NEDD4-2 in kidney, colon and cardiovascular disease. ALDO triggers MR-mediated activation of SGK1. Active SGK1 phosphorylates NEDD4-2 by interacting with serine residues in the PY motif of NEDD-2. Phosphorylated NEDD4-2 becomes functionally inactive due to conformational changes in its PY motif and could not be able to interact with ENaC via its WW domains. Therefore, cell surface abundance of ENaC is increased as a result of SGK1/NEDD4-2 pathway89-100-106-107.
15
Figure 1.3: Regulation of ENaC in cardiovascular diseases and kidney.
*Figure was taken from “Briet, M., & Schiffrin, E. L. Aldosterone: effects on the kidney and cardiovascular system. Nat Rev Nephrol (2010), 6(5), 261–273.”
1.4.2. E2 and ALDO treatments: Effects on MR targets
E2 as a steroid hormone with roles in many physiological processes involving mammary development, fluid balance, and heart diseases in various tissues such as ovary, testis, mammary gland, prostate and heart108. Biological functions of E2 are managed by the Estrogen Receptor (ER/ESR1). There are two subtypes of ER, ERα and ERβ in mammals and each is expressed from ESR1 (NR3A1- locating 6q25.1) or ESR2 (NR3A2-locating 14q23-24.1) genes, respectively. ERα and ERβ consist of 8 exons which form splice variants of each gene and producing 67 kDa, 59 kDa protein products for ERα and ERβ108-109. Multiple promoter sites control tissue specific action of ER. ER is formed by common structural parts of SHRs. In addition, ER exerts its functions through following the same activation processes occur in the MR and GR activation. ER binds to estrogen responsive elements (ERE) 77 of target genes thereby modulating the expression patterns of its target genes110.
Genes regulated by MR signaling i.e., SGK1, NEDD4-2 and ENaC are also regulated by E2 in different tissues. SGK1Studies with E2 revealed its regulatory role on
16
SGK1 in myocardium111. In addition, mammalian target of rapamycin complex (mTORC) mediates phosphorylation of SGK1 and studies with ER + breast cancer cells suggest that E2 induction and ER activity might be necessary for the action of mTORC on SGK1112. Subunits of ENaC are also modulated by E2 differentially reported in studies with kidney, lung and osteoblasts. E2 treatments result in increases in expressions of αENaC and βENaC in kidney and lung at the mRNA level whereas no change is detected in the expression levels of γENaC 113-114. In contrast, both mRNA and protein expressions of αENaC and γENaC are upregulated in response to E2 in osteoblasts115. E2 effect also investigated in MLE-12 cells (murine lung epithelial cells). E2 exposure caused no change in mRNA expression levels of ENaC subunits (namely α, β and γ) after LPS induction in MLE-12 cells116. On the other hand, there is a published study indicating E2-activated ERα receptor blocks the transcriptional activities of MR via making inhibitory complex with MR in nucleus in kidney cells117.
Another regulator of SGK1, NEDD4-2 and ENaC in epithelial tissues is the ligand of MR, ALDO. ALDO facilitates ion transport by regulating interaction of SGK1 and NEDD4-2 thus changing the cell surface expression and abundance of ENaC. Increases in circulating aldosterone levels induce the protein abundance of αENaC while no effect occurs in other subunits in kidney118. As explained in 1.4.1 part of the Introduction, a rapid upregulation in expression of SGK1 occurs in response to ALDO and activities of SGK1 through NEDD4-2 leading to decreased abundance and cell surface expression of ENaC77-80-106.
1.4.3. MR overexpression
MR downstream targets can also be modulated by alterations in MR transcriptional activity. Since MR is a phospho-protein and it is hard to detect it in stable form due to its further proteosomal degradation, overexpression of MR has been performed in various tissues including kidney, cardiomyocytes to study tissue specific actions of MR. Alnemri et. al119. established the first study on MR overexpression, by using
Spodopteru frugiperda (Sf9) insect cells. Human renal mineralocorticoid receptor
was overexpressed in insect cells and its phospho-protein feature, activity and nuclear translocation upon ALDO stimulation were shown119. Most of the studies
17
involving MR overexpression have been performed by using in vivo mouse models. In addition, MR has been overexpressed in mouse cortical collecting duct kidney cell line (mmCCDcl1) to study ubiquitination process of MR protein43. Two MR expression vectors, i.e., Pcmv4-hMR and pcDNA3.1-S-tag MR, have been used in this study. In another study, MR has been overexpressed in rat cardiomyoblast cell line to decipher downstream targets of ALDO in cardiomyocytes120.
1.5. Aim of the Study
Patients with breast cancer have high mortality rates so that the diagnosis of this cancer plays a pivotal role for better clinical outcomes. Some members of nuclear receptor family are commonly used as biomarkers for disease diagnosis and prognosis. Recently, Jeong et.al. (2010) demonstrated that MR as a member of nuclear receptor family members, is downregulated in lung cancer. Accordingly, higher MR expression is associated with better patient survival and good prognosis in lung cancer121. Furthermore, there are other studies performed in HCC and colorectal cancers supporting the decreased expression pattern of MR and its relation with cancer progression46-47.
The first hypothesis of this study is that expression of MR and GR, both being from the same receptor family and share ligands, might exhibit a similar pattern in breast cancer. There is no study in literature that shows the correlation of MR and GR at the protein level in breast cancer. Furthermore, an in-silico analysis of laser dissected epithelial tissues from breast tumour and non-tumour tissues (GSE54002) showed that non-tumour tissues exhibited relatively low MR expression compared to tumors (Study performed by Huma Shehwana, Konu Lab, Bilkent University). This phenomenon results in worse clinical outcomes and poor prognosis in breast cancer patients (kmplot.org). Similary GR also exhibited prognostic significance (Hazard ratio= 1.09 (0.98-1.22). Thus, our first aim was to experimentally validate our
in-silico analysis by investigating expression patterns of MR at protein level, using
protein samples extracted from various subtypes of breast cancer cell lines. In addition, we also investigated expression patterns of GR and enquired possible correlations in expression patterns of MR and GR proteins in the same set of breast cancer cell lines. We hypothesized that MR and GR might display similar expression
18
patterns across breast cancer cells since both receptor share structural and ligand similarities. This will reveal the significance of MR and GR in breast cancer subtyping for better diagnosis and prognosis of the disease and provide in vitro cell line models for further study in breast cancer.
Our second motivation was to decipher regulatory role of ALDO and E2 on downstream targets of MR signaling which were previously established in epithelial tissues as being modulated by MR. Results of this study will help identify whether there are similarities between breast tissue and other epithelial tissues and cancers. Three subunits of ENaC and its regulators, SGK1 and NEDD4-2 have been well-studied in terms of their regulations by ALDO stimulated MR signaling in kidney, cardiovascular diseases and the colon77-80-106. While some of these genes such as SGK1 and γENaC individually function in breast cancer, regulation and expression profiles of all these molecules remain unknown for breast cancer in the literature.
We performed an in-silico analysis of breast cancer microarray datasets by using Gene Expression Omnibus (GEO) database in line with our aims. We have found studies that reveal E2 (or Estrogen Receptor (ER), ESR1) dependency of ENaC (its three subunits) and its regulators122-123-124-125.
Thus, this lead us to study interactions among these proteins in relationship to the ER status in breast cancer and compare our in vitro results with the in silico findings in the context of this aim. In addition, there is only one study in the literature showing ER inhibitory action on MR transcriptional activity in kidney cells118. E2’s effect on expression levels of MR in breast cancer is also a missing point in the literature. Therefore, expression modulation in response to E2 and/or ALDO exposures need to be further investigated to reveal regulation of MR and its targets in breast cancer.
Last aim in this study was to perform an overexpression of MR in breast cancer cells. Since MR was downregulated in breast cancer, the overexpression of MR will help functional studies to find out novel signaling pathways and MR effects on the transcriptome in breast cancer. Moreover, future studies may analyze MR activity in relation with its downstream targets using this overexpression model.
19
Chapter 2
Materials and Methods
2.1. Materials2.1.1. General Laboratory reagents and materials:
Laboratory materials, reagents and kits used in this study are listed in Table 2.1.
Table 2.1: General laboratory reagents, materials, and kits.
Name Company Catalog number
Cryovial Grenier-Bioone,
Germany
122280
Hemocytometer Interlab, Turkey Neubauer Improved
6-well plate Grenier bio-one,
Germany
657160
96-well plate Grenier bio-one, Germany
655180
100 mm dish Grenier bio-one,
Germany
664 160
T-25 flask Grenier bio-one,
Germany
690175
T-75 flask Grenier bio-one,
Germany
658175
Serological pipettes Corning, USA 4487-88-89
20
Trypan Blue Sigma Aldrich, USA T8154
QIAzol lysis reagent Qiagen, Germany 79306
RNase ZAP Sigma Aldrich, USA R2020
Nuclease free water Lonza, Switzerland BE-51200 LightCycler 480 Multiwell
plates-96, White
Roche, USA 04 729 692 001
LightCycler SYBR Green I Master
Roche, USA 4707516001
iScript cDNA synthesis kit BioRad, USA 17008891 Complete EDTA-free
protease inhibitor cocktail tablets Roche, UK 11873580001 PhosSTOP easypack phosphatase inhibitor cocktail tablets Roche, UK 4906845001
BCA Protein Assay kit Thermo Scientific, USA 23227 4X Laemmli Sample Buffer BioRad, USA 161-0747 Ponceau S solution Sigma Aldrich, USA P-7170 Page Rule Prestained
Protein Ladder
Thermo Scientific, USA 26616
PVDF membranes Roche, UK 3010040001
TGX Stain-Free™
FastCast™ Acrylamide Kit, 12%
BioRad, USA 1610185
TGX Stain-Free™
FastCast™ Acrylamide Kit, 7.5%
BioRad, USA 1610181
TGX Stain-Free™
FastCast™ Acrylamide Kit, 10%
21 2.1.2. Chemicals
Chemicals used for buffer and solution preparations for protein, RNA, plasmid studies etc. are listed in Table 2.2.
Table 2.2: Chemicals used in protein, RNA, plasmid, and cell culture studies.
Name Company Catalog number
Ethanol Sigma Aldrich, USA 32221
Methanol Sigma Aldrich, USA 24229
Chloroform Sigma Aldrich, USA 24216
Isopropanol/2-propanol Sigma Aldrich, USA 24137
Trizma base Sigma Aldrich, USA T1503
Tween-20 Merck, USA 822184
Sodium chloride Carlo Erba, Italy 479687 Hydrogen chloride Sigma Aldrich, USA 07102 Sodium hydroxide Carlo Erba, Italy 480507
BSA Sigma Aldrich, USA A7905
Blue medical X-ray film Carestream, USA 8143059 Western Bright Quantum
Western Blotting Detection kit
Advansta, USA K-12042-D10
Super RxN medical X-ray film Fujifilm, Japan 4741019318 Hypercassette Autoradiography cassette GE healthcare, UK RPN11643 NucleoSpin MiniPrep plasmid isolation kit
Macherey-Nagel, Germany
22
Ammonium persulfate Carlo Erba, Italy 420627
TEMED BioRad, USA 1610800
6-aminocaproic acid Sigma Aldrich, USA A2504
EGTA AppliChem, Germany A0878
Glycerol Sigma Aldrich, USA 15524
Glycine Sigma Aldrich, USA G4392
HEPES Sigma Aldrich, USA H-1016
Triton x100 Sigma Aldrich, USA T8787
2-mercaptoethanol/ß- AppliChem, Germany A1108,0100 Sodium dodecyl sulfate
(SDS)
Sigma Aldrich, USA 71725
Agar, microbiology grade Sigma Aldrich, USA 05039
Bacto-Tryptone Conda, Spain 1612
Bacto-Yeast extract Conda, Spain 1702
KCl Sigma Aldrich, USA P4504
KOH Sigma Aldrich, USA P6280
MgSO4 Sigma Aldrich, USA M2773
CaCl2 Sigma Aldrich, USA C3306
MgCl2 Merck, Germany A406233
MnCl2 Merck, Germany 1,05917
Pipes Merck, Germany 1.102.200
Ampicillin Roche, UK 835 269
Kanamycin Sigma Aldrich, USA K1876
23
17ß-Estradiol Sigma Aldrich, USA E2758
Aldosterone Sigma Aldrich, USA A9477
2.1.3. Cell culture media and reagents:
Media and reagents used in routine cell culture studies and cell treatments are listed in Table 2.3.
Table 2.3: Cell culture media, reagents and chemicals used in the study.
Name Company Catalog number
DMEM, Low Glucose Lonza, Switzerland BE12-707F RPMI 1640, Low Glucose Lonza, Switzerland BE12-702F DMEM w/o phenol red Thermo Scientific, USA 11880-028 RPMI w/o phenol red Lonza, Switzerland BE12-918F
PBS Lonza, Switzerland BE17-516F
Fetal Bovine Serum (FBS) Biowest, France S181H-500
Trypsin Lonza, Switzerland BE-17-161E
L-Glutamine Lonza, Switzerland BE17-605E
Sodium pyruvate Lonza, Switzerland BE13-115E Penicillin/Streptomycin Lonza, Switzerland DE17-602E
Opti-MEM Thermo Scientific, USA 31985-070
Lipofectamine® 2000 Thermo Scientific, USA 11668027
24 2.1.4. Primers
Primers sequences and regarding product sizes and annealing temperatures are listed in Table 2.4.
Table 2.4.: Primer list.
2.1.5. Antibodies
Antibodies used in Western Blot studies provided with antibody dilutions, appropriate gel running percentages, catalog numbers and company names are listed in Table 2.5.
25
Table 2.5. List of antibodies used in this study.
Antibody Catalog number Company Dilutions Mouse-anti MR rMR1-18 1D5 DSHB/ University of Iowa 1:100
Rabbit-anti GR 12041S Cell Signaling 1:3000
Mouse- anti SGK1 S5188 Sigma 1:2000
Rabbit-anti NEDD4-2* 300-376; A27 (AP)
Cocalico/Dan 1:500
Rabbit-anti αENaC* JL**- #1132 JL 1:5000
Rabbit-anti βENaC* JL- #135 JL 1:10.000
Rabbit-anti γENaC* JL- #552 JL 1:10.000
Rabbit-anti Actin ab1801 Abcam 1:2000
Rabbit anti-GAPDH
sc-25778 Santa Cruz 1:10.000
Anti-rabbit secondary 7074P2 Cell Signaling 1:5000
Anti-mouse secondary 7076P2 Cell Signaling 1:5000
* denotes that it was a kind gift from Prof. Olivier STAUB, Department of Pharmocology and Toxicology, University of Lausanne.
** JL denotes Johannes Loffing from Institute of Anatomy, University of Zurich.
2.1.6. DNA constructs
DNA constructs used for overexpression studies; pcDNA3.1 and pcDNA3.1-Stag MR were kind gifts of Dr. Nourdine Faresse, University of Zurich. P-EGFP N2 construct was a kind gift from Assist. Prof. Dr. Ebru ERBAY.
26 2.1.7. Buffers
Buffers commonly used in Western blot, protein, plasmid studies are listed in Table 2.7.
Table 2.6: Buffers commonly used in Western blot, protein, and plasmid studies.
Name Components
10X TBS 24 g Tris, 88 g NaCl dissolve in 900 ml ddH2O. PH adjusted to 7.6, volume bring up to 1000ml.
1X TBS-T (Tween 0.1%) 100ml from 10X TBS, 900 ml ddH2O, 1ml Tween-20.
10X Running Buffer 10.08 g SDS, 30.3 g Tris, 144g Glycine, volume up to 1000ml with ddH2O. Keep at °C after dissolving.
1X Running Buffer 100 ml from 10X Running Buffer, 900 ml ddH2O. Stored in aliquots at 4 °C.
Anode Buffer I 300 mM Tris, 20% Methanol, volume up to 500 ml with ddH2O.
Anode Buffer II 25 mM Tris, 20% Methanol, volume up to 500 ml with ddH2O.
Cathode Buffer 40 Mm 6-aminocaparoic acid, 20%
Methanol, volume up to 500 ml with ddH2O.
4X SDS Loading dye 900 µl BioRad Laemmli Buffer, 100 µl Protein Lysis Buffer 25 ml from 1M HEPES, 15 ml from NaCl,
2.5 ml from 200 mM pH:8.0 EGTA, 57.4 ml from 87% Glycerol, 50 ml from 10% Triton x100, volume up to 500 ml with
27
ddH2O. Stored at 4 °C.
Mild Stripping Buffer 15g Glycine, 1g SDS, 10ml Tween-20 volume up to 800 ml with 900 ml ddH2O. PH adjusted to 2.2 and volume bring up to 1000ml with ddH2O (Freshly prepared). SOB (Super Optimal Broth) Medium 20 g Bacto-tryptone, 5 g yeast extract,
0.584 g NaCl, 0.186 g KCl, 2.03 g MgCl2, 2.465 g MgSO4 dissolved in 1L ddH2O. Prepare just before autoclave.
Transfer Buffer 0.6048 g Pipes, 0.441 g CaCl2, 3.727 g KCl, 1.7806 g MnCl2. All components except MnCl2 were dissolved in 100 ml ddH2O. PH adjusted to 6.7 with 1M KOH. If it became more than 6.7, prepare the solution again. Then add MnCl2, bring the volume to 200 ml with ddH2O and filter sterilized with 0.45 µm filter. Store at 4 °C. Glycerol stock 10 ml LB media, 10 ml Glycerol. Vortexed
and filter sterilized by 0.45 µm
LB (Luria broth) agar 2 g Bacto-tryptone, 1 g yeast extract, 1g NaCl
dissolved in 200 ml ddH2O. Prepare just before
autoclave.
LB media 5 g NaCl, 5 g tyrptone, 2.5 g
Bacto-yeast extract, volume up to 500 ml with
28 2.2. Methods
2.2.1. Cell Culture studies
2.2.1.1. Cell lines:
Multiple breast cancer cell lines were used throughout this study, i.e., MCF-7, MDA-MB-231, MDA-MB-453, T-47D, ZR75-1, BT-20, CAL-51, HCC-1937 (ATCC; Manassas, USA). HEK (Human embryonic kidney cell line) and mCCDc11 (mouse cortical collecting duct cell line) cell lines were used as positive controls in Western Blot studies. MCCDc11 cells whole protein extract was a kind gift from Dr. Nourdine Faresse, Institute of Anatomy, University of Zurich. HEK-293 cells were a kind gift of Assist. Prof. Dr. Ebru ERBAY.
Breast cancer cell lines used in this study are listed with regard to their molecular subtypes and hormonal status in Table 2.7.
Table 2.7: Gene expression profiles and molecular subtypes of breast cancer cell lines. Cell line ER PR Her2 Molecular subtype
MCF-7 + + - Luminal MDA-MB-231 - - - Basal B MDA-MB-453 - - + Luminal T-47D + + - Luminal ZR75-1 + - - Luminal BT-20 - - - Basal A
CAL-51 - NA* - Basal B
HCC-1937 - - - Basal A
Data provided from “Kao J, Salari K, Bocanegra M, Choi Y-L, Girard L, et al. (2009) Molecular Profiling of Breast Cancer Cell Lines Defines Relevant Tumor Models and Provides a Resource for Cancer Gene Discovery. PLoS ONE 4(7): e6146”.
29 2.2.1.2. Growth conditions:
All cell lines were grown in 37 °C incubator with 5% CO2. MCF-7, MDA-MB-231, MDA-453, BT-20, HEK cells were grown in DMEM, supplemented with 10% FBS, 2% L-Glutamine, 1% Sodium pyruvate, 1% Penicillin/Streptomycin, 1% Non-essential amino acids.
T-47D, HCC-1937 and ZR75-1 cell lines were maintained in RPMI 1640, supplemented with 10% FBS, 2% Sodium pyruvate, 1% Penicillin/Streptomycin, 1% Non-essential amino acids.
CAL-51 cell line was grown in DMEM with 20% FBS, 2% L-Glutamine, 1% Sodium pyruvate, 1% Penicillin/Streptomycin, 1% Non-essential amino acids.
Each cell type was grown in T-75 flasks before any experiment. All estrogen, aldosterone treatments and transfection studies were carried out in 6-well plates. For protein studies, investigating the expressions of MR and GR across multiple breast cancer cell lines, cells were grown in 100 mm plates.
2.2.1.3. Passaging cells:
Cells were passaged when confluent at 80-90%. As a first step, medium was aspirated and cells were washed with 1X PBS. PBS was then aspirated and 0.25 ml, 0.50 ml, and 1 ml of Trypsin-EDTA were used per well at 6 well plates, T-25 flask and T-75 flask, respectively. Trypsinization of cells for 2 minutes in incubator at 37°C with 5% CO2 was reversed by addition of complete medium (at least twice the volume of used trypsin) onto detached cells. Cells were re-suspended in medium by pipetting up and down thus cell clamps were disrupted to homogenize cell suspension. Cells were distributed into new flasks or plates in various dilutions depending on the following experiments.