EXPORT PERFORMANCE OF TURKEY IN THE EUROPEAN UNION
MARKET IN COMPARISON TO SOUTH EAST ASIAN COUNTRIES:
1990-1997
A Master’s Thesis
b yZELAL KOTAN
Department of
Economics
Bilkent University
Ankara
September 2000
H f 1 Í *o. Ъ
‘EXPORT PERFORMANCE OF TURKEY IN THE EUROPEAN UNION MARKET IN COMPARISON TO SOUTH EAST ASIAN COUNTRIES: 1990-1997”
The Institute o f Economics and Social Sciences o f
Bilkent University by
ZELAL KOTAN
In Partial Fulfillment o f the Requirements for the Degree o f MASTER OF ARTS IN ECONOMICS
in THE DEPARTMENT OF ECONOMICS BILKENT UNIVERSITY ANKARA September 2000
I certify that I have read this thesis and have found that it is fully adequate, in scope and quality, as a thesis for the degree o f Master o f Economics.
____
(Yrd. Doç. Dr. Sdmar Sayan)' Supervisor
I certify that I have read this thesis and have found that it is fully adequate, in scope and quality, as a thesis for the degree o f Master o f Economics.
(Yrd. Doç. Dr. Kıvılcım Metin) Examining Committee Member
I certify that I have read this thesis and have found that it is fully adequate, in scope and quality, as a thesis for the degree o f Master o f Economics.
(Yrd. D
09
/ D / BlTin'^eyapti) Examining Committee MemberApproval o f the Institute o f Economics and Social Sciences
(Prof Dr. Ali Karaosmanoglu) Director
ABSTRACT
EXPORT PERFORMANCE OF TURKEY IN THE EUROPEAN UNION MARKET COMPARED TO THE SOUTH EAST ASIAN COUNTRIES
Kotan, Zelal
M.A., Department o f Economics Supervisor: Assistant Prof. Serdar Sayan
September 2000
Turkish exporters often complain that they cannot maintain a competitive price advantage over South East Asian exporters in world markets. This thesis aims to investigate if relative geographical proximity o f Turkey to the EU market provides a compensating advantage for Turkish exporters selling to this market. In this framework, the study attempts to measure the degree o f price competitiveness stemming from the relative proximity o f exporters. For this purpose, export similarities between SEAs and Turkey are determined first. The importance o f competitiveness on the overall export performance o f each exporter is identified by using the Constant Market Share Analysis and then, the degree o f price effect on the competitiveness is found by estimating two- stage homothetic demand functions. The proximity advantage o f Turkish exporters relative to SEA exporters is identified by analyzing the difference between CIF import and FOB export prices. The results indicate that Turkey has a price advantage relative to SEA countries in the product group that exhibits the highest degree o f export pattern similarity to those countries.
Keywords: Export Performance, Constant Market Share Analysis, Two-Stage Homothetic Demand Functions.
ÖZET
TÜRKİYE’NİN AVRUPA BİRLİĞİ İHRACAT PAZAR PERFORMANSININ GÜNEY DOĞU ASYA ÜLKELERİYLE KARŞILAŞTIRMALI ANALİZİ
Kotan, Zelal
Master, Ekonomi Bölümü
Tez Yöneticisi: Yrd. Doç. Dr. Serdar Sayan Eylül 2000
Türk ihracatçılar çeşitli vesilelerle Avrupa piyasasında Güney Doğu Asya ülkeleriyle fiyat rekabetinde zorlandıklarını iddia etmektedirler. Bu tezin amacı, Türkiye’nin Avrupa’ya olan coğrafi yakınlığının Türk ihracatçılara Avrupa piyasasında bir ek avantaj sağlayıp sağlamayacağını araştırmaktır. Bu nedenle, ilk olarak Türkiye ve Güney Doğu Asya ülkelerinin Avrupa Birliği’ne yaptıkları ihracat kompozisyonunun benzerlik derecesi bulunmuştur. Daha sonra, rekabetin toplam ihracat performansını ne ölçüde etkilediği Sabit Piyasa Payı Analizi ile ortaya çıkarılmıştır. Bir sonraki aşamada ise fiyatların toplam rekabeti ne ölçüde etkilediği İki Aşamalı Homotetik Talep Fonksiyonu tahmin edilerek bulunmuştur. Böylece, fiyatların, toplam rekabetteki yüzde payı da ortaya çıkarılmıştır. Daha sonra ise, Avrupa Birliğine olan coğrafi yakınlığın fiyatları ne kadar etkilediğini bulmak amacıyla (navlun ve sigorta hariç) ihracat ve (navlun ve sigorta dahil) ithalat fiyatları arasındaki fark her ülke için analiz edilmiştir. Yapılan analizlerin sonucunda, Türkiye’nin en çok tekstil ve giyim ürünleri ihracatında Güney Doğu Asya ülkeleriyle benzerlik gösterdiği ve bu grupta da coğrafi yakınlıktan doğan göreli bir fiyat avantajı olduğu bulunmuştur.
Anahtar Kelimeler: İhracat Performansı, Sabit Piyasa Payı Analizi, İki Aşamalı Homotetik Talep Fonksiyonu.
1 would like to express my gratitude, first and foremost, to Professor Serdar Sayan, for his invaluable intellectual and moral support he provided during the course o f this study. Thanks to his understanding, trust and patience, 1 was able to change my thesis topic three time before
1
started working at the last one.1
would also like to thank to the members o f my examination committee. Professors Kıvılcım Metin and Bilin Neyaptı, for their really insightful comments and suggestions, from which I truely benefited a great deal.I would like to thank to Mr. Hüsamettin Nebioğlu, who provided me with the data in a very short time. I would be indebted to all my officemates and especially to Erdal Yılmaz, Pelin Berkmen, Gülbin Şahinbeyoğlu and Mesut Saygılı for the extremely kind and joyful atmosphere they created and for their everlasting support.
ACKNOWLEDGEMENTS
Last but certainly not least, I am greatful to my mother, Behiye Sağır, and my boyfriend. Tolga Aktaş, for being so suppotive, patient and understanding during the most challenging years o f my life.
ABSTRA C T iii
ÖZET jv
A C K NO W LEDG EM EN TS v
TA BLE OF CO NTENTS vi
LIST OF TABLES viii
LIST OF FIGURES ¡x
C H A PTER I: INTRODUCTION I
C H A PTER II: LITERATURE SURVEY 5 C H A PTER III: DATA AND METHODOLOGY 14
3.1 Data 15
3.2 Methodology 17
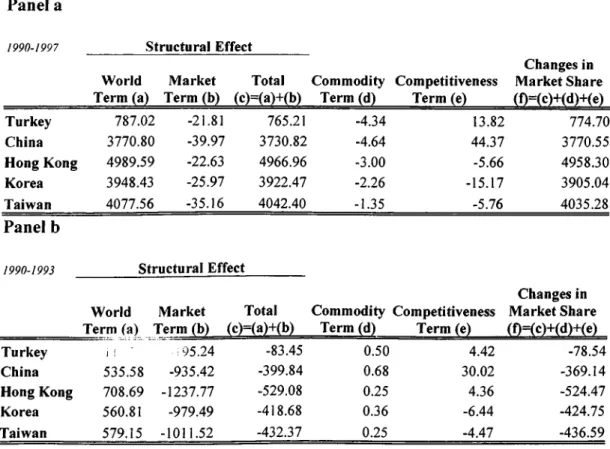
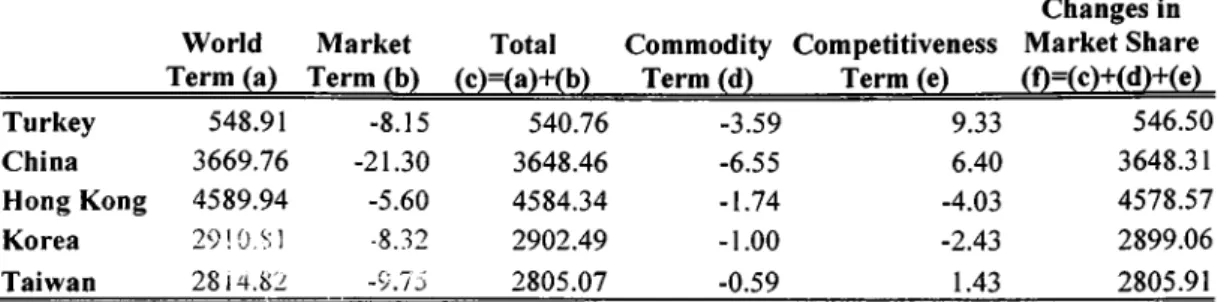
3.2. İ Constant Market Share Methodology 17 3.2. İİ Identifying the Degree o f Price Competitiveness 21 3.2. Îİİ Identifying the Degree o f Proximity Advantage on Prices 25 C H A PTER IV: EMPIRICAL FINDINGS 28 4.1 Export Performance o f Turkey: A Brief Summary 28 4.2 Constant Market Share Analysis 34 4.2. İ Export Similarities 34
4.2. İİ CMS Analysis 38
TABLE OF CONTENTS
4.2.11. a CMSA for Textiles and Garment
4.2.11. b CMSA for Technology Intensive Products 4.3 Price Competitiveness
4.4 Proximity Reflected in Prices C H A PTER V: CONCLUSION BIBLIOGRAPHY 42 46 47 51 55
39
APPEN D IC IESA List o f Variables, Countries and Product Groups used in the Analysis 58 B Derivation o f Equation (3-2) 61 C Derivation o f Import Demand Functions 64 D Relating Two-Stage Demand Function to CMSA 72
1. Results o f Export Similarity for Traditional Exports 36 2. Results o f Export Similarity for Technology Intensive Products Exports 37 3. Results o f the Constant Market Share Analysis o f Exports in Textiles and Garment for
1990-1997 41
4. Results o f the Constant Market Share Analysis o f Exports in Technology Intensive
Products for 1990-1997 45
LIST OF TABLES
5. Estimation Results for Textiles and Garment
6
. Estimation Results for Textiles and Garment46 47 7. The Difference Between Import (CIF) and Export (FOB) Prices for Textiles and Garment for the Period 1992-1997 48
8
. The Difference Between Import (CIF) and Export (FOB) Prices for Technology Intensive Products for the Period 1992-1997 491. Real Effective Echange Rate Index (1987=100) 2. Exports to GNP Ratio in the 1980s
3. Export Growth and Real Effective Exchange Rate 4. Exports to GNP Ratio
5. Composition o f Turkish Exports
6
. Comparing Sub-Sectors o f Turkish Manufactures with that o f SEAsLIST OF FIGURES
29 30 31 32 3329
CHAPTER 1
INTRODUCTION
The Turkish foreign trade has undergone through a considerable structural transformation in me last decade. After a long period o f inward orientation, Turkey undertook a major policy shift from import substitution to export promotion in 1980. Until 1989, the export growth was based on the utilization o f the excess capacity in the manufacturing industry while the decline in real wages and large devaluations improved the competitiveness.
The year 1989 is considered as a comer stone for the Turkish economy and, in particular, for foreign trade which is characterized by the removal o f all controls on foreign capital movements (Kotan and Saygılı, 1999). Such policy changes led to the
14.4 percent real appreciation o f the Turkish lira' during the period from 1990 to 1993. In addition, by subsidies in agriculture and by the real wage increases in the manufacturing sector, domestic demand expanded considerably. Therefore, this period is considered as a slow down in Turkish exports and widening o f the current account deficit. Export growth rate fell from an average o f 12.8 percent in 1980s to 7.2 percent in the 1990-1993 period.
' Real appreciation o f Turkish lira is calculated against a currency basket which is composed o f 1 US dollar and 1.5 German mark. Turkish WPI is taken as domestic inflation rate against a foreign inflation basket that is composed o f US and German PPI, with respective weights in the currency basket (Central Bank o f the Republic o f Turkey, Annual Report, 1999).
After the financial crisis in 1994, the stabilization program was announced and a real exchange rate policy was put into action(Şahinbeyoğlu and Ulaşan, 1999). The policy actions in the stabilization program implicitly aimed to maintain a constant real value o f the Turkish lira.^ After a real depreciation o f Turkish lira by 14.8 percent in April 1994, exports expanded substantially in that year. Inspite o f the real exchange rate policy, which prevented real depreciations, export growth continued. Indeed, the share o f exports in GNP increased considerably. The rate o f the growth o f exports roughly doubled after 1994 which rose from an annual average o f 7.2 percent in 1990-1993 period to 14.5 percent during 1994 to 1997.
It is not only the export growth increase after 1993, the structure o f exports have experienced a change in favor o f manufactured products as well. Growth rate o f manufactured commodities exceeded the average export growth in the second half o f the 1990s. In this respfcci, the annual average growth rate o f manufacturing exports increased from 7.5 percent to 16.2 percent from the period 1990-1993 to 1994-1997. While the growth o f textiles and garment exports followed the same pattern, export growth o f technology intensive products showed a remarkable progress and tripled during the same period. It increased from 8.1 percent in 1990 to 1993 to 26.8 percent during 1994-1997 on average, annually.
The Turkish manufactures have experienced a considerable export growth during the period in consideration. However, the export share in the world trade and the
origins o f the growth, as well as the performance o f the country relative to other exporters in particular markets are also important. Although developments in exports seem to be encouraging for the Turkish exporters especially after 1994, in many circumstances they claim that competition with the South East Asian exporters is the major difficulty, especially in terms o f price. Hence, the main motivation o f this thesis is to provide contradictory evidence against the claims o f Turkish exporters. It aims to analyze the export performance o f Turkey in the European Union (EU) market in comparison to South East Asian (SEAs) countries uring the period 1990 to 1997. ^ It claims on the contrary that although SEAs may have the aforementioned advantage, Turkish exporters can overcome this negative impact by their relative proximity to the EU market. Therefore, the special emphasis o f the thesis will be on the degree o f price competitiveness whixh is related to the relative proximity advantage o f the exporters to the EU market.
In this context, the first step is todetermine the SEA countries having similar export patterns with Turkey. Then, it is identified whether competitiveness is an important factor on the relative export performance o f the countries in consideration by the help o f Constant Market Share Analysis (CMSA) which is a commonly used method to decompose the relative export performance o f a country into structural and competitiveness effects. Afterwards, the degree o f price effect on competitiveness is revealed by estimating two-stage homothetic demand functions. The results o f the estimations show the percentage contribution o f prices on the overall competitiveness.
^ As the OECD database supplies the export data o f Taiwan, South Korea and Hong Kong on commodity basis, the SEAs are restricted to these countries with the addition o f China.
As for the last step, relative proximity advantage o f each exporter or the distance variable in prices is identified by analyzing the difference between CIF (cost o f insurance and freight) import and FOB (free on board) export prices.
The next chapter considers the theoretical foundations o f CMS analysis and surveys empirical studies discussing the decomposition o f export performance by using this methodology. The third chapter describes the nature o f the data and the steps o f the methodology. The following chapter presents empirical findings. The last chapter summarizes the results and derives conclusions.
CHAPTER 2
LITERATURE SURVEY
Constant market share (CMS) analysis is an accounting method that is used to decompose the growth in the share o f a country in world exports into a number o f structural and competitiveness effects. Such a decomposition makes it possible to identify the circumstances under which a country will face a decreased market share - which may occur even when a country maintains its position in every commodity and every export destination.
CMS analysis was first proposed by Tysznski (1951):
... It is a well-established proposition that industrial equipment and modem means o f transport considerably gained in relative importance at the expense o f a number o f consumer goods, notably textiles. It is also well known that, in the course o f time the old manufacturing nations exhibited greatly varying degrees o f adaptability to this process. It was the purpose o f this investigation to give a clearer picture o f changes in world demand for exports and in competitive position o f leauiiii.,; , r; laiions o f the world...(p. 272)
Tysznski calculates two market shares. The first one, hypothetical market share, is defined as the market share o f a particular country in world trade in case the initial commodity compositions remain constant. The second one considers the alteration in the initial market share caused by structural changes in the world trade. These are weighted by the initial market share o f the exporting country in each product group in the import
market. Afterwards, the difference between the two is defined as the change in competitiveness and labeled as the residual term.
Learner and Stern (1970) suggested a framework for CMS calculations, similar to that o f Tysznski’s and renamed the two terms defined by Tysznki as commodity composition and competitiveness effects. As differently than Tysznki, Learner and Stern (1970) consider the growth o f exports rather than market share growth."* Using the growth o f exports makes it possible to analyze the effects o f general changes in world demand. In addition, an “intermediate” term, the market distribution o f the exports o f the country, is included in the analysis. The reasoning is that an export market with relatively higher import demand would have an increasing effect on the export growth o f the country.
Since commodity composition and market term are interdependent, weighting the terms with initial market shares o f the exporting country by commodity in the import market is proposed as the solution o f this problem. However, Richardson (1971) claimed that there was a methodological problem concerning this calculation and showed that taking final or initial year market shares as weights might alter the results o f the CMS analysis leading to different and even different signs. Still, this technical point has not been accepted widely and the method o f Learner and Stern (1970) has become very popular in export performance analyses (Bowen and Pelzman, 1984).
Fagerberg and Sollie (1987) introduced two basic differences in the CMS analysis. The first one is the use o f Laspeyres indexation in the calculations which facilitates comparison o f results. Furthermore, with the help o f Laspeyres indexation o f the growth rates, cornpetiii /¿ni-.s term is split up into commodity adaptation and market adaptation effects. The commodity adaptation effect shows the ability o f the exporter to change its commodity composition faster than other exporters in the particular market. The market adaptation effect, on the other hand, explains the exporter’s relative ability to direct its exports into markets with higher import demand. Flence, the relative performance o f the country in transforming its export structure among countries with relatively higher import rates, and commodities with relatively higher demand can be revealed.
Fagerberg and Sollie (1987) applied their version o f CMS in the analysis o f the export performance o f 20 OECD countries in the OECD market for the period 1961- 1983 and showed the commodity and market adaptation effects. The commodity groups were classified according to SITC Revision 2 categories where they excluded oil and gas because o f the disturbing relative price effects o f these groups. They have found that while the structural changes affect the market share o f the developed countries positively, these effects are negative concerning the relatively less developed countries. On the contrary, less developed countries can adapt their exports to changing market conditions more easily than the developed ones. Overall results show that developed countries lose their market share in favor o f increasing market shares o f developing ones.
Bank o f Mexico (1998) analyzed the changes in the Mexican manufacturing exports in the 1980-1993 period in the OECD market in comparison with Brazil, Chile, Singapore, Taiwan and Korea using the Fagerberg-Sollie CMS method. When manufacturing exports are defined as the
1
digit SITC Revision 3, M exico’s market share in the OECD market was found to increase considerably, especially in the second half o f the period. This is mainly due to the concentration o f exports in the US market and in manufactured products. This, in turn, contributes to the reduction o f vulnerability due to international price movements. However, Mexico cannot adapt its export structure to markets and commodities with relatively higher demand.While Chile is in a slightly better position than Brazil in the first half o f the period, they both lose their market share in 1980 to 1993. This is mainly due to fact that their main export commodities experience price decreases in the international markets. In contrast to the Latin American countries, Taiwan and Korea increase their market share in the OECD market for the whole period but their performance in the first half is relatively better. Furthermore, Singapore experiences the most considerable progress among the countries in consideration. The main reason behind the increasing market share o f South East Asian countries is that the international prices o f their exports show an increasing trend.
Lohrmann (1999) also used the same technique in the market share analysis o f Turkey’s industrial commodities in the 1980s and 1990s in the EU, US/Canada, Japan and OECD market, respectively. The study led to the conclusion that although Turkey could not adapt its export structure to highly growing markets and to commodity groups
with high growth rates in the ¡980s, it managed to increase its market share. Furthermore, in the 1990s, higher technology goods gained importance whereas the importance o f textiles and apparel exports relatively weakened in Turkey.
Merkies and Meer (1988) provided a theoretical foundation for the CMS analysis o f Learner and Stern by relating it to a two-stage homothetic demand model.^ The main assumption behind the study is that exports o f the same commodities by different countries are considered as different products. They use constant elasticity o f substitution demand functions which respectively look at the response o f import demand to changes in prices by country and by commodity from different countries, in these two stages. The results o f the former stage facilitate the interpretation o f commodity term. It is considered as an import demand equation o f the country because it tries to explain the import budget allocation among various imported commodities when relative prices o f these commodities change. The latter stage, on the other hand, shows the effects o f relative price changes on the relative value changes o f exporter specific importation and hence, makes it easier to understand the competitiveness term. In other words, the relationship quantifies the export performance in commodity and competitiveness terms.
If
Merkies and Meer (1988) estimated the demand functions for 5 SITC categories in 1 digit format in 1972-1976 period. The countries included in the analysis were ESCAP countries, USA and Rest o f the World and oil products are analyzed separately. The analysis shows that the structural effects increase the market share o f countries
^ In Appendix D, the relationship between CMS analysis and two-stage homothetic demand model is given in more detail with mathematical derivation.
under consideration. In addition, the oil exporters gain market share because o f the increase in the international oi! prices in the 1972-76 period. Hence, it is inferred that commodity term contributes to the market share o f the oil exporting countries. However, the fitted values and the results o f the analysis regarding the competitiveness term, do not give consistent results. While the CMS analysis implies remarkable market share increases due to competitiveness, estimation results o f the demand equations cannot capture this effect totally.
While a number o f studies try to extend the Learner Stem methodology o f CMS analysis, most empirical works prefer to use it directly in the analysis o f exports. Hoen and Waganer (1989) analyzed the Hungary’s export performance in the OECD market in the 1980-1988 period. They try to reveal the effects o f reforms on the Hungarian exports in comparison with other European countries that implemented such policies later and with less determination. The results o f the analysis show that structural effects have an increasing effect on the market share o f these economies. However, the commodity and competitiveness terms work in the opposite direction and all countries lose their market share considerably during the period from 1980 to 1988. This is mainly due to policies which support the exportation o f wrong commodities and wrong markets. Still, Hungary is in a slightly better position than other countries because it implemented reforms earlier and in a more determined fashion.
Lloyd (1994) analyzed the export growth o f Korea, China and Indonesia in five me Lets, namely EU, Japan, USA, East Asia and the Rest o f the World. Manufacturing and primary product exports are grouped in 1-digit SITC categories for the period
1991. The results o f the analysis show that all countries concentrate on export destinations with strong import demand. In addition, all countries show very large increases in the market share due to competitiveness effect. Indeed, this result is considered as the fundamental characteristic o f the region (Lloyd, 1994). Furthermore, commodity composition contributes to the increasing market share o f Korea significantly but not to that o f China. However, Indonesia experiences remarkable market share losses because o f large primary product exportation during the period.
Müller (1995) evaluated the Brazilian export performance o f forest products by CMS analysis from 1961 to 1990. She relates the analysis to historical information on the government policy, industrialization o f the sector and trends in the forest products trade. The study finds that Brazil has a comparative advantage in the exportation. o f forest products and experiences increasing competitiveness. Government incentives contribute to the increasing export performance as well. In addition, paper products turn out to display a better performance than solid wood products during the whole period.
Guerrieri and Milana (1995) use CMS framework to study the trade performance and relative competitive positions o f the most advanced countries in the high-technology products from 1970 to 1990. The study reveals that US loses its market share due to loss o f competitiveness. This is attributed to the unsustainability o f high US dollar relative to other major currencies during the period under consideration. Japan, on the other hand, has made such a considerable progress in the market share o f high technology products both in terms o f competitiveness and structural factors that no other country can manage a .simiiar trend. In addition, the performance o f newly industrialized South East Asian
countries is found to be remarkable. Although contribution o f competitiveness to this performance is not negligible, it is largely due to favorable structural effects. However, EU countries experience serious reductions in world market shares as also seen by the revealed comparative advantage decreases throughout the period.
Lloyd and Toguchi (1996) studied the manufacturing exports o f Korea, China and Indonesia to the industrially advanced economies (lAEs) over the 1980-1993 period. The study analyzes the export performance in comparison with other developing countries and developed economies. The results show that the three East Asian countries increased their share in the lAEs market considerably due to increased competitiveness. It is inferred that they increase their share in both lAEs imports and market sales as well. However, other developing countries that try to compete in the same market lose their share during the period in consideration. Furthermore, domestic lAE producers are adversely affected from the imported manufactures from Korea, China and Indonesia.
Marjit and Raychaudhuri (1997) employed the CMS analysis o f Learner and Stern in their study o f Indian exports in a period o f 25 years. The study considers the reforms in export policy after 1991 and analyzes the export performance in relation with the policy changes, such as reductions in taxes and subsidies on exports and adjustment o f exchange rates. As a consequence, it is revealed that after the implementation o f separate export policies, Indian exports gain a remarkable competitiveness advantage and progress in favor o f manufactured commodities that are considered to have higher quality.
Luttik ( 1998) constructed an accounting framework that aimed to measure world trade and investment linkages. Using the world accounting matrix, he determines international trade flows. In addition, the growth o f flows and underlying factors behind the growth can be revealed from the matrix. Hence, it is proposed as a useful tool to observe relative market share positions o f the countries.
CHAPTER 3
DATA and METHODOLOGY
The c'.in: yf :his :hesis i: to analyze the export performance o f Turkey in the EU market relative to that o f the SEA countries. The special emphasis will be on the degree o f price competitiveness related to the relative proximity o f the exporters to the destination.
In this context, it should first be identified whether competitiveness is an important factor on the relative export performance o f the countries in consideration. Constant Market Share Analysis (CMSA) is a commonly used method to decompose the relative export performance o f a country into structural and competitiveness effects (Section 3-2-i). After identifying the degree o f competitiveness, two-stage homothetic demand functions are estimated in order to reveal the degree o f price effect on competitiveness (Section 3-2-ii). While the first stage reveals the demand substitution among the imported commodities, the effects o f relative bilateral price changes are revealed at the second stage. Hence, the results o f the second stage give the percentage contribution o f prices on the overall competitiveness.
After identifying the degree o f price competition among the exporters, it now remains to determine their relative proximity advantage in the export market. Hence, the
analysis o f the difference between CIF (cost o f insurance and freight) import and FOB (free on board) export prices is proposed to identify the effects o f the distance variable in prices (Section 3-2-iii).
Due to data limitations the sample o f SEA countries is restricted to Hong Kong, Taiwan, Korea and China. The list o f countries is given in Appendix A.
3-1. Data:
As the data on Turkish exports show that manufacturing exports have comprised about 85 percent o f total exports since the mid-1980s, the analysis in this thesis will be based on main commodity groups o f manufacturing exports. With an average share o f about 50 percent in total exports during the 1990-97 period, textiles and iron-steel are considered to be the traditional export sectors o f Turkey. Hence, they constitute the first group in the analysis. The second group includes technologically intensive commodities (Grupp, 1995).^ Exports o f these commodities significantly contribute to growth and have an increasing share in the world trade (Guerrieri and Milana, 1995). They are highly tradable and can help improve a country’s international competitiveness (Daniels, 1999). In addition, in the 1990-97 period, they increased their share in total exports o f
* Technology intensive products are defined according to the R&D intensities o f the firms, i.e., the rate o f R&D expenditures and their turnover. It is defined by an R&D to sales ratio higher than 4 percent threshold value. They are divided into two sub-groups: leading edge and high-level technology products. In this thesis high-level technology products are included as technology intensive commodities.
Turkey and SEA countries alikeJ Therefore, they are chosen to form the second group in the analysis.
Traditional and technology intensive exports are aggregated into two sectors by summing 29 and 48 sub-sectors, respectively. These product groups are provided in Appendix A in terms o f three digit Standard International Trade Classification (SITC) Revision 3.
Values and prices o f total imports and exports are taken from IMF-International Financial Statistics CD-ROM. Manufacturing exports o f Turkey and SEAs to the EU countries, as well as manufacturing imports o f EU from the World, Turkey and SEAs are obtained from the OECD International Trade Statistics CD-ROM in values and quantities. Export and import prices are calculated by dividing values by respective quantities and then indexing by Laspeyres method.
The sample period covers 1990-1997. However, the export data o f Hong Kong and China in commodity basis is available for 1992-1997, Korea for 1994-1997 and Taiwan for 1990-1996. Export data are used to calculate export prices and these prices are used to identify the proximity advantage in the third part o f the analysis.
3-2. Methodology:
3-2-i. Constant Market Share Analysis:
CMS analysis is a commonly used method to decompose the relative export performance o f a country into structural and competitiveness effects. This analysis has two dimensions. The first one is the decomposition o f individual market shares o f Turkey and SEA countries. Afterwards, the relative performances o f these countries are compared.
Hence, the first step is to calculate export similarity indices between Turkey and SEAs and determine the Asian conutries having similar export patterns with Turkey in the EU market for the two commodity groups defined above.
Export similarity index measures the similarity and compare the pattern o f exports o f two countries to a third market (Finger and Krenin, 1979). * In other words it
^ Another measure to compare the commodity composition o f exports o f two countries is the COS index that estimates the extent o f intra-industry trade (Grubel and Lloyd, 1975).
E„M..
cos =
where Enk and M^k are total commodity k exports o f country n=l,2 and total commodity k imports o f country m, respectively. A COS index taking the value o f 1 indicates that total exports o f n and total imports o f m concerning the commodity k match perfectly. In contrast, when COS is 0, there can be no trade between countries n and m. In this sense, COS index is similar to the correlation coefficient. However, this measure has some non-linearities. Such non-linearities may cause higher variances than S. Therefore, using S is considered to be more appropriate in the context o f the study.
determines the proportion o f the commodity basket o f one exporter which is perfectly matched by that o f the other exporter.
S(n,m ) = Minimum[Xk(lm),Xk(
2
m)]}*100
(3-1) where Xk(nm) is the share o f commodity k in country n’s exports tom
for n=l ,2.S(n,m) index compares the pattern o f exports o f countries «=1,2 across commodity groups in the county
m
market. Therefore, the effects o f relative scale o f total exports are removed. If the value o f country1
’s exports is less than that o f country2
, then it is rescaled so as to equal in total to the value o f country2
’s exports.^After calculating the export similarity indices and determining SEA countries which have similar export patterns with Turkey in the EU m arket, CMSA is conducted in order to decompose structural and competitiveness effects on the market share developments.
AX = X X + T ( X „ , - X ) X + У У ( Х „ , - Х ) X ‘ + У У ( Х ™ - Г ) Гn n V / nm X m / nm v m / ran (3-2)
where X , , X,,^, and are the values o f total world imports, total exports o f country
n,
total imports o f countrym,
total commodityk
imports o f countrym
and^ Suppose there are two exporters 1 and 2 in the market o f country m for the products y and z.
Product Value($) Xk(lni) Value($) Xk(2m)
у
10
0.1
500
0.5
z
90
0.9
500
0.5
Total
100
1.0
1000
1.0
When the exports o f country 1 is rescaled the value o f products 1 and 2 become 100 and 900, respectively. Therefore, 100 US dollars o f Ts exports o f product у are matched by that o f country 2 ’s (10 percent). However, o f the 900 US dollars o f 1 ’s exports o f product z, only 500 US dollars is matched by that o f 2 ’s exports (50 percent). Hence, 600 US dollars or 60 percent o f rescaled exports o f country 1 to country m is matched by country 2 ’s exports to the same market.
commodity
k
imports o f countrym
from countryn,
respectively. * represents the growth rates o f the respective values.The expression in equation (
3
-2
) gives the standard representation o f CMS. It is derived from the equivalence where total exports o f countryn
m III k
denoted by X,, are defined as the sum o f the exports o f country
n
overm
trading partners and A: exported commodities.In this respect, the growth in exports o f a country may be due to four reasons (Lloyd, 1994). i) First, high growth o f world imports forms a potentially larger market for all exporters. However, this potential may or may not be distributed equally among all exporters, ii) Particular export destinations may experience relatively high import growth rates. These are represented in the first and second terms o f equation (3-2). They correspond to world and market term, and reveal how much the export growth o f country n can meet the import demand growth in the world and in particular country m, respectively.
iii) The exporting country may have increased its market share in individual country markets as well. This can stem from two reasons. An importing country may increase its import demand for a commodity from all exporting countries or it may demand that particular commodity from a specific exporter. These effects are represented in the third and fourth terms o f the equation (
3
-2
) which are called the' The derivation o f equation (3-2) is given in Appendix B.
commodity and competitiveness terms, respectively. Both o f them can be interpreted as capturing the supply effects originating from relative price changes. While the commodity term gives the allocation o f commodity
k
imports over all exporting countries, the competitiveness term is country specific. Therefore, the former one is considered as the reaction o f the demand by countrym
to the combined price changes o f all exporters o f commodity k. However, the latter term is the reaction o f the demand to the bilateral price change between countryn
andm
which is referred as the “own supply effect”. The last term is defined as the residual component (Lloyd, 1994). It shows the difference o f the actual export growth o f countryn
from the growth rate which would result if the country had maintained its share for each commodity in each market."Hence, the export growth o f a country is divided into four parts, world terni, market term, commodity term and competitiveness term. These terms can be interpreted as follows. The first two terms are called the “structural terms”. They can be considered as representing demand side effects whereas the changes in commodity term and especially the competitiveness term, which is subject to change by definition, are supply side disturbances.’^ Therefore, relative price changes, i.e., supply side effects, trigger a demand reaction and influence the commodity and competitiveness terms.
" It measures only the competitiveness factors assuming that the trade structures o f markets and commodities are constant.
12 This can be illustrated by an example. Assume that country n exports commodity k to country m and
the market share o f country n in the commodity k market o f country m is to be analyzed. When there is a
change in the price o f commodity k in the domestic market o f country m and/or the price charged by
country /7, the relative prices are disturbed. This would alter the relative competitiveness o f country n in
the market o f m . Therefore, relative price changes, i.e., supply side effects, trigger a demand reaction and
3-2-ii. Identifying the Degree of Price Competitiveness:
After the degree o f competitiveness is identified by CMS analysis, two-stage homothetic demand functions are estimated in order to reveal the degree o f price competitiveness (Merkies and Meer, 1988). They are constrained to two stages with an affordable number o f parameters in each so as to make estimation feasible.'^ First, the import budget is allocated among various products. After finding the optimum level o f imports in each product group, the effects o f bilateral price changes on imports are revealed at the second stage.
At the first stage o f the problem, a constant elasticity o f substitution (CES) type utility function is maximized subject to the import budget XmPm o f country
m
to be allocated between various imported commodities A:=i,j.Max U = A [ p ( E X : ) - + ( l- p ) ( E X l) - r
subject to e x:,P; + e x: P,: = EX„ P„, (3-3) where EX„ is the quantity o f imports o f country
m
and EX:,, EX:, are the quantities o f imports o f countrym
in commodities / andy.The optimum level o f imports o f commodity A;=i, j are given in the equation below:
The derivations o f the functions and their relationship to the CMS analysis are given in Appendix C and D, respectively.
EX'P' = E X P ( l · ' - " .
m 111 111 111 V /
P C(P;)'-‘’ + (P )·-'’ (3-4) where C = and a = *
1 + p
The equation (3-4) can be redefined by letting i=k, EX|^Pj_ = X';, EX^,P„ = X^ and 6" = (P,)"'
c(p: ) '" + (p,:)'— yielding the following demand equation:
X'^ =
6
^Xf
pkP... y
(3-5)
Equation (3-5) gives the resulting demand function from the first stage o f the problem. The optimum level o f expenditure on the imported commodity
k
by countrym
is determined to depend on the value o f total import budget, Xm, the ratio o f the import price index o f commodity
k
to the price level o f countrym
and representing the stable taste pattern o f countrym
concerning commodityk.
Hence, equation (3-5) explains changes in the import budget allocation o f the importing countrym
among various commodities due to relative price changes. It reveals the demand substitution among the imported commodities. Hence, it can be interpreted as the import demand equation o f countrym.
At the second stage, a similar utility function is maximized subject to the budget allocated to the imports o f commodity
k
in the previous stage, between exporters, «=1,2.Max U' = A V ( E X 'J " +(1 -^')(EXL,)'"] "
subject to EX:,„P,1 + EX,^„,P^„, = EX^F (3-6) The optimum level o f commodity
k
imports from country n = l,2 are found to be:EX,*^ P^ = E X 'P ‘Im Im m ni ^P,: (p:)
K j
where _____ ___________ .5 ^ c(P,i)'·"·+(p;, ' + T- o ' , C' = EX^ p; = X^ is defined. p' v l - P ' y (3-7) ' in m mHence, the resulting demand functions take the following form:
X^ = 5^ X^nni ni V y
(3-8)
Equation (3-8), gives the optimum demand o f commodity
k
from the exporting country «=1,2 through the solution o f the second stage. It depends on the optimum level o f expenditure on the imported commodityk
by countrym,
,which is determined at the first stage, the ratio o f the bilateral import price o f commodityk
between countriesn
and
m
to the import price index o f commodityk,
as well as the corresponding stable taste pattern,6
^^. Therefore, equation (3-8) shows the effects o f the relative bilateral price changes on the reiutive value changes o f imports o f countrym
from each exportern
for each commodityk.
Then it can be interpreted as an indicator o f price competitiveness o fthe exporters in the import market o f country
m.
As a consequence, o f the estimated equation can be c'valus':ed as how much o f the total competitiveness can be attributed to price competitiveness.A fixed effects model is used in the panel data estimation o f equations (3-5) and (3-8) (Hisao, 1989, Matyas, 1995). In the panel data estimation, error terms are assumed to be divided into two parts. First part is assumed to vary among individuals and across time independently, fhe second part is constant across time while it varies among cross section variables. Fixed effects model assumes that there is a correlation between the explanatory variables and the second part o f the error term, whereas the random effects model assumes zero correlation. The reason behind the choice o f fixed effects model is that even if the random effects model is valid, the fixed effects estimator still produce consistent estimates o f the identifiable parameters while the reverse is not true. Wu- Hausman test is also applied to test whether the fixed effects model is the true specification.’'*
Equations (3-5) and (3-8) are linearized by taking natural logarithms. Then, the variables are redefined as dA=A(t)-A(t-l) , where and disappear from the expressions. The following equations are estimated by fixed effects model by using Generalized Least Squares (GLS):
The Hausman test is defined as H = - P„, ) - I,,, )"' (P^,, - p,,, ) where RE and FE represents
random and fixed effects, respectively. P is the pooled GLS estimator and E is the covariance matrix o f
the error terms. This statistic is distributed asymptotically as with k degrees o f freedom under the null
that the hypothesis that random effect specification is correct. For a detailed discussion see Johnston and Dinardo (1997), pages 390-405.
x i[< iin (x :.)l= x ; x ‘.[d iii(x i,)]= x :., d ln (X J + ( l - a J d I n l i J j +
8
d i n ( x ; , ) + ( i - < ) d i n iim1
"n J J+
8 (3-9) (3-10)3-2-iii. Identifying the Degree o f Proximity Advantage on Prices:
When the degree o f price competitiveness among exporters is determined, the relative proximity advantage in prices is revealed by analyzing the difference between CIF import and FOB export prices.
OECD database defines import and export prices as inclusive o f cost o f insurance and freight (CIF) and free on board (FOB), respectively. The difference between CIF and FOB prices is the transportation cost as well as the insurance payments. The transportation cost is directly related to the distance between the exporting country and the market in consideration. The behavior o f the insurance cost, on the other hand, may vary according to the policy o f the insurance companies and/or the specification ol ihj commodity. However, the distance variable can indirectly be related to the insurance cost. The insurance cost increases with the level o f risk premium and the risk premium increases in accordance with the country risk o f the destination, duration and form o f the delivery, maturity o f the payment and distance to the
destination.'^ As the destination in this thesis is EU, country risk o f the destination is same for both SEAs and Turkey. The other items both depend on the exporters and the policy o f the insurance company which are definitely subject to deviate across countries. However, the last item is the most objective one that is not subject to change in any circumstance.
Hence, it can be concluded that the distance variable is an important factor in the price competitiveness. Therefore, as the difference between CIF import prices and FOB export prices narrow down, exporters gain relative proximity advantage in the market and this is reflected by relative prices.
For each exporting country
n
in consideration, the difference between import prices, CIF, and export prices, FOB, are calculated for the sample period.D„=/£,(Import price o f country m from country n fo r commodity k, CIF)!/t - ¡L,(Export price o f country n to country m fo r commodity k, FOB)]/t
where t=number o f years in the sample period.
Dn shows the average difference o f import and export prices in the period 1990- 1997 for each market. The exporter
n
who has the smaller D„ is considered to be more advantageous in the market in terms o f proximity.The detailed conditions for trade credit and insurance programs are provided from the Undersecretariat o f Foreign Trade.
Deu for the EU
is
calculated as follows, and the interpretation o f the value is similar to that o f each export destination:In the next chapter, erripirical finding o f the analysis is presented.
CHAPTER 4
EMPIRICAL FINDINGS
4-1 Export Performance of Turkey: A Brief Summary in the 1980s and the 1990s
Before 1980, Turkey was not considered as an exporting country. A planned economy pursued an inward oriented industrialization which mainly concentrated on import substitution o f consumer goods. While in the 1970s, this strategy was extended to intermediate and capital goods, several internal political shocks and external supply shocks limited the development. Hence, economy faced a balance o f payments crisis following an unsustainable external debt in 1979.
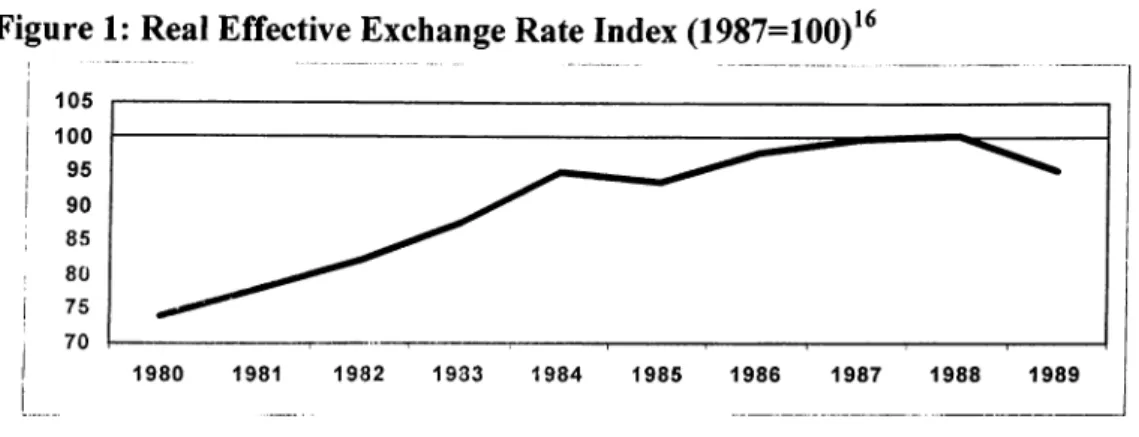
Therefore, a stabilization program was inacted in 1980 which aimed to reduce the public sector share in the economy. Its main objective was to set free market conditions so export promotion was implemented as a part o f the program. Most important policy action in promoting exports was giving substantial export incentives and high real depreciations o f the Turkish lira (Figure 1). At the same time imports were restricted t< - an extent so as not to face another balance o f payments crisis. In addition.
high interest rate in the early 1980s and real wage controls promoted exports further (Figure 2).
Figure 1: Real Effective Exchange Rate Index (1987=100)16
Figure 2: Exports th GNP Ratio in the 1980s
Until the year 1989, exports showed a considerable increase due to utilization o f excess capasity o f the manufacturing sector and with the help o f export promoting policies. Indeed, exports more than tripled during the 1980s (Uygur, 1997, Sayan and Demir 2000).
Increases in the index show real depreciation o f the Turkish Lira (State Planning Organization Database).
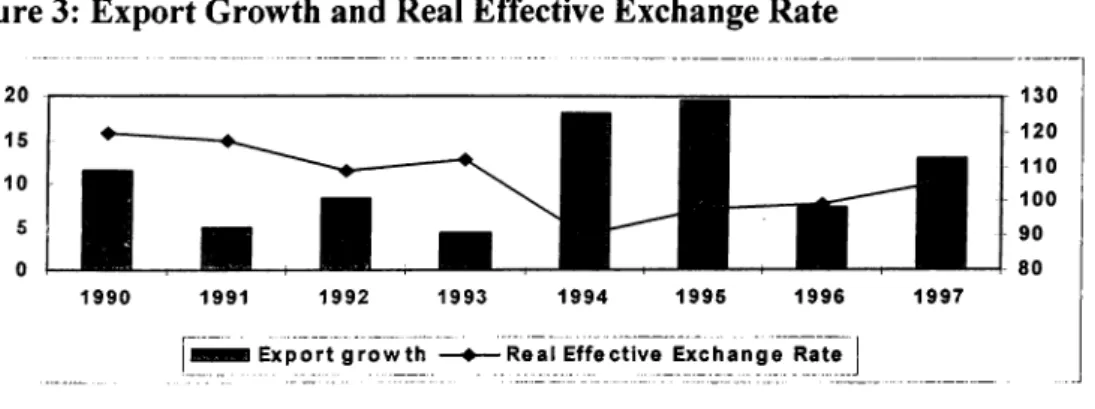
In 1989, all controls over foreign capital movements were removed and Turkish trade entered a new phase thereafter (Kotan and Saygılı, 1999). In addition, subsidies in the agricultural sector and real wage increases in the manufacturing sector expanded the domestic demand considerably. Positive interest spread is kept in order to promote capital inflows and hence, Turkish lira experinced real appreciations. Indeed, a 14.4 percent real appreciation is realized during the period from 1990 to 1993. These developments curbed exports while imports increased which led to high current account deficits. Export growth rate fell from an average o f 12.8 percent in 1980s to 7.2 percent in the 1990-1993 period (Figure 3).
Figure 3: Export Growth and Real Effective Exchange Rate
199 0 1991 1992 1993 199 4 1995 1996 1997
I E x p o r t g r o w t h — ♦ — R e a l E f f e c t iv e E x c h a n g e R a te j
These developments caused sharp inflation and interest rate increases and ended with the financial crisis. After this crisis in 1994, a stabilization program was announced ar,' ’- ■aüstic real exchange rate policy was put into action (Şahinbeyoğlu and Ulaşan,
1999). In other words, the policies aimed to maintain a constant real value o f the Turkish lira after a real depreciation by 14.8 percent in April 1994 which was considered as a correction.'^ Hence, exports expanded to substantially in that year (Figure 3). Both real
This implicit policy aimed to maintain the value o f the exchange rate basket (composed o f 1 US dollar and 1.5 German mark) in line with the realized inflation figures.
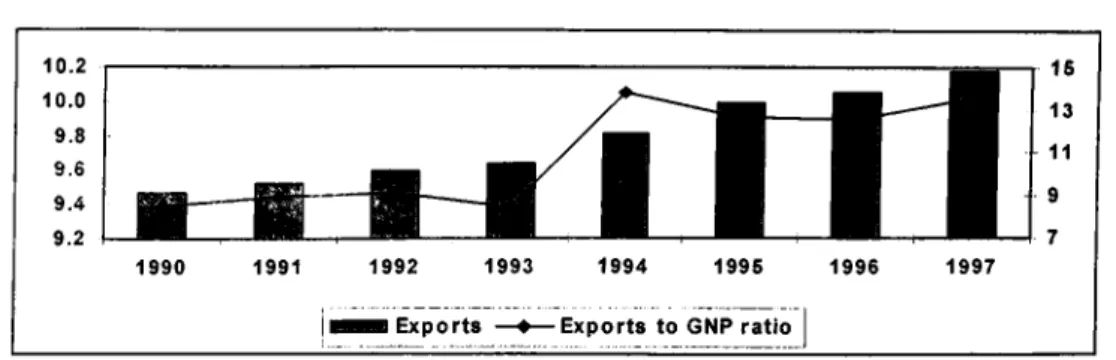
appreciation and real depreciation was prevented by the policies however export growth continued in the second half o f the 1990s. Indeed, the share o f exports in GNP increased considerably (Figure 4). The rate o f the growth o f exports roughly doubled after 1994 which rose from an annual average o f 7.2 percent in 1990-1993 period to 14.5 percent during 1994 to 1997.
Figure 4: Exports to GNP Ratio
10.2 10.0 9.8 9.6 9.4 9.2 w i T T l 1990 1991 1992 1993 1994 1995 1996 1997 E x p o r t s — 4 — E x p o r t s to GNP r atio I 15 13 11
Furthermore, export structure changed in favour o f manufactured products after 1993 (Sayan and Demir, 2000). Growth rate o f manufactured commodities exceeded the average export growth in the second half o f the 1990s. In this respect, the annual average growth rate o f manufacturing exports increased from 7.5 percent to 16.2 percent from the period 1990-1993 to 1994-1997. The export growth o f technology intensive products showed a remarkable progress and tripled during the same period while the growth o f
1
8
textiles and garment exports followed the same pattern with manufactured exports. ExpoTl ^. o f technology intensive products increased from 8.1 percent in 1990 to 1993 to 26.8 percent during 1994-1997 on average, annually (Figure 5).
Textiles and garment constitute a considerable share in Turkish exports, so their growth performance is important for the total. In addition, exports o f technology intensive commodities have an increasing share in the world trade and they significantly contribute to growth (Guerrieri and Milana, 1995) highly tradable and therefore important in a country’s relative export performance to improve a country’s international competitiveness (Daniels, 1999).
Figure 5: Composition of Turkish Exports
i j f ^ T o t a l E x p o r t s ? ^ i W a n u f a c t u r e s • T e x t i l e s a n d G a r m e n t ^ T e c h n o l o g y I n t e n s i v e P r o d u c t s | |
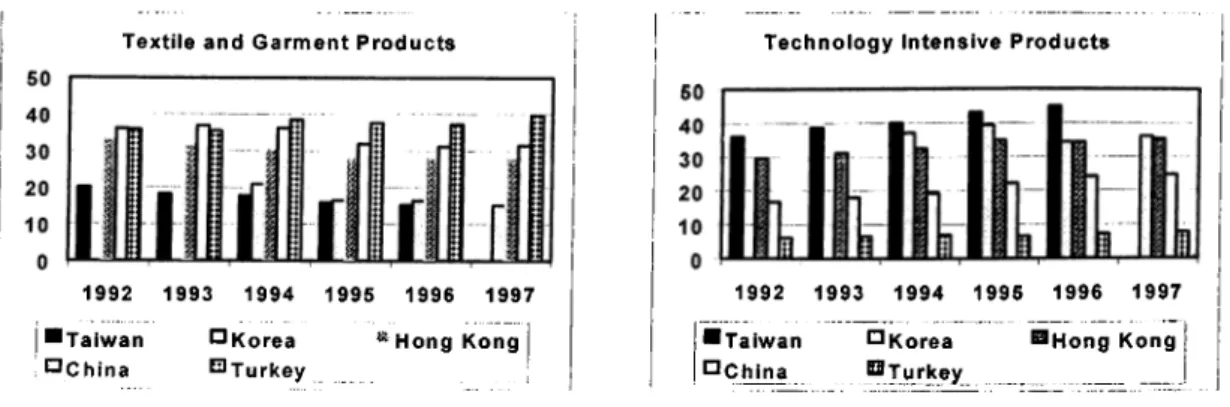
The share o f technology intensive products in the total exports o f Turkey is relatively low when compared to SEAs. These countries have an unusual export pattern specialization. Their technology intensive exports make up the largest share in the world
imports (Noland, 1997). Still, overwhelming performance o f the Turkish exporters can
be seen from revealed comperative advantage o f Turkey in the exportation o f these products (Daniels, 1999).'^
Revealed comparative advantage (RCA) in exports is calculated as follows: RCA=(Xj/all exportSj)/(SjX/2:jtotal exports), where j is the individual country and X is the value o f high-tech exports. Increasing RCA implies increased relative comparative advantage in exportation (Daniels, 1999).
1992 Turkey 0.339 Hong Kong 1.082 China 0.650 Korea Taiwan 1.364 1993 0.307 1.088 0.644 - 1.364 1994 0.309 1.012 0.616 1.318 1.282 1995 0.337 0 973 0.665 1.300 1.271 1996 0.386 0.959 0.705 1.253 1.297 1997 0.421 1.051 0.766 1.355
-m e calculations snow tnai nong IS -U iig a n u . a i v y a n l u o t g i v / u i i u w .w J . V . . . «
-considered while Turkey gains revealed comparative advantage in high-tech exports although it is still considerably low compared to SEAs.
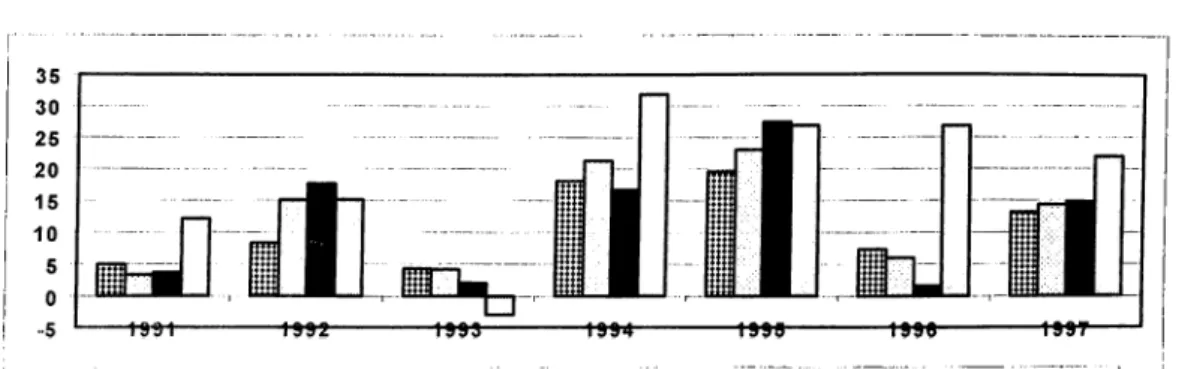
Figure 6: Comparing Sub-Sectors of Turkish Manufactures with that of SEAs
Textile and G a r m e n t P r o d u c t s 1992 1993 1994 1995 1996 1997 ^ Hong KongI
I " T a i w a n ï^Chlna i^Korea •^Turkey T e c h n o l o g y In ten siv e P r o d u c t s 1992 1993 19 94 1995 1996 1997 ■ T a i w a n ^ K o r e a H H o n g Kong D C hina ^ T urk e y _ ____Although Turkish manufacturing exports grew considerably and experienced a structural shift, it became highly commodity and market dependent. Especially after 1989, textiles, garment, iron and steel products gained remarkable shares in total exports and comprise o f 50 percent o f the total on average. In addition, Turkey’s exports to EU comprise o f 53 percent o f total exports on historical average in which Germany, itself, has an average o f 20 percent share in the total exports. Hence, the export structure is defined to be excessively concentrated (Undersecretariat o f Foreign Trade, 1998).
As a consequence, relatively lower import demand o f world and especially important export destinations may have more adverse effects on the Turkish export performance. Turkey can not improove its export performance or even face a decreasing market share although it maintains its position in eveiy product and every export destination (Lloyd, 1994). Furthermore, relative price movements may have adverse influences on the export performance.
The remaining part o f this chapter provides the results o f the analysis o f Turkish export performance relative to that o f South East Asian countries. The main emphasis
will be on the two product groups: textiles and garment and technology intensive commodities.
4-2. Constant Market Share Analysis:
First, the export similarity indices are calculated in order to compare the market share developments of Turkey and SEAs in the EU market and further to decompose the level o f competitiveness. Then CMSA is conducted for two product groups, namely textiles and garments and technology intensive products.
4-2.i Export Similarities
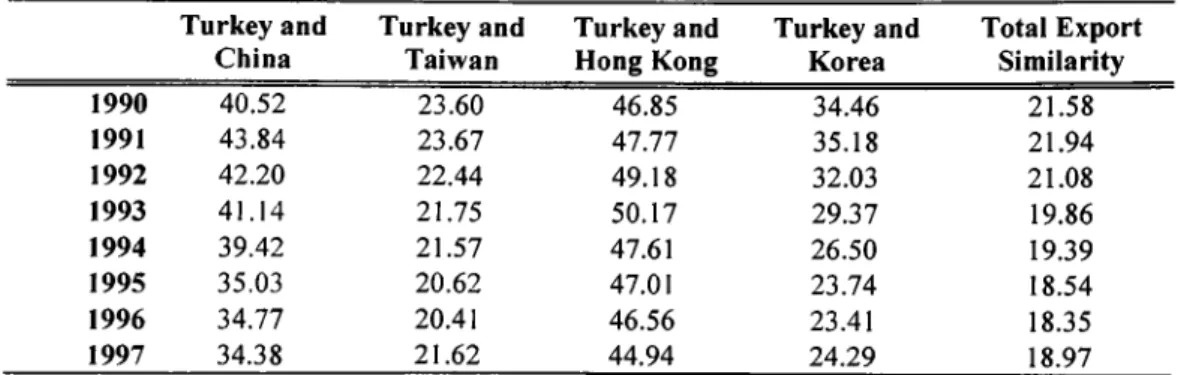
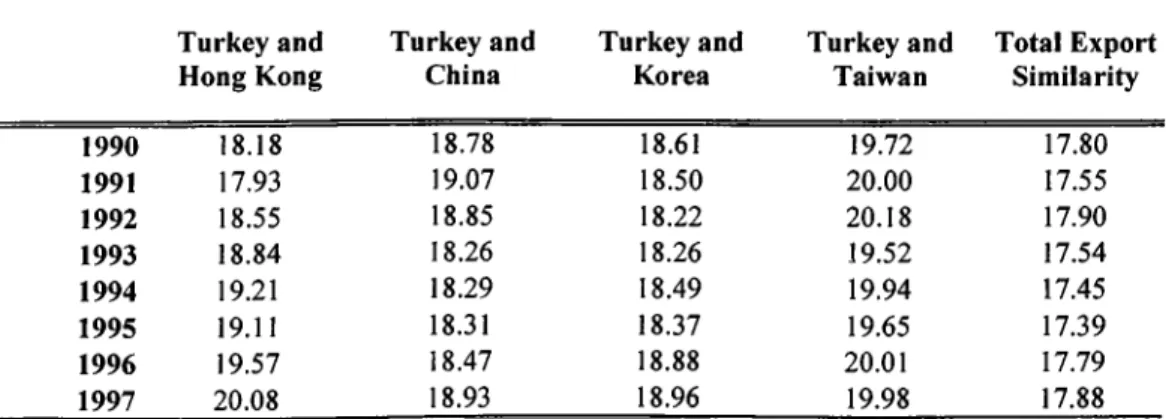
Export similarity o f Turkey and SEAs in the EU market for the two product groups, traditional exports and technology intensive exports, are calculated for the period 1990-1997. An index value o f X implies that X percent o f exports o f country 1 to the EU market is matched by that o f country 2. The index value around 50 and above is considered to be an acceptable value o f export similarity (Finger and Kreinin, 1979).
Traditional exports are defined to be the aggregation o f iron and steel products and textiles and garment. However, when the export similarity indices are calculated separately, it is observed that iron and steel exports o f Turkey and SEAs show almost no
similarity in the EU market (see Table 1, panel a). Hence, from this point onwards, the analysis o f traditional exports will be based on textiles and garment products.
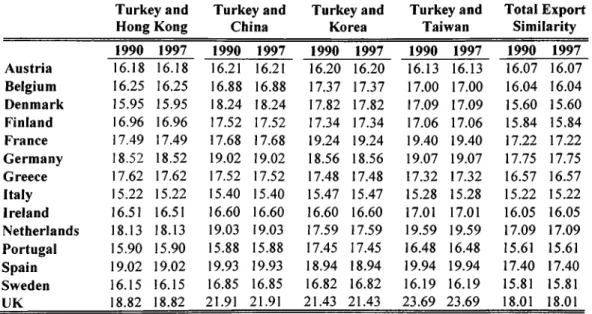
The summary results for each product group are presented in tables 1 and 2, respectively. Panel (a) o f each table gives the extend o f common tendency o f Turkish and SEA exports in the EU market throughout the period mentioned above. Panel (b) presents the summary results for the years 1990 and 1997 in the market o f each EU member.
Turkey exhibits the highest degree o f export similarity with Hong Kong and China concerning the traditional exports. Export similarity between Turkey and Hong Kong is 47.5 percent on average and does not deviate from this average significantly in the 1990-1997 period. Export similarity o f Turkey and Hong Kong, on the other hand, gradually decreased from 40.5 percent in 1990 to 34.4 percent in 1997 which is the similar case for Korea and Taiwan as well (see Table 1, panel a).
The situation is more explicit when the export pattern o f Turkey concerning the traditional exports is compared to that o f the SEAs in the market o f each EU member. Germany, France, UK, Sweden and Italy are the most important trade partners o f Turkey. The export similarity o f Turkey with Hong Kong stayed almost the same for the aforementioned export destinations from 1990 to 1997 while similarity with China deteriorated. On the contrary, export similarity o f Turkey and Korea significantly worsened in these markets from 1990 to 1997 (see Table 1, panel b).