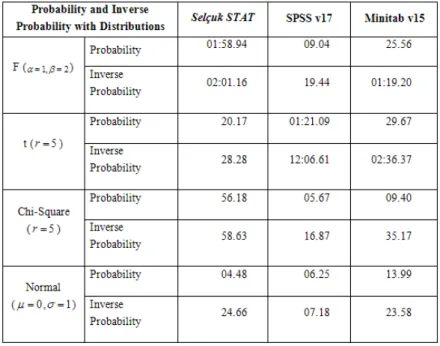
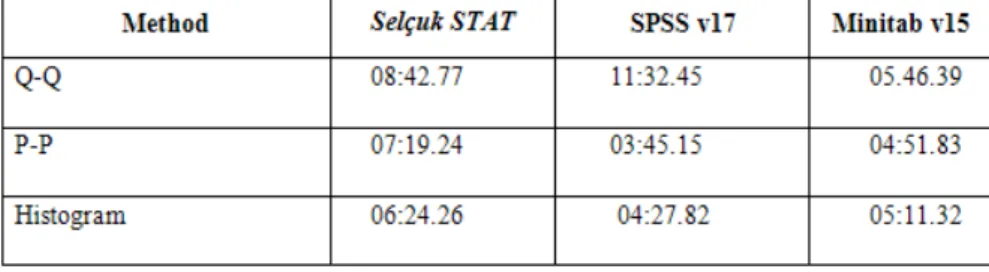
Selcuk Stat with statistical calculations and performance evaluation
Tam metin
Şekil
Benzer Belgeler
Bu rüzgârın kaynağı, Güneş’in çok sıcak olan ve bu nedenle içindeki atomların (+) elektrik yüklü protonlara ve (-) elektrik yüklü elektronlara ayrış- tığı
Ben de geçen hafta aynı konuda şunu yazmışım: "Ali ve Aytaç diyebilirler ki, biz sansüre karşı çıkmak için buradayız..
Bciylece bu ternalan iqleyen filmlerin ortaya grktftlarr gortiliiyor (aralarurdan golu iilkenirr iiniversitelerinde biiytik gristeriler di.izenliyordu) : The Strawberry
Gereç ve Yöntem: Yenido¤an servisimize yat›r›lan 20 respiratuar distress sendromlu (çal›flma grubu) ve 20 solunum s›k›nt›s› olmayan (kon- trol grubu) preterm
Our aim is to examine the change in the quantifiable features of a language. In this particular case, our focus is Turkish. We designed the experiments for both tokens and types.
We show that Nowak’s conjecture is true for a class of spaces defined by a certain condition on the distance function.. The main result is
The numerical values of histopathological findings that include hyaline membrane, congestion, alveolar edema, alveolar macrophage, type 2 cellular hyperplasia,
American Foulbrood causative agent Paenibacillus larvae and European Foulbrood causative agent Melissococcus plutonius were not detected in any sample examined by PCR and
