A New Detection Method for Capacitive Micromachined Ultrasonic
Transducers
Deparrment of Electrical and Electronics Engincering ('Dcpartmcnt of Physics), Bilkcnt Univcrsit] A.
San11 Ergun, Burak
Tcmclkuran', EkmelOzbay',
and Abdullah
AtalarBilkcnt, Ankara,
06533
TURKEY
transducers (cMUT) have become an alternative
A b d m c l - Capacitive micromachined ultrasonic to piezoelectric transducers in the past few years.
They usually consist of many small membranes all
in parallel. In this work w e report a new detec- branes in the form of an artificial transmission line tion method for cMUT's. We arrange the mem-
by inserting small inductances between t h e mem-
branes. The vibrations of the membranes modu- which is proportional to the total capacitance and late the electrical length of the transmission line, the frequency of the signal through it. By measur- ing the electrical length of the artificial line a t a
RF frequency in the GHz range, the vibrations of
the membranes can be detected in a very sensitive manner. For the detector structure we considered
a minimum detectable displacement in the order of
lo-'
A/&
is expected.transducers, ultrasonic detection, displacement
Keywords- Capacitive micromachined ultrasonic sensing
N
I . INTRODUCTION
ON-CONTACT air-coupled ultrasonic measnre- ments and nondestructive evaluation are attrac- tive because of their non-contact nature and the short
silicon capacitive micromachined ultrasonic transduc- wavelengths of ultrasound in air. In the past few years
ers became an alternative to conventional piezoelec- tric transducers in NDE applications [l], [Z]. Using the standard silicon processes developed in the past
30 years, along with micromachining technology, sci- entists developed reliable, small, and cheap transduc- ers and transducer arrays with comparable perfor- mance 131, 141. These capacitive transducers consist oi' many circular membranes in parallel. and are used
for both generation and detection of ultrasound. The cross-sectional view of a typical membrane is shown in Figure 1.
parallel plate capacitor. The detection of ultrasound The electrode and the substrate make up a simple
depends on the vibration of the membrane due to an
incident ultrasonic signal. The displacement of the membrane results in a capacitance change which is
Membrane
n+
Si substrateFig. 1. Cross-section of a typical membrane
bias voltage. The magnitude of the current resulting measured by monitoring the current under a constant
from n parallel membranes can he expressed as.
where f l is the ultrasound frequency, Vd, is the bias voltage,
C is the capacitance of a single membrane.
x0 is the spacing between the electrode and the snb- strate. and Ax is the magnitude of the displacement. The resulting current is then amplified with a tran- simpedance amplifier.The disadvantages of the conventional detection method are the large detector area needed to achieve good sensitivity, the dependence of the output current on the ultrasound frequency, which degrades the sen- sitivity at low frequencies, and the large DC voltage
to detect the displacement of a membrane in a n o r e used. In this work we propose an alternative method
sensitive manner.
11. THE NEW METHOD
The new detection method involves the use of a high frequency
RF
signal as the probing signal in- stead of theDC
bias voltage. In this method, the membranes are connected through inductors t,o makesection artificial transmission line consists of n shunt up an artificial transmission line (Figure 2). An 7%-
capacitors
[C)
linked through inductors ( L ) . Disre- garding the losses, the characteristic impedance (Za). and the propagation constant(B)
are given byz,
=&
Membranes
(top
view)U2
L
L
U 2-
p p
-
-
5Fig 2. Layout and schematics of a 3-section artificial
transmission line.
~ t T a n S m l S S l 0 ” h e
t‘ig. 3. The Interferometric scheme to detect ultrasound.
where f o is the RF frequency, and
p
is in units ofradlsection. The inductors are designed such that
the characteristic impedance of the line is around 50 to prevent reflections.
characteristic impedance and the electrical length
A capacitance change results in a change in the
small capacitance variations the change in the char-
( Q 0 = no) of the artificial transmission line. For
acteristic inrpedance is negligible, whereas the change in the electrical length can he significant depending on n and
f ~ .
Ver,y small capacitance variations can he detected by measuring the electrical length of the artificial transmission line a t a high RF frequency. Anmembranes, and changes their capacitance. This re- incident ultrasound signal of frequency f l vibrates the
sults in the phase-modulation of the RF signal trans- mitted through the artificial line. The ultrasound sig-
R F signal. One obvious way to do this is to use an in- nal can be extracted by demodulating the trammitted
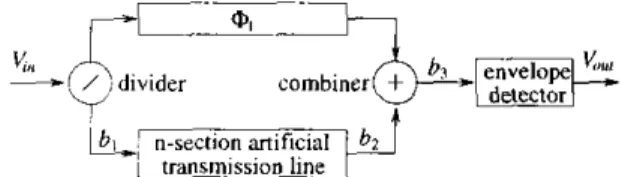
terferometric method. The interferometer translates the phase-modulation into an amplitude-modulation. Subsequent envelope detection and amplification re- solves the ultrasound signal (Figure 3).
For small capacitance variations phase modulation
€ig. 4. The dow-conversion scheme to detect ultrasoutld.
is equivalent to amplit,ude modulation. Therefore, the spectrum of the transnlit.ted signal contains a main signal at j o > and sidebands at f o
+
fl. Thus; the ul- trasound signal that vibrates the membranes cat1 be obtained hy down-converting the output of the artifi- cial transmission line (Figure 4 ) .A . Mathematical Formulation
Assume an input of V,,.sin[2nf0t). Then. Ihe transmitted signal is
V, = Vfly sin(2Tjot - - A Q ( t ) ) (4)
where
A @ ( t )
is the time varying component of tile p h a e . By assuming a very small membrane vibration of A.zsin(2nflt) one can determineax
:Lo
A + ( t ) = ~ ~ ( ~ ~ . 2 n f ~ C ) Z , - s s l n ( 2 ? r f l t ) ( 5 )
wherc :zo is the membrane separation from the ground. For A:,:
<<
‘I:” equat.ion 4 can be expanded as1 2
L/’
! - ~L,’,{,,
s i n ( 2 n f o f - ?’c,) -a a ( t ) V ~ ~ ,
cos[2rrfot -ao)
( 6 )
By unnhining equations 5 and 6 . we obtain the output signal. It cont,ains a carrier signal at
fa
and sidebands at J O*
fl. The maguit,ude of the signal at the side-bands [in terms of cnrrent fur a better comparison)
ference of our method clearly. T h e DC bias voltage Comparison of equations 1 and 7 shows the dif-
(which is usually large) in the conventional method
method. The reduction in voltage magnitude is com-
is replaced by a few volts of RF amplitude in our
pensated with the replacement of the ultrasound fre- quency f l by the RF frequeucy f o . Considering a n ultrasound frequency in the MHz range, and an RF
signal in the GHz range. considerable improvement in the sensitivity over the conventional method is possi- ble. For applications which involve lower ult,rasound frequencies or audio frequencies, the improvement car1 be even higher.
B. Effect of the Loss
sound makes the loss analysis an important issue. be- The use of a n RF signal i n the detection of ultra-
cause it is the loss that sets limits on the sensitivity. There are two basic loss rnecharlisms in an artificial transmission line. One of them is the substrate losses which is modeled as a resistance, R I : in parallel with
the capacitance. The other one is the metallization loss which is modeled as a resistance, r2, in series with the inductors. Using this loss model the attenuation constant of the artificial transmission line can he ob- tained as
where p2 and
R ,
values can he obtained through elec-tromagnetic simulations.
plicated its inclusion is very simple. The attenuation Although the calculation of the loss is quite com-
term, e-"? comes as a scaling factor to the expres- sion in equation 7, and 1 Ja gives the optimum n value beyond which the sensitivity drops with increasing n.
111. EXPERIMENTS
.4. Device Fabncotion
To verify the method we fabricated devices both
on Si and GaAs using surface micromachining tech- niques. Because of the low resistivity of the Si sub- strate devices fabricated on Si did not work well at
sections of high impedance transmission lines t o make high R F frequencies. We used air-bridges, and short
an artificial line (Figures 5 and 6). Because of the sim- ple fabricat,ion process we preferred to use air-bridges instead of membranes as the first phase of the work. A short description of the process is given in [5].
\ substrate
Fig. 5. Oblique vieTV of an artificial transmission line sec- tion
.B. Mechanzcal Properties of Air-bridges
An air-bridge is a plate clamped at both ends. The width of the bridge is usually much larger than its thickness. Then, we can assume that the plate is in- finite along the width, and solve the two-dimensional problem. In two-dimensions the plate reduces to a bar clamped at both ends [6]. Then the expression for the mechanical resonance is,
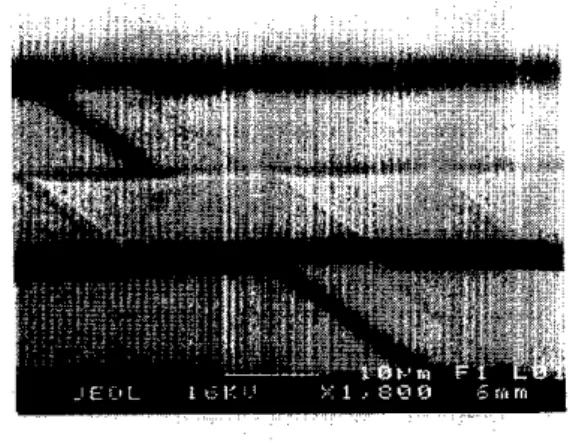
Fig. G. SEM photograph of an artificial transmission line
section
where Q is the Young's modulus, and p is the density of the bridge material.
,On
are the constants with the values 01= 1.5056,02
= 2.4997, and0,
= n+
0.5.We used aluminunl as the bridge material which have been shown t o have very good mechanical prop- erties [7], at least suitable for this kind of application. Using the material properties of AI. and geometrical considerations we designed the bridges to resonate in the MHz range ( 2 MHz for a bridge length of 50 wm and bridge thickness of 1 pm).
C. The Experiment Setup
We have done two basic experiments: detection and excitation experiments. In the detection experi- ment we mounted the sample on a piezoelectric source, and measured the bridge vibrations by rnonit,oring t,he transmitted RF signal with a spectrum analyzer. This measurement is a good verification of the method, but does not provide good information about the mechan- ical properties of the bridges, because of the mechan- ical response of the piezoelectric source. In the exci- tation experiment, the sample is excited electrostati- cally with a signal in the MHz range which vibrates the bridges. At the same time it is probed with a
RF signal in the GHz range. These two signals are combined and separated with biac-T's. Thus, the si- multaneous excitation and measurement of the sample is done.
D.
Experiment Resultsiments done on the GaAs sample for varions bridge Figure 7 shows the results of the excitation exper-
lengths. The RF signal frequency and power are 4.65 GHz and 10 mW, respectively. The mechanical res-
onance of the bridges occurred a t higher frequencies
material parameter. On the other hand, the shift in than we expected, probably due to some inaccurate
the resonance frequency with changing bridge length is observed clearly. The mechanical-Q of the bridges turned out to be moderately low.
Fig. 7. GaAs sample : The output power measured as a
function of the ultrasound frequency
We have also performed detection experiments on
constant and varied the RF signal frequency. As ex- the same device. We kept the ultrasound frequency
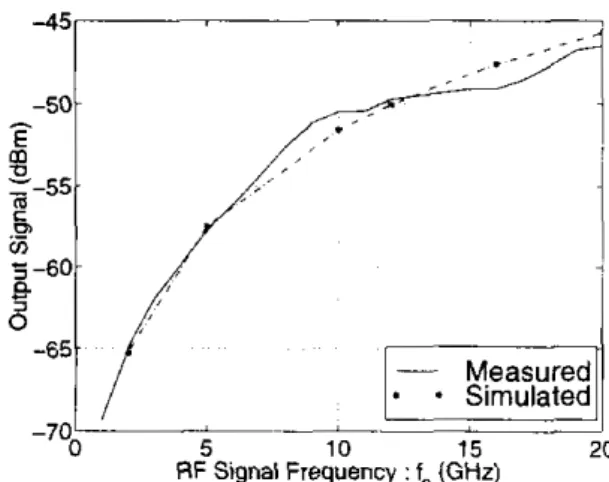
pected the sensitivity increases with frequency. The losses begin tu effect near 20 GHz, and the optimum frequency where the sensitivity is maximized occurs above 20 GHz. The plot of the measurement results are shown in Figure 8 together with a simulation result for a AZ value (40 A)that hest fits the measurement results. Comparing the output signal power with the thermal noise power we obtain a minimum detectable displacement of
-
4 x I O V 5 . & / a . Note that the detector contains only 22 sections.IV. CONCLUSION
micromachined ultrasonic transducers. The derived We have introduced a new detection method for
expressions for the sensitivity of the new method sug- gests a considerable improvement over the conven- tional detection method. T h e improvement is even higher for low ultrasound frequencies, because this method also eliminates the dependence of the detected signal on the ultrasound frequency. According to the simulation and measurement results we see that a dis-
placement sensitivity in the order of lo-'
.&/a
is achievable by further decreasing ZO, and increasing nand
fo.
The enhanced sensitivity in this method gives4 5 ,
7
1
,4
--700 -_i
5 10 15
RF Signal Frequency : fo (GHz) 20
Fig. 8. GaAs sample : The measured data and the simu-
lated data for Az = 40 4.
us a flexibility in choosing our detector size. Since cun- siderable sensitivity can be achieved in a small area, this method can make the fabrication of detector ar- rays easier.
REFERENCES
[l] M . I. Haller and B T. Khuri-Yakub, "4 Surface Micro- machined Electrostatic Ultrasonic 4ir Transducer," IEEE
Ultrosonzes Sympoatvm rroceedtn,p, pp. 1241-1244, 1994 [2] D. W . Schlndel, U. .4. Huwhins, L. Zou, and bl. Sayer,
"The Design and Characterization of Micromachined 4ir- coupled Capacitance Transducers," IEEE Transacttons on
Ultrosonzcs, Ferroelectrics, and Frequency Control, vol. 42,
131 I. Ladabaum. B. T. Khuri-Y-akub, and D. Soolianskv. "Mi- pp. 42-50, 1995.
. .
..
,cromachined Ultrasonic nansducers: 11.4 MHz Transmis-
sion in Air and More," Applied Physics Letters, vol. 68, pp. 7-9, 1995.
[4] U. W. Schhdel and D. A. Hutchins, "Applications of M-
crornachined Capacltarlce Transducers in Air-coupled Ultra- sonics and Nondestructive Evaluation," IEEE Tvansoctiuns 42, pp. 51-58, 1995.
on Ultrasonics, Ferroelectrics, and R e q u e n c y Control, vul.
[5] A . S. Ergun, 4 . Atalar, B . Ternelkuran, and E. Oabay,
lhnsducers," Applzed Phyatcs Letters, vol. 72, pp. 2957- " 4 Sensitive Detection Method For Capacitive Ultrasonic
161 l? M. Morse and K . U Ingard, Theoretzcal Acoustica,
2959, 1998.
[7] C. Goldsmith, J. Randall, S. Eshelman, T. H. Lin, Dennis- Princeton University Press, Princeton, 1968.
ton D., Chen S., and Yorvell B., "Characteristics of M-
cromachined Switches at Microwave Frequencies," IEEE
MTT-S Digest, pp. 1141-1144, 1995.