L1 NORM BASED MULTIPLICATION-FREE COSINE SIMILARITY MEASURES FOR BIG DATA ANALYSIS Cem Emre Akbas, Alican Bozkurt, Musa Tunc Arslan, Huseyin Aslanoglu, A. Enis Cetin
Department of Electrical and Electronic Engineering Bilkent University, 06800 Bilkent, Ankara, Turkey
[email protected], [email protected], [email protected], [email protected], [email protected]
ABSTRACT
The cosine similarity measure is widely used in big data analysis to compare vectors. In this article a new set of vector similarity measures are proposed. New vector similarity measures are based on a multiplication-free operator which requires only additions and sign operations. A vector ’product’ using the multiplication-free operator is also defined. The new vector product induces the `1-norm. As a result, new cosine measure-like similarity measures are normalized by the `1-norms of the vectors. They can be computed using the MapReduce framework. Simulation examples are presented.
Index Terms— Multiplication-free operator, cosine similarity, big data, MapReduce.
1. INTRODUCTION
The cosine similarity between two vectors is computed using the in-ner product of two vectors divided by the `2-norms of the vectors. It is widely used in big data analysis [1, 2]. In this article, a set of low-power vector similarity measures are proposed to compare large vectors. The new measures are low-power measures because they can be computed without performing any multiplications. In C++, 1 million addition operations take 18 milliseconds, while 1 million multiplication operations take 25 milliseconds on AMD Phenom II X6 1090T Processor. Computing infrastructures should be as low power as possible to make big data analysis as economical as possi-ble [3].
Regular cosine similarity measure is based on multiplication as shown in (1).
cos(x, y) = < x · y > kx1k2· ky1k2
, (1)
The goal of this paper is to reduce the number of multiplications as much as possible.
We recently introduced a new multiplication-free vector product [4–8] . It is based on an additive operator. Let a and b be two real numbers. The new operator is defined as follows:
a b = sign(a × b) · (|a| + |b|), (2) where sign(a × b) = 1, if a · b > 0, 0, if a · b = 0, −1, if a · b < 0. (3)
The operator is basically a summation operation. However, the sign of the result of a b is the same as a × b. Therefore, the operator behaves like the multiplication operation.
We define a new ”vector product” of two N-dimensional vectors x1and x2in RNas follows: < x1 x2>= N X i=1 x1(i) x2(i), (4)
where x1(i) and x2(i) are the i-th entries of the vectors x1 and x2,
respectively. Notice that the vector product of a vector x with itself reduces to a scaled l1norm of x as follows:
< x x >= N X i=1 x(i) x(i) = 2 N X i=1 |x(i)| = 2||x||1. (5)
Other related vector products are defined in Seciton 4.
Organization of the paper is as follows. The `1 norm based new multiplication-free cosine similarity measures are defined in Sec-tion 2. Properties of these new vector comparison measures are dis-cussed in Section 3. In Section 4, hash function generation using the multiplication-free operators is described. In Section 5, simulation examples are presented. In Section 6, conclusions are drawn.
2. SIMILARITY MEASURE DEFINITIONS
Based on the new vector product, we define several vector similarity measures between the two vectors x and y as follows:
c1(x, y) ,
< x y > kxk1+ kyk1
, (6)
where kxk1and kyk1 are the `1 norms of vectors x and y,
respec-tively. Similar to the ordinary cosine similarity measure, the numer-ator contains the vector product of the two vectors and the vector product is normalized by the sum of the `1norms of the two vectors
x and y. When x = y, c1(x, y) = 1 because < x x > = 2kxk1.
It is also possible to define other related measures using relation operators: c2(x, y) , N P i=1 sign(xi× yi) · max(|xi|, |yi|) (kxk1+ kyk1)/2 , (7)
where sign(xi × yi) is defined as in (3) and the vectors x =
[x1, x2, ..., xN]T and y = [y1, y2, ... , yN], respectively.. A
re-lated third cosine similarity measure is defined as follows:
c3(x, y) , N P i=1 sign(xi× yi) · min(|xi|, |yi|) (kxk1+ kyk1)/2 (8) 978-1-4799-7971-4/14/$31.00 ©2014 IEEE
where the maximum operation in (7) is replaced by the minimum operation. The similarity measure c1 can also be normalized in a
different manner as follows:
c4(x, y) , N P i=1 sign(xi× yi) · (|xi| + |yi|) 2 · N P i=1 max(|xi|, |yi|) (9)
Clearly, when x = y, c4(x, x) = 1. Similarly, c2and c3can also
be normalized as in c4.
In all similarity measures defined (6 - 9), the term sign(xi× yi)
is common and provides the correlation information between the two vectors x and y. As a result, the computational complexity and power consumption due to signal analysis can be decreased significantly.
Obviously, c1(x, y) = c1(y, x) in all three definitions [7–10].
Also, when x=y, they all produce the same result, i.e., c1(x, y) =
c2(x, y) = c3(x, y) = c4(x, y) = 1. Multiplication requires more
power than addition and relational max or min operations. Since all three measures can be computed without performing any multiplica-tions, they are all low-power vector similarity measures.
3. PROPERTIES OF NEW VECTOR COMPARISON MEASURES
It is easy to show that
− 1 ≤ c1(x, y) ≤ 1, (10)
Therefore, a vector similarity measure similar to the ordinary cosine similarity measure can be defined using Definition (6). As pointed out in Section I, when x = y, new similarity measures are all equal to 1: c1(x, x) = 2kxk kxk + kxk = 1, (11) and c2(x, x) = c3(x, x) = c4(x, x) = kxk kxk= 1 (12)
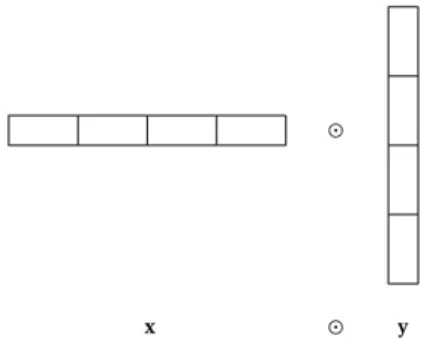
It is possible to compute the new cosine similarity measures when the vectors x and y are big in size so that they do not fit in their entirety in the main memory of a computer. We can divide big vectors into stripes of equal width so that each portion of the vectors can fit into the main memory at a compute node in a cloud as shown in Figure 1.
Therefore, each Map task can be assigned a chunk of the ”vector product” operation. The Map and Reduce tasks can then compute the vector product.
A related vector similarity measure defined by Kleinberg and Tardos [9, 10] is given by:
sim(x, y) = N P i=1 min(xi, yi) N P i=1 max(xi, yi) , (13)
Fig. 1. Vector Product in MapReduce
Equation (13) cannot handle vectors with negative entries. When x or y is equal to an all zero vector, sim(x, y) becomes
sim(x, 0) = N P i=1 min(xi, 0) N P i=1 max(xi, 0) = 1, (14)
which is not a desirable result. The measure sim(x, y) may deviate significantly from the cosine similarity measure for some x, y pairs. Even if the vectors in a database contain only positive entries, it may be advantageous to subtract the means of the vectors from the vectors. It may be advantageous to compute the similarity on zero mean vectors as pointed out in [1]. The similarity measure defined in (6) is not useful when the entries of the vectors x and y are all positive or all (negative). In this case the measure produces +1 for all vectors with positive values. Therefore, means of the vectors must be removed for meaningful results to use c1 properly. Other
measures c2, c3and c4can produce good similarity results for both
non-negative and real valued vectors.
4. RANDOM HYPERPLANE BASED HASH FUNCTIONS BASED ON THE MULTIPLICATION-FREE VECTOR
PRODUCT
Hash functions are a computationally efficient way to reduce the computational cost of big data analysis. Hash functions can reduce the dimension of the vectors. As a result, they reduce the computa-tional cost of big data analysis. Due to large number of dimensions in big data problems, it is not practical to process the data as it is.
We define a family of hash functions given for a given set of vectors ui, i = 1, 2, ..., L in RN as follows. We generate M
ran-dom vectors, r1, r2, ..., rMwhose entries are drawn from i.i.d.,
zero-mean Gaussian distributions with variance σ. Each random vector rj, j = 1, 2, ..., M represents a hyperplane. For each random vector
rjand a given vector ui, we define a hash function hras follows:
hr(ui) =
(
1, if < r ui> ≥ 0
0, if < r ui> < 0
(15)
Results of hrj(ui), j = 1, 2, ..., M are concatenated to con-struct an M -bit hash vector [11]. It is also possible to define new
vector products and use them to construct hash functions in this arti-cle based on maximum and minimum operations as follows:
< x ⊕ y >= N X i=1 sign(xi× yi) · max(|xi|, |yi|) (16) and < x y >= N X i=1 sign(xi× yi) · min(|xi|, |yi|) (17)
The proposed vector products and cosine similarity measures are applied to hash vectors and the data can be classified using a k-nearest neighbor classifier. Simulation examples are presented in the next section.
5. EXPERIMENTAL RESULTS
The Gesture Phase Segmentation data set [12] was made available by UC Irvine Machine Learning Repository. The data set contains 5 classes and 1747 gesture phase data each having 18 attributes. In this paper, simulations are carried out using the first two classes (202 in-stances), the first three classes (900 instances) and the whole dataset (1747 instances).
In all simulation studies that use the Gesture Segmentation Dataset (Table: 1 - 6), we have a leave-one-out strategy. The size of the test set is one and the training set contains the remaining data. The test set is circulated to cover all instances. 1-nearest neighbor classification is done using c1, c2, c3, c4and cosine similarity
mea-sures. Classification accuracies for the two class data is given in Table 1.
Table 1. Classification accuracies (Percentage) for the 2 class 1-nearest neighbor classification with 6 different similarity measures. The last row is the ordinary cosine similarity measure.
Similarity Measure Classification Accuracy Classification Accuracy with Zero-Mean Vectors
c1 80.2 84.2 c2 15.8 84.7 c3 98.5 98.5 c4 98.5 99.0 sim 92.8 94.5 cosine 98.0 97.5
As shown in Table 1, using zero-mean input vectors improves classification accuracies as compared to the classification accuracies with standard input vectors. In this case, c1, c2and sim similarity
measures classify the two class data worse than the ordinary cosine similarity measure. However, c3 and c4 similarity measures
out-perform the cosine similarity measure with both standard and zero-mean input vectors.
1-nearest neighbor classification accuracies for the three class data is given in Table 2.
Three class 1-nearest neighbor classification accuracies are sim-ilar to the previous case as shown in Table 2. c1, c2and sim
similar-ity measures fail to classify the data. However, c3and c4similarity
measures classify the data better than the cosine similarity measure. As shown in Table 3, the five class 1-nearest neighbor classifica-tion accuracies are similar to the two and three class case. c1, c2and
Table 2. Classification accuracies (Percentage) for the 3 class 1-nearest neighbor classification with 6 different similarity measures. The last row is the ordinary cosine similarity measure.
Similarity Measure Classification Accuracy Classification Accuracy with Zero-Mean Vectors
c1 5.4 28.8 c2 1.9 21.8 c3 97.9 97.8 c4 97.9 97.8 sim 85.9 87.6 cosine 97.3 97.1
Table 3. Classification accuracies (Percentage) for the 5 class 1-nearest neighbor classification with 6 different similarity measures. The last row is the ordinary cosine similarity measure.
Similarity Measure Classification Accuracy Classification Accuracy with Zero-Mean Vectors
c1 5.9 21.6 c2 30.6 33.3 c3 94.8 93.8 c4 94.8 93.7 sim 68.8 69.9 cosine 92.7 92.2
sim similarity measures classify the data worse than the cosine sim-ilarity measure. However, c3and c4 similarity measures produces
better results than the cosine similarity measure in this dataset.
Table 4. Classification accuracies (Percentage) for the 2 class 2-nearest neighbor classification with 6 different similarity measures. The last row is the ordinary cosine similarity measure.
Similarity Measure Classification Accuracy Classification Accuracy with Zero-Mean Vectors
c1 81.2 84.2 c2 15.8 84.7 c3 97.5 98.0 c4 97.6 98.0 sim 97.3 94.8 cosine 97.1 97.5
Two class 2-nearest neighbor classification accuracies are shown in Table 4. For c1, c2, c3, c4and cosine similarity measures,
classi-fication accuracies are almost the same as in 1-nearest neighbor case (Table 1). However, sim similarity measure classifies the data better in 2-nearest neighbor case than in 1-nearest neighbor case.
As shown in Table 5, hashing is applied to the input vectors be-fore classification. Since hash function uses random Gaussian num-bers to hash the data, classification accuracies are clearly worse than no-hashing cases. In this case, c2and sim similarity measures
clas-sify the data worse than the cosine similarity measure and c1, c3and
c4similarity measures classify the data better than the cosine
simi-larity measure. This is the first case that c1similarity measure can
outperform the cosine similarity measure.
In Table 6, hashing is done using 6 different operators and classi-fication is done using only the cosine similarity measure. Two class, 1-nearest neighbor classification with ordinarily hashed input vec-tors using cosine similarity measure is also presented in the last row
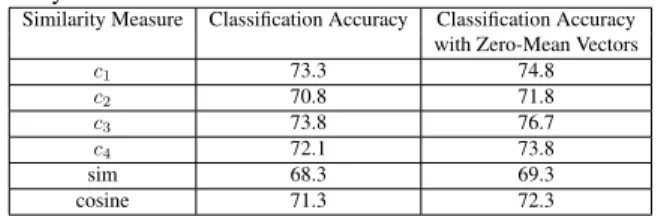
Table 5. Classification accuracies (Percentage) for the 2 class 1-nearest neighbor classification using 16 bit hashed input vectors with 6 different similarity measures. The last row is the ordinary cosine similarity measure.
Similarity Measure Classification Accuracy Classification Accuracy with Zero-Mean Vectors
c1 73.3 74.8 c2 70.8 71.8 c3 73.8 76.7 c4 72.1 73.8 sim 68.3 69.3 cosine 71.3 72.3
Table 6. Cosine similarity classification accuracies (Percentage) for 2 class 1-nearest neighbor classification with 16 bit hashed input vec-tors created by 6 different hashing operavec-tors. The last row is the ordinary hashing operation.
Hashing Operator Classification Accuracy Classification Accuracy with Zero-Mean Vectors
c1 71.3 71.7 c2 73.3 67.8 c3 68.8 69.2 c4 68.8 74.3 sim 60.7 61.7 dot product 68.1 70.3
of Table 5. Most of the alternative operators perform worse than the ordinary hashing operator. Hashing with c1 and c2 operators can
outperform ordinary hashing operator only with standard input vec-tors.
5.1. Query Retrieval using TF-IDF Vectors Based on the Multiplication-Free Vector Similarity Measures
TF-IDF is a computationally efficient method to compute similarity of two text documents [13]. The TF-IDF matrix is computed as in [13]. Ordinary TF-IDF methods use the cosine similarity measure to compare TF-IDF vectors of documents. We also apply the new multiplication-free similarity measures defined in Equations (6 - 9) in order to further reduce the computational cost of query retrieval. Simulation examples are presented in the next section.
In this example, 964 randomly chosen song lyrics are used. The query is chosen as: ”she”, ”believe”, ”peace”, ”again” and TF-IDF vector of query is constructed. Then, TF-IDF values of each key-word is computed for each song seperately in order to construct 964 TF-IDF vectors. Mean value of each TF-IDF vector is subtracted from itself in order to obtain zero-mean vectors. Similarity values between TF-IDF vector of each song and the TF-IDF vector of query is computed using 6 different similarity measures. First ten songs with highest similarity values are presented as query results. The similarity measure sim (Equation (13)) produces meaningless re-sults with zero-mean vectors, therefore simulations are carried out with standard TF-IDF vectors in this case.
As shown in Table 7, c1, c2, c3and c4similarity measures can
return the first ten songs the same as the cosine similarity does. The similarity measures c1, c2, c3and c4can make little mistakes by
con-fusing the places of two consecutive songs. Among 5 approximate similarity measures, c1is the most successful one, which returns 8
Table 7. First ten songs with the highest TF-IDF similarity values in the order for query = ”she believe peace again” using 5 different vector similarty measures. The first column is the ordinary cosine similarity measure. Cosine c1 c2 c3 c4 sim #551 #551 #551 #551 #551 #834 #590 #590 #590 #590 #590 #829 #321 #321 #321 #805 #321 #443 #805 #805 #805 #321 #805 #590 #443 #443 #443 #834 #443 #421 #834 #834 #834 #443 #834 #350 #421 #829 #829 #829 #829 #563 #829 #421 #421 #421 #421 #551 #350 #350 #429 #429 #350 #357 #429 #429 #350 #350 #429 #805
query results in the same order as the cosine similarity does. sim (Equation (13)) similarity measure can return 8 songs the same as cosine similarity does, but it fails to return them in the right order.
6. CONCLUSIONS
In this article, new vector similarity measures based on multiplication-free operators are defined. New operators are low power operators because they use only additions, sign comparisons and minimum and maximum operations. It is experimentally observed that the new measures produce comparable results as the cosine similarity measure in two datasets.
References
[1] Anand Rajaraman and Jeffrey David Ullman, Mining of Mas-sive Datasets, Cambridge University Press, New York, NY, USA, 2011.
[2] Christopher D. Manning, Prabhakar Raghavan, and Hinrich Sch¨utze, Introduction to Information Retrieval, Cambridge University Press, New York, NY, USA, 2008.
[3] Katie Fehrenbacher, “The world of big data needs low power computing,” http://gigaom.com/2011/03/24/the-
world-of-big-data-needs-low-power-computing/, Accessed: 2011-03-24.
[4] A Suhre, F. Keskin, T. Ersahin, R. Cetin-Atalay, R. Ansari, and AE. Cetin, “A multiplication-free framework for signal processing and applications in biomedical image analysis,” in Acoustics, Speech and Signal Processing (ICASSP), 2013 IEEE International Conference on, May 2013, pp. 1123–1127. [5] H. Tuna, I Onaran, and AE. Cetin, “Image description using a
multiplier-less operator,” Signal Processing Letters, IEEE, vol. 16, no. 9, pp. 751–753, Sept 2009.
[6] Onur Yorulmaz, Tom C. Pearson, and A.Enis Cetin, “Detection of fungal damaged popcorn using image property covariance features,” Computers and Electronics in Agriculture, vol. 84, no. 0, pp. 47 – 52, 2012.
[7] Kaan Duman and A. Enis Cetin, “Target detection in sar im-ages using codifference and directional filters,” 2010.
[8] Yusuf Hakan Habiboglu, Osman Gunay, and A.Enis Cetin, “Covariance matrix-based fire and flame detection method in video,” Machine Vision and Applications, vol. 23, no. 6, pp. 1103–1113, 2012.
[9] J. Kleinberg and E. Tardos, “Approximation algorithms for classification problems with pairwise relationships: metric la-beling and markov random fields,” in Foundations of Computer Science, 1999. 40th Annual Symposium on, 1999, pp. 14–23. [10] Moses S. Charikar, “Similarity estimation techniques from
An-nual ACM Symposium on Theory of Computing, New York, NY, USA, 2002, STOC ’02, pp. 380–388, ACM.
[11] R. Da Silva Villaca, L. Bernardes de Paula, R. Pasquini, and M. Ferreira Magalhaes, “A similarity search system based on the hamming distance of social profiles,” in Semantic Comput-ing (ICSC), 2013 IEEE Seventh International Conference on, Sept 2013, pp. 90–93.
[12] Wagner P. K. Peres S. M. Madeo, R. C. B., “UCI machine learning repository,” 2014.
[13] Juan Ramos, “Using tf-idf to determine word relevance in doc-ument queries,” 1999.