176th
Meeting of Acoustical Society of America
2018
Acoustics Week in Canada
Victoria, Canada 5-9 Nov 2018
Biomedical Acoustics: Paper 4aBA3
Published by the Acoustical Society of America
Pulse coding with complementary Golay sequences for
signal to noise ratio improvement in ultrasound
mammography
Yasin Kumru, Kerem Enhoş and Hayrettin Köymen
EEE Department, Bilkent University, Ankara, Bilkent, 06800, TURKEY; [email protected]; [email protected]; [email protected]
The main objective of this study is to obtain improved detection of 50 μm breast microcalcifications in ultrasound mammography. A synthetic transmit aperture imaging method combined with coded excitation and pulse compression is employed. Coded excitation by means of complementary Golay sequences and pulse compression at each transducer element improve the signal to noise ratio and enhance the visualization of the microcalcifications despite the fact that the process is computationally complex. Correlation based beamforming is also applied to the experimental data, resulting in significant improvement in image quality. In this study, pre-beamformed raw data is collected by an ultrasound research scanner, DiPhAS, where a 7.5 MHz phased array transducer with 128 element and 0.1 mm pitch was used. Benefits of coded excitation compared to tone burst excitation of equal energy are clearly observed. The ultrasound images of monofilament nylon wire targets in the phantom are presented, where the superiority of coded excitation is evident. The image reconstruction is performed by using Synthetic Transmit Aperture imaging method with single emission and 5 emissions, respectively. The experimental results show that efficient implementation of coded excitation improves signal to noise ratio, increases penetration depth and provides images with better resolution.
© 2018 Acoustical Society of America. https://doi.org/10.1121/2.0000942
1. INTRODUCTION
Mammography is an imaging modality that aims to screen and examine the human breast tissue. The primary aim of mammography is to make an early detection of breast cancer by detecting microcalcifications (MCs). The efficacy of mammography depends on the resolution, penetration depth and image quality. Improved image quality, resolution and increased penetration depth are mainly required to make a reliable diagnosis.1
There are basically two types of mammography: X-ray Mammography and Ultrasound Mammography. X-ray Mammography is a high-cost imaging technique in which the patient is exposed to ionizing radiation. During X-ray Mammography, the breast tissue is compressed and flattened between two plates, which is painful for the patient. However, X-ray Mammography can detect MCs at an initial stage, of 50-µm size, and thus considered as a reliable tool in diagnostic imaging. Ultrasound Mammography (UsM) is a non-ionizing imaging technique, which uses ultrasonic waves at several MHz frequencies. Current UsM systems cannot reliably detect MCs of 50-µm size. Therefore, UsM is not primarily accepted as a screening tool. The performance of current UsM systems increases when they are used together with X-ray Mammography. Increasing the performance of the current UsM has become an important issue in recent years. Coded excitation is the best nominee to overcome the deficiency of current UsM.2-7 In this study, we employed
coded excitation with a pulse compression technique under very weak signal conditions in UsM to increase the Signal to Noise Ratio (SNR). For a fair comparison from the energy point of view, we used Tone Burst (TB) and coded signals with equal energy in experiments, despite the fact that TB has much poorer resolution. Complementary Golay Sequences (CGSs) are used to code the signal. The experiments were carried out using a 256-channel experimental ultrasound research scanner, Digital Phased Array System (DiPhAS), equipped with a phased array transducer at 7.5 MHz center frequency. During the experiments, a multipurpose tissue/cyst ultrasound phantom with attenuation of 0.5 dB/(MHz × cm) was used. It consists of horizontally placed monofilament nylon targets, 240 µm in diameter, positioned every 2 cm axially.8
The purpose of this study is to achieve an improved detection for the breast MCs in UsM under very weak signal conditions by employing CGS coded excitation. Based on this purpose, we experimentally investigate the performance of CGS coded signals in UsM compared to TB. Therefore, pre-beamformed raw data is collected with DiPhAS and pulse compression by means of matched filtering is applied on this data. Correlation-based beamforming is also implemented on the pulse compressed data. Finally, the pulsed image and CGS coded images are constructed.
2. METHOD
A. EXPERIMENTAL SETUP AND WAVEFORM SELECTION
In order to examine the performance of CGS coded excitation, we used real raw data acquired by a 256-channel experimental ultrasound research scanner, DiPhAS. DiPhAS is a Digital Phased Array System equipped with a Vermon 128 element phased array transducer with a center frequency at 7.5 MHz. DiPhAS enables access to pre-beamformed raw data, saving it into a file for offline post processing and adjustment of the imaging parameters through a Graphical User Interface.
Throughout all experiments, 16-cycle pulse and two CGS coded signals of 8-bit length are used. The time duration of all signals is approximately 2.5 µs. The CGSs (CGS (A) and CGS (B)) consist of “1’s” and “0’s”. The CGSs are formed according to a Binary Phase Shift Keying modulation scheme such that there exists 180ᵒ phase shifts between “1’s” and “0’s”. For convenience, the experimental parameters are summarized in Table 1. DiPhAS allows the synthesis of the transmitted waveform by means of pulse width modulation at 480 MHz.
Two sets of experiments are carried out to obtain pulsed and CGS coded images. The first set of experiments is conducted in a water tank to generate a reference signal. A highly reflecting material, an iron plate, is submerged into the water tank at approximately 4 cm depth. The mid-element (64th element)
of the transducer is fired and reflecting echoes from the surface of iron plate are received. The pre-beamformed raw data at the mid-element is digitally sampled at 80 MHz and saved in a file. The firing process is repeated for three types of excitation signals. Hereafter, the sampled raw data corresponding to pulse and CGS coded signals are used as a reference signal in pulse compression process.
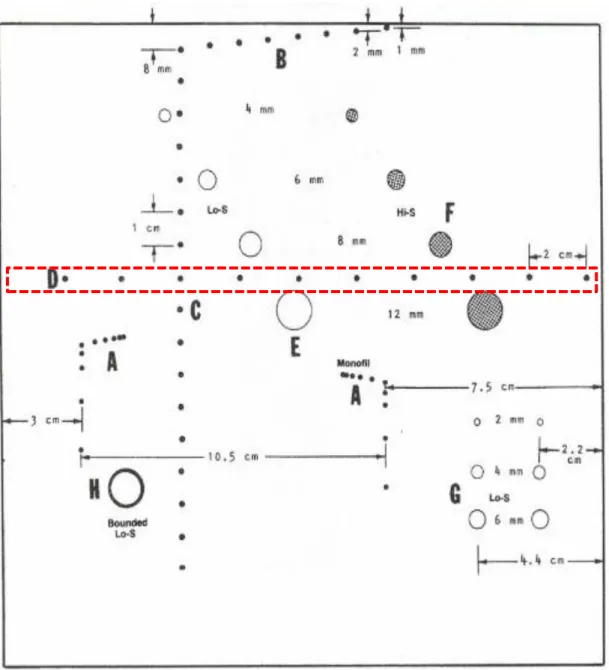
In the second set of experiments, a multipurpose tissue/cyst ultrasound phantom is scanned by the same phased array transducer. The schematic diagram of the phantom is illustrated in Fig.1. The region consisting of horizontally and linearly placed wires, encircled in a rectangular dashed box, is of interest. Synthetic Transmit Aperture (STA) with single emission is employed. In other words, the mid-element of the transducer is fired and reflecting echoes from wires are received by all elements. The pre-beamformed raw data at all elements are digitally sampled at 80 MHz and saved in a file.
Figure 1. Schematic diagram of the multipurpose tissue equivalent phantom (Nuclear Associates Model 84-317, Fluke Biomedical) under examination
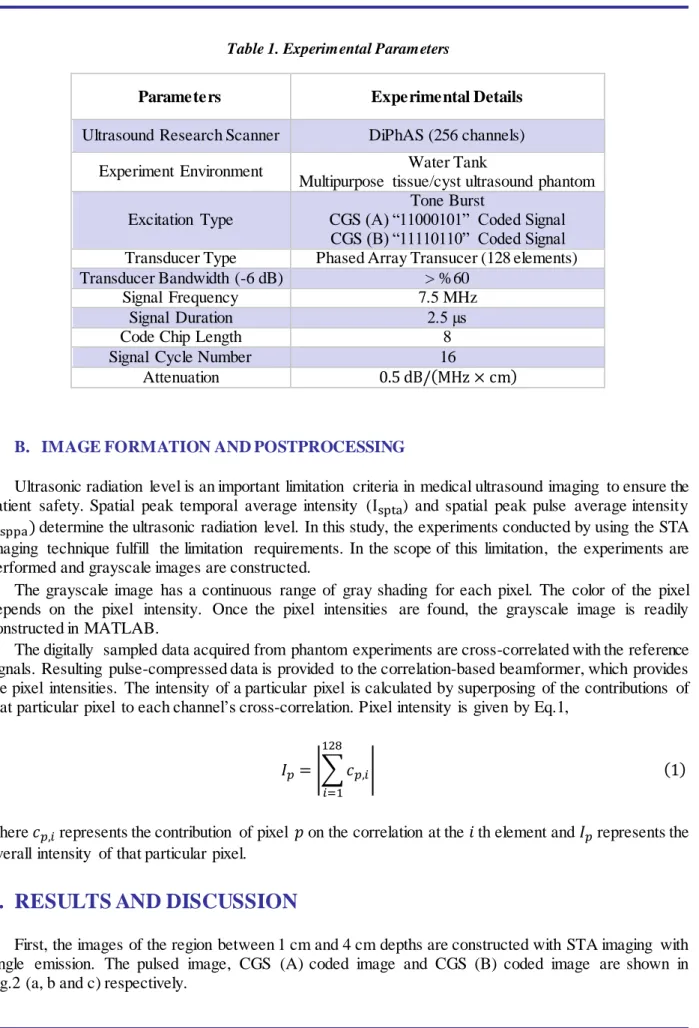
Table 1. Experimental Parameters
Parameters Experimental Details
Ultrasound Research Scanner DiPhAS (256 channels)
Experiment Environment Water Tank
Multipurpose tissue/cyst ultrasound phantom Excitation Type
Tone Burst
CGS (A) “11000101” Coded Signal CGS (B) “11110110” Coded Signal Transducer Type Phased Array Transucer (128 elements)
Transducer Bandwidth (-6 dB) > %60
Signal Frequency 7.5 MHz
Signal Duration 2.5 µs
Code Chip Length 8
Signal Cycle Number 16
Attenuation 0.5 dB/(MHz × cm)
B. IMAGE FORMATION AND POSTPROCESSING
Ultrasonic radiation level is an important limitation criteria in medical ultrasound imaging to ensure the patient safety. Spatial peak temporal average intensity (Ispta) and spatial peak pulse average intensity (Isppa) determine the ultrasonic radiation level. In this study, the experiments conducted by using the STA imaging technique fulfill the limitation requirements. In the scope of this limitation, the experiments are performed and grayscale images are constructed.
The grayscale image has a continuous range of gray shading for each pixel. The color of the pixel depends on the pixel intensity. Once the pixel intensities are found, the grayscale image is readily constructed in MATLAB.
The digitally sampled data acquired from phantom experiments are cross-correlated with the reference signals. Resulting pulse-compressed data is provided to the correlation-based beamformer, which provides the pixel intensities. The intensity of a particular pixel is calculated by superposing of the contributions of that particular pixel to each channel’s cross-correlation. Pixel intensity is given by Eq.1,
𝐼𝑝= |∑ 𝑐𝑝,𝑖 128
𝑖=1
| (1)
where 𝑐𝑝,𝑖 represents the contribution of pixel 𝑝 on the correlation at the 𝑖 th element and 𝐼𝑝 represents the overall intensity of that particular pixel.
3. RESULTS AND DISCUSSION
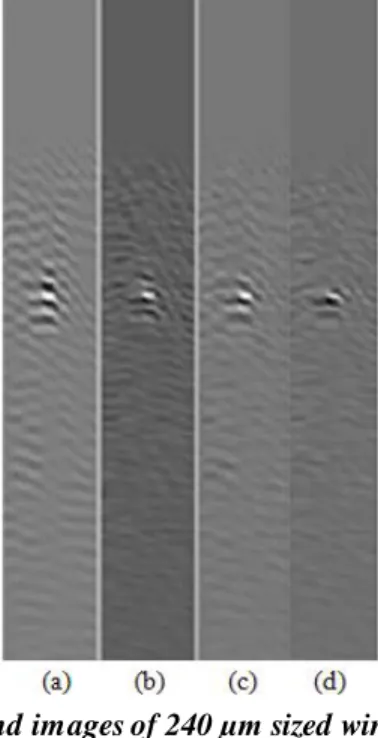
First, the images of the region between 1 cm and 4 cm depths are constructed with STA imaging with single emission. The pulsed image, CGS (A) coded image and CGS (B) coded image are shown in Fig.2 (a, b and c) respectively.
The wire target at 2 cm depth is detected in the pulsed image as shown in Fig.2 (a) but the uncertainty of the wire target position is large. The pulsed image has also poor range resolution due to the increased image artifacts. The wire target at 2 cm depth is also detected in CGS coded images as shown in Fig. 2 (b, c) and the ambiguity of the wire target position is significantly reduced compared to that of the pulsed image. Moreover, the range resolution of the CGS coded images is better than that of the pulsed image due to the reduced image artifacts in the image background.
The CGSs satisfy the complementary condition, which states that the summation of the a-periodic autocorrelations of two CGSs is zero at every nonzero phase shift.9-13 Combining the two CGS coded pulse
compressed and beamformed contributions coherently results in an image with high resolution due to this condition. Superimposed CGS coded image is shown in Fig. 2 (d). The wire target at 2 cm depth in superimposed coded image becomes very clear since the image artifacts are significantly eliminated. The superimposed CGS coded image has the best range resolution among all images.
Figure 2.Ultrasound images of 240 µm sized wire at 2 cm depth.
(a) Pulsed Image, (b) CGS (A) Coded Image, (c) CGS (B) Coded Image, (d) Superimposed Coded Image
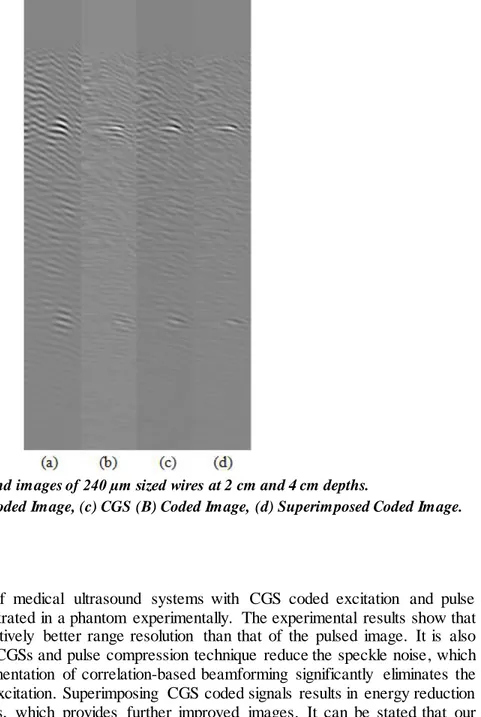
Next, the number of emission and the depth of the region are increased. Instead of STA imaging with a single emission, STA imaging with 5 emissions is employed. In STA imaging with 5 emissions, at each time a single transducer element is fired and all elements receive the echoes where the raw data is acquired over 5 emissions. The successive elements are made active at each transmission. The images of the region between 1 cm and 6 cm depths are constructed. The pulsed image, CGS (A) coded image and CGS (B) coded image are shown in Fig. 3 (a, b and c) respectively. It is observed that the wire target at 4 cm depth is also detected due to the increased depth and number of emission. The results shown in Fig. 3 verify that the CGS coded images have better range resolution compared to the pulsed image. Better range resolution is maintained in combined CGS coded image as shown in Fig. 3(d).
Figure 3.Ultrasound images of 240 µm sized wires at 2 cm and 4 cm depths.
(a) Pulsed Image, (b) CGS (A) Coded Image, (c) CGS (B) Coded Image, (d) Superimposed Coded Image.
4. CONCLUSION
In this paper, the efficacy of medical ultrasound systems with CGS coded excitation and pulse compression technique is demonstrated in a phantom experimentally. The experimental results show that the CGS coded images have relatively better range resolution than that of the pulsed image. It is also presented that pulse coding with CGSs and pulse compression technique reduce the speckle noise, which provides better resolution. Implementation of correlation-based beamforming significantly eliminates the image artifacts in case of coded excitation. Superimposing CGS coded signals results in energy reduction in coded signal side lobe regions, which provides further improved images. It can be stated that our proposed method is an effective approach to enhance SNR and make a reliable diagnosis in medical ultrasound under very weak signal conditions. Further assessments by using Multi-Modality Breast Biopsy & Sonographic Trainer Phantom (Model 073, CIRS) and Breast & Small Parts Phantom (Model 550, CIRS) for CGS coded excitation will be implemented as a future work.
ACKNOWLEDGMENTS
This work was supported by the Scientific and Technological Research Council of Turkey under Project Grant 114E588. The authors also would like to express particular thanks to the acoustic group of Bilkent University for their contribution to improve this work.
REFERENCES
1Pearson, Medical Imaging Signals and Systems, Prince & Links, 2/2014.
2T.X.Misaridis and J.A JENSEN, “Use of Modulated Excitation Signals in Medical Ultrasound. Part I: Basic concepts and Expected Results”, IEEE Transactions on Ultrasonics, Ferroelectrics and Frequency Control, Vol.52, No.2, February 2005.
3T.X.Misaridis and J.A JENSEN, “Use of Modulated Excitation Signals in Medical Ultrasound. Part II: Design and Performance for Medical Imaging Applications”, IEEE Transactions on Ultrasonics, Ferroelectrics and Frequency Control, Vol.52, No.2, February 2005.
4T.X.Misaridis and J.A JENSEN, “Use of Modulated Excitation Signals in Medical Ultrasound. Part III: High Frame Rate Imaging”, IEEE Transactions on Ultrasonics, Ferroelectrics and Frequency Control, Vol.52, No.2, February 2005.
5R.Y.Chiao and X.Hao, “Coded Excitation for Diagnostic Ultrasound: A System Developer’s Perspective”, IEEE Transactions on Ultrasonics, Ferroelectrics and Frequency Control, Vol.52, No.2, February 2005.
6I.Trots, Y.Tasinkevych, A.Nowicki, M.Lewandowski, “Coded Transmission in Synthetic Transmit Ape rture Ultrasound Imaging Method”, WASET, 2012.
7Yasin KUMRU, “Using Spread Spectrum Coded Pings in Active Sonar Technology”, Bilkent University, M.Sc. Thesis, July 2014.
8Fluke Biomedical Radiation Management Services, 6045 Cochran Road Cleveland, Ohio 44139, 440.498.2 56 4, www.flukebiomedica l.co m/rms
9D.Z.Dokovic,”Equivalence Classes and Representatives of Golay Sequences” Discrete Mathematics 189 (1998) 79-93.
10Elena Kalashnikov, “An Introduction to Golay Complementary Sequences”, Department of Mathematic s, University of Alberta, 2004.
11S.Kounias, C.Koukouvinos and K.Sotirakoglou “On Golay Sequences” Discrete Mathematics 92 (1991) 177-185,1988.
12I.Trots, A.Nowicki, W.Secomski, J.Litniewski “Golay Sequences -Side Lobe-Canceling Codes For Ultrasonography”, Archives of Acoustics, 2004.
13M.J.E.Golay, “Complementary Series”, IRE Transactions on Information Theory, vol IT-7, pp 82-87, 1961.