Monetary policy and long-term US interest rates
Hakan Berument
a, Richard T. Froyen
b,*a
Bilkent University, Ankara, Turkey b
Department of Economics, CB#3305, University of North Carolina, Chapel Hill NC, 27599-3305, United States Received 19 December 2003; accepted 24 February 2005
Available online 25 July 2006
Abstract
This paper assesses the effect of federal funds rate innovations on longer-term US nominal interest rates across different periods. The evidence suggests that these responses change with changes in the monetary policy regime. Time periods considered are pre- and post-1979 and different Federal Reserve Chairman’s tenure. The response of longer-term interest rates to federal funds rate innovations are shown to be smaller and less persistent in the post-1979 period when the Federal Reserve placed more emphasis on inflation. Ó 2006 Elsevier Inc. All rights reserved.
JEL classification: E43; E52; E58
Keywords: Monetary policy; Long-term interest rates; Time variation
1. Introduction
This paper examines the effects of monetary policy on long-term interest rates in the Uni-ted States. Monetary policy impulses are measured by innovations in the federal funds rate which was the Federal Reserve’s policy instrument over most of the period examined. Given that the Federal Reserve conducts monetary policy in this manner, the response of longer-term rates to the federal funds rate is a key question. The focus of this study is on the way in which this response depends on the monetary policy regime. How has the response of longer-term interest rates to innovations in the federal funds rate varied with what in the literature have been identified as regime changes?
0164-0704/$ - see front matter Ó 2006 Elsevier Inc. All rights reserved. doi:10.1016/j.jmacro.2005.02.004
* Corresponding author. Tel.: +1 919 966 5375. E-mail address:[email protected](R.T. Froyen).
This focus leads us to proceed in the following manner. First, we consider a long period 1973–2002 and focus on time-variation in the response of longer-term rates to innovations in the federal funds rate. Second, we employ weekly data and consider several ways to break the time-span considered into subperiods corresponding to different monetary pol-icy regimes. Besides providing sufficient observations to examine a number of subperiods, weekly data are more likely to pick out actual innovations to the federal funds rate than are monthly or quarterly observations. Finally, responses of long-term interest rates to innovations in the federal funds rate are examined within a VAR framework allowing for the interaction of interest rates with other macroeconomic variables.
There are a number of recent studies related to our research. Evans and Marshall (1998), Kozicki and Tinsley (2001a,b), and McMillin (2001)study the linkage of monetary policy and short- and long-term nominal interest rates within VAR frameworks.Kuttner (2001)estimates the impact of monetary policy actions on interest rates of various matu-rities.Mehra (1996), Roley and Sellon (1995) and Thornton (1998)study the response of longer-term interest rates to monetary policy actions measured by the federal funds rate (or target federal funds rate), as does an earlier paper byCook and Hahn (1989). Addi-tional empirical literature on the topic is surveyed inAkhtar (1995).
This literature suggests considerable uncertainty about the response of longer-term interest rates to changes in the federal funds rate. Even the direction of the effect is a subject of disagreement. Two recent macroeconomic textbooks, for example, present diver-gent views.Blanchard (2000, p. 295)expresses the ‘‘standard view’’ that ‘‘when short-term rates move, whether down (as in the 1990–1991 recession) or up, long-term interest rates are likely to move in the same direction, but by less.’’Cook and Hahn (1989)report results con-sistent with this view.Romer (2001, p. 477)considers Cook and Hahn’s result an ‘‘anom-aly.’’ In his view, the ‘‘idea that a contractionary monetary policy [a rise in the federal funds rate] should immediately lower long-term nominal interest rates is intuitive: contractionary policy is likely to cause real interest rates to rise only briefly and is likely to lower inflation over the longer term.’’ We return to these divergent views at a later point.
The paper is organized as follows. Section2discusses the data and sets out the VAR framework employed. Section3 presents our results. Section4considers these results in the context of previous literature. Section5contains concluding comments.
2. Data, time periods and statistical procedures
As noted in Section 1, we examine the response of long-term interest rates to inno-vations in the federal funds rate within a VAR framework to allow for the interaction of interest rates with other macroeconomic variables. In this section, the details of the VAR specification are provided.
2.1. Data
The data we use are: the federal funds rate; a longer-term interest rate, either the 10 or 1-year government security rate; an economic activity measure; an unemployment indicator; a commodity price index and a money measure.1The federal funds rate (FF) is a weekly
1
The 1-year rate is not very ‘‘long-term.’’ Still it is an important market rate in that other interest rates including variable rate mortgages are linked to it.
(Wednesday–Wednesday) average of daily data. The 1-year and 10-year interest rates (R1 and R10) are constant maturity treasury rates, also weekly averages of Wednesday– Wednesday daily rates. Interest rate data are from the Federal Reserve Bank of St. Louis. The measure of economic activity (Y) is the weekly leading index compiled by the Economic Cycle Research Institute. The index is a composite of seven elements of the monthly index of leading economic indicators. It is released each Friday with data through the previous week. The unemployment measure (UN) is weekly new unemployment insurance claims (R539 Report CY, US Department of Labor, week ending Saturday). The commodity price index (CP) is the Economist magazine index for all commodities (reported Saturday). The money supply is M1, also from the Federal Reserve Bank of St. Louis (Friday to Friday). 2.2. Time periods
There are a number of possible explanations for a time-varying response of long-term interest rates to policy induced changes in the federal funds rate. Our interest is in the role of monetary policy regime shifts. For that reason we break the time period (January 1975– August 2002) into subperiods in two ways.
The first is to break the data into the subperiods (January 1975–October 1979) and (November 1982–August 2002).2There was a widely acknowledged shift in monetary pol-icy on October 6, 1979. The post-1979 subperiod here begins in November 1982 to exclude the turbulent period often referred to as the ‘‘monetarist experiment’’ between October 1979 and October 1982 (which we examine separately). Several studies (Clarida et al.,
2000; Froyen and Waud, 2002; Taylor, 1999) provide evidence that the Federal Reserve
was more responsive to inflation in the 1979 regime. In fact it is only in the post-1979 period that estimated inflation responses in these studies are consistent with what has been called the Taylor principle – that the federal funds rate rises by more than 1% point per 1% point increase in the inflation rate. Post-1979 Federal Reserve policy is thus more consistent with firmly anchored long-term inflation expectations and consequently similarly anchored expectations of future short-term interest rates.
The second breakdown of the data is by tenure of Federal Reserve Board Chairman: Burns (January 1975–February 1978); Volcker (August 1979–August 1987); and Greenspan (August 1987–August 2002). The Burns period starts in January 1975, the earliest date for which all of our weekly data series are available.3The tenure of G. William Miller is not included because it is too short a period. Finally, in addition to the whole Volcker tenure, we separately consider the period of the monetarist experiment (October 1979–October 1982).
The individual chairman’s tenures are of interest for several reasons. The change from Arthur Burns’s tenure to that of Paul Volcker’s is nearly coincident with the 1979 regime change. Volcker’s tenure taken as a whole is a period of adaptation to the new regime. The Greenspan tenure is a period when the new regime, for which there is evidence of a greater Federal Reserve concern with inflation, was well established. Moreover, asTaylor (1999, p. 332)shows, during the Greenspan period the federal funds rate was more responsive to both inflation and output than in the pre-1979 period. Finally, the chairman’s credibility
2
Alternatively, the earliest subperiod is January 1973–October 1979. To go back to January 1973 we must drop M1 from our VAR. We do not go back farther than 1973 to avoid the period of mandatory price and wage controls in our analysis. Exact dates of subperiods are given in the footnote toTable 2.
3
per se may affect views of market participants about Federal Reserve commitment to a stable long-term inflation objective.
The hypothesis that we test in our empirical work is that in the post-1979 period an increased Federal Reserve commitment to the goal of low inflation anchored long-run inflationary expectations and therefore made long-term interest rates less responsive to innovations in the federal funds rate.
2.3. Details of the VAR specification
The VARs that we estimate include: the federal funds rate, one of the longer-term inter-est rates, unemployment claims, economic activity, commodity prices and money. All the non-interest rate variables are measured in natural logarithms. To choose the specification of the variables in the VARs, we first examine the time series properties of those variables. The Dickey–Fuller, augmented Dickey–Fuller and Phillips–Perron tests all fail to reject a unit root in the levels of these time series. Unit roots can, however, be rejected in first-differences of all series. We also tested for cointegration among the variables. For these tests there are two sets of VARs, one including each of the longer-term interest rates. Both Johansen’s k-max and k-trace tests decisively reject the hypothesis of no cointegration for both sets of variables. Further tests indicate that there are most likely three or four coin-tegrating vectors in each set.
If the variables in our system are non-stationary but cointegrated as our tests indicate,
Sims et al. (1990) and Lutkepohl and Reimers (1992)indicate that estimation of the VAR
in (log) levels will provide consistent estimates. This is how we proceed. The Bayesian information criterion suggests a lag order of two for the VARs.4
We assume our system is recursive and employ the Choleski decomposition for identi-fication. We enter the variables in the following order: CP, Y, UN, FF, (R10 or R1), M1. Theory suggests that on a weekly basis commodity prices, unemployment claims and our measure of economic activity are not affected by financial market variables. Each of these series is reported at approximately the same time of the week (Friday or Saturday) and the ordering among them reflects the assumption that commodity prices are not affected by contemporaneous shocks to real variables. This ordering reflects the assumption that the federal funds rate responds to current innovations in commodity prices, our measure of economic activity and unemployment claims. Since data for these are released during the week (Wednesday–Wednesday) for which the federal funds rate is computed, this is not unrealistic. Longer-term interest rates and money are assumed to respond contempo-raneously to the federal funds rate.5
3. Results
3.1. Impulse response functions
Figs. 1–8provide impulse response functions for shocks to the federal funds rate.Figs.
1–3, 6–8show impulse responses for the whole period (1975–2002) and for the pre- and
4
Two was also the lag order for the Johansen cointegration tests. 5
We also estimated VARs where the longer-term interest rate was entered before the federal funds rate. This change in ordering did not affect our results significantly.
post-1979 periods, for the 1- and 10-year interest rates, respectively.Figs. 4 and 5are the Volcker and Greenspan regimes. Impulse response functions for the Burns regime are sim-ilar to those for the pre-1979 period and are not shown. The impulse response functions are estimated for 52 weeks for a shock standardized to equal a 1% point (100 basis points) change in the federal funds rate. Confidence bands at 90% for the estimated impulse responses are calculated using a bootstrap method of 500 draws to calculate the standard errors.6
Table 1provides the instantaneous response of the longer-term rate (1- and 10-year) to federal funds rate shocks, the maximum response and the number of weeks following the shock at which the maximum response occurs. Time periods shown are those inFigs. 1–8
with some additional results for individual chairman’s regimes. 3.1.1. One-year rate
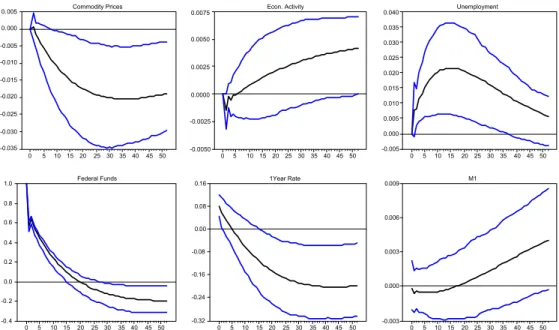
As shown inFig. 1, for the whole sample period (January 1975–August 2002) a positive 1% point shock to the federal funds rate increases the 1-year interest rate with the maxi-mum effect coming after 3 weeks. FromTable 1this effect is 0.323% points per 1% point change in the federal funds rate. The estimated impulse response function shows that the 1-year rate remains above its initial value throughout the 52-week period, though signif-icantly so for only 30 weeks.
The response of the 1-year interest rate to a 1% point shock in the federal funds rate in the pre-1979 subperiod, as shown inFig. 2, follows a similar pattern to that in the whole
Commodity Prices 0 5 10 15 20 25 30 35 40 4550 -0.0175 -0.0150 -0.0125 -0.0100 -0.0075 -0.0050 -0.0025 0.0000 0.0025 0.0050 Econ. Activity 0 5 10 15 20 25 3035 40 45 50 -0.005 -0.004 -0.003 -0.002 -0.001 0.000 0.001 Unemployment 0 5 10 15 20 25 30 35 40 45 50 -0.010 -0.005 0.000 0.005 0.010 0.015 0.020 0.025 0.030 Federal Funds 0 5 10 15 20 25 30 35 40 45 50 -0.2 0.0 0.2 0.4 0.6 0.8 1.0 1Year Rate 0 5 10 1520 25 30 35 40 45 50 -0.1 0.0 0.1 0.2 0.3 0.4 0.5 M1 0 5 10 15 2025 30 35 40 45 50 -0.0016 -0.0008 0.0000 0.0008 0.0016 0.0024 0.0032 0.0040 0.0048 0.0056
Fig. 1. Full sample (January 1975–August 2002).
6
FollowingSims and Zha (1999), we reported the impulse responses rather than median of simulations. Thus, the bands are not symmetric.
period. It can be seen from Table 1 that the magnitude of the response per 1% point change in the federal funds rate, both initially and at the maximum (in this case after 2
Commodity Prices 0 5 10 15 20 25 30 35 40 4550 -0.016 -0.008 0.000 0.008 0.016 0.024 0.032 0.040 Econ. Activity 0 5 10 15 2025 30 35 40 45 50 -0.014 -0.012 -0.010 -0.008 -0.006 -0.004 -0.002 0.000 Unemployment 0 5 10 15 20 25 30 35 4045 50 -0.028 -0.014 0.000 0.014 0.028 0.042 0.056 0.070 Federal Funds 0 5 10 15 20 25 30 35 4045 50 -0.16 0.00 0.16 0.32 0.48 0.64 0.80 0.96 1.12 1Year Rate 0 5 10 15 20 25 30 35 40 45 50 -0.16 0.00 0.16 0.32 0.48 0.64 0.80 0.96 M1 0 5 10 15 20 25 30 35 4045 50 -0.009 -0.006 -0.003 -0.000 0.003
Fig. 2. First subperiod (January 1975–September 1979).
Commodity Prices 0 5 10 1520 25 30 35 40 45 50 -0.035 -0.030 -0.025 -0.020 -0.015 -0.010 -0.005 0.000 0.005 Econ. Activity 0 5 1015 20 25 30 35 4045 50 -0.0050 -0.0025 0.0000 0.0025 0.0050 0.0075 Unemployment 0 5 1015 2025 30 35 40 45 50 -0.005 0.000 0.005 0.010 0.015 0.020 0.025 0.030 0.035 0.040 Federal Funds 0 5 10 15 20 25 30 35 40 45 50 -0.4 -0.2 0.0 0.2 0.4 0.6 0.8 1.0 1Year Rate 0 5 10 15 20 25 30 3540 45 50 -0.32 -0.24 -0.16 -0.08 0.00 0.08 0.16 M1 0 5 1015 2025 30 35 40 45 50 -0.003 0.000 0.003 0.006 0.009
weeks), is greater in this subperiod than for the whole period. The 1-year rate rises instan-taneously by 0.428% points. The maximum response is 0.709% points.7
Commodity Prices 0 5 10 15 20 25 30 3540 45 50 -0.0075 -0.0050 -0.0025 0.0000 0.0025 0.0050 0.0075 0.0100 0.0125 Econ. Activity 0 5 10 1520 25 30 35 40 45 50 -0.0035 -0.0030 -0.0025 -0.0020 -0.0015 -0.0010 -0.0005 0.0000 0.0005 0.0010 Unemployment 0 5 10 15 20 2530 35 40 45 50 -0.015 -0.010 -0.005 0.000 0.005 0.010 0.015 Federal Funds 0 5 10 15 20 25 30 35 40 45 50 -0.2 0 .0 0 .2 0 .4 0 .6 0 .8 1.0 1Year Rate 0 5 10 15 20 25 30 35 40 45 50 -0.18 -0.12 -0.06 0.00 0.06 0.12 0.18 0.24 0.30 0.36 M1 0 5 10 15 20 2530 35 40 45 50 -0.004 -0.003 -0.002 -0.001 0.000 0.001 0.002
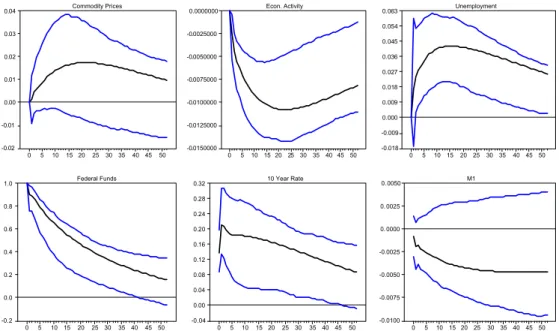
Fig. 4. Volcker era (August 1979–August 1987). Commodity Prices 0 5 10 15 20 25 3035 40 45 50 -0.06 -0.05 -0.04 -0.03 -0.02 -0.01 0.00 0.01 Econ. Activity 0 5 10 15 20 2530 35 40 45 50 -0.0100 -0.0075 -0.0050 -0.0025 0.0000 0.0025 0.0050 0.0075 0.0100 Unemployment 0 5 10 15 20 25 30 3540 45 50 -0.02 -0.01 0.00 0.01 0.02 0.03 0.04 0.05 0.06 0.07 Federal Funds 0 5 10 15 20 2530 35 40 45 50 -0.6 -0.4 -0.2 -0.0 0.2 0.4 0.6 0.8 1.0 1 Year Rate 0 5 10 15 20 25 30 35 40 45 50 -0.6 -0.5 -0.4 -0.3 -0.2 -0.1 -0.0 0.1 0.2 M1 0 5 10 15 20 25 30 35 4045 50 -0.0050 -0.0025 0.0000 0.0025 0.0050 0.0075 0.0100 0.0125 0.0150 0.0175
Fig. 5. Greenspan era (August 1987–August 2002).
7
Extending the pre-1979 period to begin in January 1973 results in only minor changes in the impulse response functions.
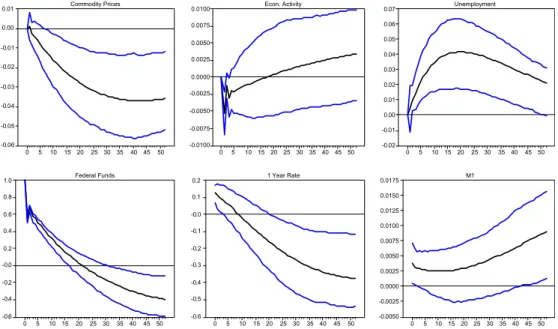
The impulse response functions for the post-1979 period, shown inFig. 3, indicate a response different from the pre-1979 period. The initial increase in the 1-year rate follow-ing a positive innovation in the federal funds rate is much smaller than for the pre-1979 period or whole period. From Table 1 it can be seen that the instantaneous response,
Commodity Prices 0 5 10 15 20 25 30 3540 45 50 -0.020 -0.015 -0.010 -0.005 0.000 0.005 Econ. Activity 0 5 10 15 20 25 30 35 40 45 50 -0.005 -0.004 -0.003 -0.002 -0.001 0.000 0.001 Unemployment 0 5 10 15 20 25 3035 40 45 50 -0.010 -0.005 0.000 0.005 0.010 0.015 0.020 0.025 0.030 0.035 Federal Funds 0 5 10 15 20 2530 35 40 45 50 -0.2 0.0 0.2 0.4 0.6 0.8 1.0 10 Year Rate 0 5 10 15 20 25 30 3540 45 50 -0.10 -0.05 0.00 0.05 0.10 0.15 0.20 M1 0 5 10 15 20 25 30 3540 45 50 -0.0032 -0.0024 -0.0016 -0.0008 -0.0000 0.0008 0.0016 0.0024 0.0032
Fig. 6. Full sample (January 1975–August 2002).
Commodity Prices 0 5 10 1520 25 30 35 40 45 50 -0.02 -0.01 0.00 0.01 0.02 0.03 0.04 Econ. Activity 0 5 10 15 20 25 30 35 40 45 50 -0.0150000 -0.0125000 -0.0100000 -0.0075000 -0.0050000 -0.0025000 0.0000000 Unemployment 0 5 1015 20 25 30 35 40 45 50 -0.018 -0.009 0.000 0.009 0.018 0.027 0.036 0.045 0.054 0.063 Federal Funds 0 5 1015 20 25 30 35 40 45 50 -0.2 0.0 0.2 0.4 0.6 0.8 1.0 10 Year Rate 0 5 10 1520 25 30 35 4045 50 -0.04 0.00 0.04 0.08 0.12 0.16 0.20 0.24 0.28 0.32 M1 0 5 10 15 2025 30 35 40 45 50 -0.0100 -0.0075 -0.0050 -0.0025 0. 0000 0. 0025 0. 0050
which is also the maximum, is only 0.082% points per 1% increase in the federal funds rate. Moreover, a change in the federal funds rate moves the 1-year rate in the same direction for only 6 weeks. After that the response of the long-term is negative, though relatively small, for the rest of the 52-week period.
Next consider impulse response functions for the chairmanships of Volcker and Green-span. In the Volcker period, the instantaneous response to a positive innovation in the fed-eral funds rate of 1% point is a rise of 0.196% points in the 1-year rate. The maximum response is a rise of 0.246% after 1 week. The positive response persists for 12 weeks (Fig. 4). In addition to the whole of Volcker’s tenure, we examine the period of October 1979–October 1982. This is the period in our sample when the assumption that the federal funds rate was the short-run operating target of the Federal Reserve is doubtful. Impulse
Commodity Prices 0 5 10 15 20 2530 35 40 45 50 -0.035 -0.030 -0.025 -0.020 -0.015 -0.010 -0.005 0.000 0.005 Econ. Activity 0 5 10 15 20 2530 35 40 45 50 -0.004 -0.002 0.000 0.002 0.004 0.006 0.008 Unemployment 0 5 10 15 2025 30 35 40 45 50 -0.005 0.000 0.005 0.010 0.015 0.020 0.025 0.030 0.035 Federal Funds 0 5 10 1520 25 30 35 40 45 50 -0.25 0.00 0.25 0.50 0.75 1.00 10 Year Rate 0 5 10 1520 25 30 35 40 45 50 -0.25 -0.20 -0.15 -0.10 -0.05 -0.00 0.05 0.10 M1 0 5 10 15 20 2530 35 40 45 50 -0.0080 -0.0064 -0.0048 -0.0032 -0.0016 -0.0000 0.0016 0.0032
Fig. 8. Second subperiod (November 1982–August 2002).
Table 1
Responses of the 1- and 10-year interest rates to a 1% point innovation on the federal funds rate
Full sample First sample Second sample Burns Volcker Greenspan Panel A: 1-year Instantaneous 0.225 0.428 0.082 0.471 0.196 0.127 Maximuma 0.323 0.709 0.082 0.736 0.246 0.127 Peak 3 2 0 1 1 0 Panel B: 10-year Instantaneous 0.091 0.137 0.027 0.157 0.075 0.052 Maximum 0.099 0.212 0.027 0.220 0.075 0.052 Peak 13 1 0 1 0 0 a
Maximum response is the largest response in the same direction as the movement in the federal funds rate following the innovation.
response functions for this period for VARs including the 1-year rate are similar to those for the complete Volcker period. The maximum effect of a positive 1% point innovation in the federal funds rate, for example, is 0.183 for 1979–82 compared to 0.246 for 1979–87. For the Greenspan chairmanship the impulse response function shows an initial rise in the 1-year rate in response to a positive innovation in the federal funds rate. The rise persists only for 8 weeks (and is significant for only 3). The response of the 1-year rate is then neg-ative for the rest of the 52 week period and statistically significant for most of this period. 3.1.2. 10-year interest rate
Figs. 6–8show impulse response functions from VARs where the long-term interest rate is measured by the 10-year government security rate. Panel B of Table 1 provides the instantaneous response and maximum response of the 10-year rate to a 1% point change in the federal funds rate. Overall the responses of the 10-year rate to the federal funds rate are in the same direction but are smaller in magnitude than are the responses of the 1-year rate. The maximum responses of the 10-year rate are, for example, approximately one-third to one-half the response of the 1-year rate. The pattern of the responses of the 10-year interest rate over the subperiods considered is in most respects similar to that for the 1-year rate.
3.1.3. Effects on other macroeconomic variables
Our main focus is on the effects of federal funds rate innovations on longer-term inter-est rates. Other variables are included in VARs to control for their influence on the interinter-est rate variables. Still, it is of interest to consider the estimated effect of federal funds rate innovations on these other macroeconomic variables. The pattern of these effects are sim-ilar for VARs including the 1- and 10-year interest rates. They are for the most part in accord with what theory predicts.
Consider an increase in the federal funds rate and look atFig. 1orFig. 6for the whole period. The restrictive monetary policy initially lowers the commodity price index (through the effect is insignificant), lowers industrial production and raises unemployment. The response of the money supply differs depending on which interest rate is included in the VAR. M1 declines initially in both cases but rises after the first month with the 1-year rate included while it continues below its initial level over the whole 52-week period when the 10-year rate is in the VAR.
Impulse response functions for various subperiods show responses of these macroeco-nomic variables that are for the most part similar to those inFigs. 1 and 6. An exception is that in a few cases a positive innovation in the federal funds rate causes a rise in the com-modity price index (e.g.Fig. 2), but in each case this effect is insignificant.
3.2. Variance decompositions
Tables 2 and 3report forecast error variance decompositions from VARs including the
1- and 10-year interest rates, respectively. The Tables show the percent of the forecast var-iance in the long-term interest rate that is explained by innovations in the federal funds rate, as well as the percent of the federal funds rate forecast variance that is self-explained. Forecast horizons are 13, 26, and 52 weeks. The variance decompositions are based on VARs estimated for the same time periods considered for impulse response functions in the previous subsection.
3.2.1. 1-year interest rate
We begin with results for the 1-year interest rate inTable 2. For the whole period, the federal funds rate explains a significant fraction of the forecast variance in the long-term rate at a forecast horizon of 13 weeks (at the 0.05 level) and 26 weeks (at the 0.10 level). Innovations in the federal funds rate have their greatest effect on the longer-term rate in the first subperiod and in the largely overlapping period of the Burns chairmanship. In the first subperiod, for example, innovations in the federal funds rate explain over 23% of the forecast variance in the 1-year rate at forecast horizons of 13, 26, and 52 weeks (all effects significant at the 0.05 level). These results reported inTable 2are from the January 1975–Sep-tember 1979 period. When the pre-1979 subperiod is extended back to January 1973, inno-vations in the federal funds rate explain a somewhat higher fraction of the forecast variance of the 1-year rate of each forecast horizon, from 30% to 33% (all significant at the 0.05 level).
FromTable 2it can be seen that for the post-1979 subperiod and for the Volcker and
Greenspan chairmanships, the percent of the forecast variance in the 1-year rate explained by the federal funds rate is much smaller and is insignificant at each forecast horizon.8
The variance decompositions in Panel B ofTable 2indicate that innovations in federal funds rate explain progressively less of its own forecast variance in more recent time peri-ods at all forecast horizons. Also, as would be expected, less of the forecast variance in the Table 2
Forecast error variance decompositions with 1-year interest rate
Full sample First sample Second sample Burns Volcker Greenspan Panel A: 1-year interest rate by federal funds rate
13 11.43** 27.60** 0.73 20.01* 3.80 0.54 (4.39) (8.43) (1.14) (10.99) (3.97) (0.88) 26 9.84* 28.50** 2.67 19.03 2.76 1.58 (5.22) (10.00) (3.13) (11.87) (4.07) (2.10) 52 7.10 23.64** 5.83 18.70 2.36 5.42 (4.47) (10.48) (4.96) (11.76) (3.76) (4.90)
Panel B: Federal funds rate by federal funds rate
13 60.50 68.82 60.86 62.40 53.06 49.00 (4.92) (8.19) (5.50) (10.03) (7.61) (4.54) 26 41.63 58.85 31.08 52.57 37.97 18.61 (6.42) (10.44) (5.59) (11.99) (8.99) (3.47) 52 25.70 44.04 17.30 41.33 30.02 9.68 (5.92) (11.56) (2.23) (12.86) (9.43) (3.64)
Full sample: January 3, 1975–August 30, 2002. First sample: January 3, 1975–September 28, 1979. Second sample: November 5, 1982–August 30, 2002. Burns: January 3, 1975–February 17, 1978. Volcker: August 10, 1979–August 14, 1987. Greenspan: August 21, 1987–August 30, 2002.
Standard errors are shown in parentheses beneath the coefficients. The fraction of the federal funds rate explained by itself (Panel B) is significant at the 0.05 level in all cases. In Panel A of each table, one asterisk (*) indicates significance at the 0.10 level and two asterisks (**) indicates significance at the 0.05 level.
8
Variance decompositions were also computed from VARs estimated for the October 1979–October 1982 portion of the Volcker chairmanship. The percent of the forecast variance of the 1- and 10-year interest rates explained by innovations in the federal funds rate were slightly higher than for the whole Volcker chairmanship but were not statistically significant.
federal funds rate is self-explained at longer forecast horizons. The latter pattern is stron-gest in the Greenspan period where at a 52 week horizon only 9.68% of the forecast var-iance in the federal funds rate is explained by innovations in the federal funds rate itself. Note that this is the time period whereTaylor (1999)found that the funds rate was highly responsive to macroeconomic target variables.
3.2.2. 10-year interest rate
Variance decompositions from VARs where the 10-year government security rate is the measure of the long-term interest rate are shown inTable 3. The percentage of the forecast var-iance in the 10-year interest rate that is explained by the federal funds rate is significant for all forecast horizons for the first subperiod (0.10 level at 13 and 26 week horizons and 0.05 level at a 52 week horizon). This percentage of forecast variance explained is also significant for the Burns subperiod at a 52 week horizon. For the post-1979 subperiod and periods of Volker’s and Greenspan’s chairmanship, a much smaller and statistically insignificant fraction of the fore-cast variance in the 10-year rate is explained by innovations in the federal funds rate.
4. Relationship to previous research
4.1. Literature on market interest rates and monetary policy
Blanchard (2000) expressed the conventional view that movements in the short-term
interest rate will move long-term rates in the same direction, the degree of response Table 3
Forecast error variance decompositions with 10-year interest rate
Full sample First sample Second sample Burns Volcker Greenspan Panel A: 10-year interest rate by federal funds rate
13 3.01 13.77* 0.98 7.33 1.04 0.15 (2.31) (8.01) (1.27) (6.14) (2.36) (0.62) 26 3.24 18.67* 2.91 9.89 2.40 0.63 (3.34) (9.61) (2.86) (7.41) (4.33) (1.60) 52 3.00 21.08** 5.82 16.30* 3.66 1.89 (4.90) (10.69) (4.95) (9.67) (5.42) (11.00)
Panel B: Federal funds rate by federal funds rate
13 82.42 87.13 80.65 78.14 71.69 65.50 (3.02) (5.65) (3.98) (8.36) (6.78) (4.67) 26 65.65 78.86 52.64 67.48 55.56 33.03 (5.34) (9.07) (7.42) (11.78) (9.39) (6.39) 52 42.23 60.37 26.53 52.10 43.06 12.14 (7.64) (11.94) (7.71) (13.48) (10.40) (1.73)
Full sample: January 3, 1975–August 30, 2002. First sample: January 3, 1975–September 28, 1979. Second sample: November 5, 1982–August 30, 2002. Burns: January 3, 1975–February 17, 1978. Volcker: August 10, 1979–August 14, 1987. Greenspan: August 21, 1987–August 30, 2002.
Standard errors are shown in parentheses beneath the coefficients. The fraction of the federal funds rate explained by itself (Panel B) is significant at the 0.05 level in all cases. In Panel A of each table, one asterisk (*) indicates significance at the 0.10 level and two asterisks (**) indicates significance at the 0.05 level.
declining with term to maturity. Our results for the whole period indicate that over a long time frame this is the case on average.Romer (2001)characterized the conventional view as an anomaly, believing it was ‘‘intuitive’’ that a rise in the federal funds rate should lower long-term rates. He suggests a possible explanation of this anomaly which is explored fur-ther in Romer and Romer (2000). This explanation relies on asymmetric information between the Federal Reserve and the public. If the Federal Reserve is known to have supe-rior inflation forecasts then ‘‘when market participants observe a shift to tighten monetary policy, they do not infer that the Federal Reserve is tougher on inflation than they had previously believed. Rather, they infer that there is unfavorable information about infla-tion. . . (Romer, 2001, p. 477).’’ Consequently, with higher future expected inflation the long-term rate rises following a rise in the federal funds rate.
Ellingsen and So¨derstro¨m (2001, 2003)extend theRomer and Romer (2000)analysis to consider the effects of changes we have just described, which they term endogenous, and changes that are viewed as shifts in the Federal Reserve’s objectives or preferences, which they term exogenous. Changes viewed as endogenous cause long-term interest rates to move in the same direction as the change in the federal funds rate. Changes viewed as exogenous cause long-term rates to move in the opposite direction – Romer’s original intu-itive view.
Looked at from the standpoint of the work of Romer and Romer and Ellingsen and So¨derstro¨m, our results are consistent with a pattern where Federal Reserve actions were primarily information revealing in the first subperiod but viewed more as shifts in preferences or objectives in the second subperiod. Romer and Romer’s (2000) empirical results indicate that Federal Reserve actions were more revealing of information concerning inflation for sample periods that included our first subperiod (Table 7, p. 446).
4.2. Literature on the changing US business cycle
There is a recent literature documenting a decline in output and inflation volatility beginning in the early 1980s, at about the breakpoint between our first and second subs-amples. Examples of this literature areKim and Nelson (1999), Stock and Watson (2002, 2003), Boiven and Giannoni (2002), Taylor (2000), and McConnell and Perez-Quiros (1998). There is considerable disagreement on the role of a change in the monetary policy regime in explaining the increased stability of the macroeconomy.Taylor (2000), for exam-ple, sees improved monetary policy as the key factor.Stock and Watson (2003)believe that improved monetary policy explains only a ‘‘small fraction’’ of the improvement with ‘‘unusually quiescent macroeconomic shocks’’ explaining much of the change. Kahn et al. (2002)conclude that monetary policy played the primary role in reducing the vola-tility of inflation but not output.
Changes in the response of market interest rates to federal funds rate shocks obviously are interrelated to these broader structural changes. A scenario of improved monetary pol-icy explaining lower inflation (and output) volatility is consistent with our hypothesis that a change in the monetary policy regime anchored inflationary expectations and thus reduced the sensitivity of long-term interest rates to changes in the federal funds rate. An alternative scenario where the change in the monetary policy regime lowered mean inflation while perhaps other factors reduced inflation and output variance, is also consis-tent with our hypothesis.
5. Conclusion
Impulse response functions reported in Section3indicate that for the period 1975–2002 (or 1973–2002) monetary policy shocks, measured as innovations in the federal funds rate, have initial effects in the same direction on longer-term interest rates as measured by the 1-year and 10-1-year government security rates. The effect on the 1-1-year rate is greater in mag-nitude than is that for the 10-year rate.
Results for impulse response functions and from variance decompositions indicate, how-ever, that effects of innovations in the federal funds rate on these longer-term interest rates varied across the subperiods that were considered. Specifically, while innovations in the fed-eral funds rate initially moved longer-term interest rates in the same direction the movements were smaller and less persistent in the post relative to the pre-1979 subperiod. Moreover, in the post-1979 period, after an initial movement in the same direction the impulse response functions indicate that an innovation in the federal funds rate then causes the longer-term interest rate to move in the opposite direction. A positive innovation in the federal funds rate leads, for example, to a short-lived increase in either the 1- or 10-year rate followed by a longer period where these longer-term rates decline relative to their initial values.
Impulse response functions and variance decompositions for the years of Arthur Burns’s chairmanship are quite similar to those for the pre-1979 period, most of which was the Burns period. The Volcker and Greenspan chairmanships are both post-1979. Impulse response functions for the Volcker period, however, show a relatively larger and more persistent movement of the long-term rate in the same direction as the innova-tion in the federal funds rate and less evidence of a reversal of this effect than do those for the Greenspan period. Still, impulse response functions and variance decompositions for the Volcker and Greenspan period are consistent with the smaller effects on longer-term interest rates of innovations in the federal funds rate post-versus pre-1979.
Based on the discussion in Sections1 and 2.2, our interpretation of this time variation in the effect of monetary policy shocks is that it reflects the influence of monetary policy regime changes. The increased emphasis on an inflation goal in the post-1979 period more firmly anchored the inflationary expectations of market participants. Monetary policy shocks in the post-1979 period therefore had less effect on expected future short-term inter-est rates and therefore on long-term interinter-est rates.
References
Akhtar, M.A., 1995. Monetary policy and long-term interest rates: A survey of empirical literature. Contemporary Economic Policy 13, 110–130.
Blanchard, O., 2000. Macroeconomics, second ed. Prentice-Hall, New York.
Boiven, J., Giannoni, M., 2002. Assessing changes in the monetary transmission mechanism: A var approach. Federal Reserve Bank of New York Economic Policy Review, 97–111.
Clarida, R., Gali, J., Gertler, M., 2000. Monetary policy rules and macroeconomic stability: Evidence and some theory. Quarterly Journal of Economics 115, 147–180.
Cook, T., Hahn, T., 1989. The effect of changes in the federal funds rate target on market interest rates in the 1970s. Journal of Monetary Economics 24, 331–351.
Ellingsen, T., So¨derstro¨m, U., 2001. Monetary policy and market interest rates. American Economic Review 91, 1594–1607.
Ellingsen, T., So¨derstro¨m, U., 2003. Why are long rates sensitive to monetary policy, Working Paper, Stockholm School of Economics.
Evans, C.L., Marshall, D.A., 1998. Monetary policy and the term structure of nominal interest rates: Evidence and theory. Carnegie Rochester Series on Public Policy 49, 53–111.
Froyen, R.T., Waud, R.N., 2002. The determinants of federal reserve policy actions: A re-examination. Journal of Macroeconomics 24, 413–428.
Kahn, J.A., McConnell, M.M., Perez-Quiros, G., 2002. On the causes of the increased stability of the U.S. economy. Federal Reserve Bank of New York, Economic Policy Review, 183–202.
Kim, C.J., Nelson, C.R., 1999. Has the U.S. economy become more stable? A Bayesian approach based on a Markov-switching model of the business cycle. The Review of Economics and Statistics 81, 608–616. Kozicki, S., Tinsley, P.A., 2001a. Shifting endpoints in the term structure of interest rates. Journal of Monetary
Economics 47, 613–652.
Kozicki, S., Tinsley, P.A., 2001b. Term structure views of monetary policy under alternative models of agents expectations. Journal of Economic Dynamics and Control 25, 149–184.
Kuttner, K.N., 2001. Monetary policy surprises and interest rates: Evidence from the fed funds futures market. Journal of Monetary Economics 47, 523–544.
Lutkepohl, H., Reimers, H., 1992. Impulse response analysis of cointegrated systems. Journal of Economic Dynamics and Control 16, 53–78.
McConnell, M.M., Perez-Quiros, G., 1998. Output fluctuations in the united states: what has happened since the early 1980’s? Federal Reserve Bank of New York, Staff Reports.
McMillin, W.E., 2001. The effects of monetary policy shocks: Comparing contemporaneous versus long-run identifying restrictions. Southern Economic Journal 67, 618–636.
Mehra, Y.P., 1996. Monetary policy and long-term interest rates. Federal Reserve Bank of Richmond, Economic Quarterly 82, 27–49.
Roley, V. Vance, Sellon, G.H., 1995. Monetary policy actions and long-term interest rates. Federal Reserve Bank of Kansas City Review 80 (Fourth Quarter), 75–89.
Romer, C., Romer, D.M., 2000. Federal reserve information and the behavior of interest rates. American Economic Review 90, 429–457.
Romer, D.M., 2001. Advanced Macroeconomics, second ed. McGraw Hall, New York.
Sims, C.A., Stock, J.H., Watson, M.W., 1990. Inference in linear time series models with unit roots. Econometrica 58, 113–144.
Sims, C.A., Zha, T., 1999. Error bands for impulse responses. Econometrica 5, 1113–1155.
Stock, J.H., Watson, M.W., 2002. Has the business cycle changed and why? Macroeconomics Annual, 159–218. Stock, J.H., Watson, M.W., 2003. Has the business cycle changed? Evidence and explanations. In: Monetary
Policy and Uncertainty, Federal Reserve Bank of Kansas City, pp. 9–53.
Taylor, J.B., 1999. A historical analysis of monetary policy rules. In: Taylor, John B. (Ed.), Monetary Policy Rules. University of Chicago Press, Chicago.
Taylor, J.B., 2000. Panel discussion on ‘‘Recent changes in trend and cycle’’, Federal Reserve Bank of San Francisco Conference ‘‘Structural change and monetary policy’’.
Thornton, D.L., 1998. Tests of the market’s reaction to federal funds rate target changes. Federal Reserve Bank of St. Louis Review 80, 25–36.