a thesis
submitted to the department of computer engineering
and the institute of engineering and science
of bilkent university
in partial fulfillment of the requirements
for the degree of
master of science
By
Zeynep C
¸ ipilo˘
glu
May, 2010
Asst. Prof. Dr. Tolga K. C¸ apın(Advisor)
I certify that I have read this thesis and that in my opinion it is fully adequate, in scope and in quality, as a thesis for the degree of Master of Science.
Prof. Dr. B¨ulent ¨Ozg¨u¸c
I certify that I have read this thesis and that in my opinion it is fully adequate, in scope and in quality, as a thesis for the degree of Master of Science.
Asst. Prof. Dr. H¨useyin Boyacı
Approved for the Institute of Engineering and Science:
Prof. Dr. Mehmet B. Baray Director of the Institute
ENHANCING DEPTH PERCEPTION IN COMPUTER
GRAPHICS
Zeynep C¸ ipilo˘glu
M.S. in Computer Engineering Supervisor: Asst. Prof. Dr. Tolga K. C¸ apın
May, 2010
Rapid progress in 3D rendering and display technologies brings the problem of better visualization of 3D content. Providing correct depth information and en-abling the user to perceive the spatial relationship between the objects is one of the main concerns during the visualization of 3D content.
In this thesis, we introduce a solution that can either be used for automatically enhancing the depth perception of a given scene, or as a component that suggests suitable rendering methods to application developers.
In this novel solution, we propose a framework that decides on the suitable depth cues for a given 3D scene and the rendering methods which provide these cues. First, the system calculates the importance of each depth cue using a fuzzy logic based algorithm which considers the user’s tasks in the application and the spatial layout of the scene. Then, a knapsack model is constructed to keep the balance between the rendering costs of the graphical methods that provide these cues and their contribution to depth perception. This cost-profit analysis step selects the proper rendering methods for the given scene.
In this work, we also present several objective and subjective experiments which show that our automated depth perception enhancement system is statistically (p < 0.05 ) better than the other method selection techniques that are tested.
Keywords: Depth perception, depth cues, cue combination, computer graphics, perceptually-aware rendering.
B˙ILG˙ISAYAR GRAF˙I ˘
G˙INDE DER˙INL˙IK ALGISININ
ARTIRILMASI
Zeynep C¸ ipilo˘glu
Bilgisayar M¨uhendisli˘gi, Y¨uksek Lisans Tez Y¨oneticisi: Asst. Prof. Dr. Tolga K. C¸ apın
Mayıs, 2010
3B g¨or¨unt¨uleme ve ekran teknolojilerindeki hızlı geli¸sim, 3B g¨orsel i¸ceri˘gin uy-gun ¸sekilde sunulması problemini de beraberinde getirmektedir. 3B bilgisayar g¨or¨unt¨uleri ¨uretilirken, kullanıcının nesnelerin uzamsal ¨ozelliklerini do˘gru olarak algılayabilmesini kolayla¸stırmaya dikkat edilmelidir.
Bu tezde ¨onerilen ¸c¨oz¨um, verilen bir 3B sahnede derinlik algısının otomatik olarak iyile¸stirilmesinde ya da 3B uygulama geli¸stiricilere derinlik algısının artırılması i¸cin uygun g¨or¨unt¨uleme y¨ontemlerinin ¨onerilmesinde bir ara¸c olarak kullanılabilir.
Sunulan ¸c¨oz¨umde, verilen 3B sahne i¸cin uygun olan derinlik ipu¸cları ve bu ipu¸clarını sa˘glayan g¨or¨unt¨uleme y¨ontemleri otomatik olarak belirlenmektedir.
¨
Oncelikle, bulanık mantık tabanlı bir algoritmayla, verilen sahne i¸cin her bir ipucunun ¨onem derecesi, uygulamanın amacı ve sahnenin uzamsal ¨ozellikleri g¨oz ¨on¨unde bulundurularak hesaplanmaktadır. Daha sonra, ¨onemli derin-lik ipu¸clarını sa˘glayan grafiksel g¨or¨unt¨uleme y¨ontemlerinin maliyetlerini ve derinlik algısına katkılarını dengelemeye y¨onelik olarak bir knapsack modeli olu¸sturulmaktadır. Bu kar-zarar analizi sayesinde derinlik algısını artırma ama¸clı grafiksel y¨ontemlerden verilen sahne i¸cin uygun olanları belirlenmektedir.
Bu ¸calı¸smada ayrıca, ¨onerilen otomatik derinlik algısı iyile¸stirme sisteminin test edilen di˘ger y¨ontem se¸cim tekniklerine g¨ore istatistiksel olarak (p<0.05 ) daha ba¸sarılı oldu˘gunu g¨osteren birka¸c nesnel ve ¨oznel kullanıcı testine de yer ver-ilmektedir.
Anahtar s¨ozc¨ukler : Derinlik algısı, derinlik ipu¸cları, ipucu birle¸smesi, bilgisayar grafi˘gi, algıya dayalı g¨or¨unt¨uleme.
First of all, I would like to express my sincere gratitude to my supervisor Asst. Prof. Dr. Tolga C¸ apın for his endless support, guidance, and encouragement.
I would also like to thank to my jury members, Prof. Dr. B¨ulent ¨Ozg¨u¸c and Asst. Prof. Dr. H¨useyin Boyacı for spending their time to read and evaluate this thesis.
Special thanks to my family for their endless support and patience during my education.
I am also grateful to my friends for their friendship and patience during the user experiments. Especially, thanks to Abdullah B¨ulb¨ul, for his support during all phases of this study.
Finally, I would like to thank to T ¨UB˙ITAK-B˙IDEB and EU 7th Framework “All 3D Imaging Phone” Project for the financial support during my M.S. study.
1 Introduction 1
2 Background 5
2.1 Depth Perception . . . 5
2.1.1 Depth Cues . . . 5
2.1.2 Depth Cues in Combination . . . 14
2.2 Depth Perception in Computer Graphics . . . 18
2.2.1 Depth Enhancement Methods . . . 19
2.2.2 Depth Enhancement Methods in Combination . . . 29
3 System for Enhancing Depth Perception 31 3.1 General Architecture . . . 31 3.2 Cue Prioritization . . . 33 3.2.1 Fuzzification . . . 34 3.2.2 Inference . . . 41 3.2.3 Defuzzification . . . 43 vi
3.3 Method Selection . . . 46
3.4 Methods for Enhancing Depth Perception . . . 51
4 Experiments and Evaluations 65
4.1 Objective Experiment . . . 65
4.2 Subjective Experiments . . . 69
4.3 General Discussion . . . 73
5 Conclusion 76
A A Short Fuzzy Logic Tutorial 84
2.1 Occlusion depth cue. (The left rectangle is perceived furhtest and the right one is perceived closest.) . . . 6
2.2 Shadow depth cue. . . 7
2.3 Linear perspective depth cue. . . 7
2.4 Size gradient depth cues. Left: relative size (the largest rectangle may seem closest), Right: familiar size (the lower bug seems closer than the elephant). . . 8
2.5 Relative height depth cue. (Painting on the right: “The Coast of Protrieux” by Eugene Boudin) . . . 8
2.6 Texture gradient depth cue. . . 9
2.7 Relative brightness depth cue. (On the upper part, the bright-est rectangle is perceived closbright-est; on the lower part, the darkbright-est rectangle is perceived closest.) . . . 9
2.8 Aerial perspective. . . 10
2.9 Illustrations of depth of focus depth cue. . . 10
2.10 Spheres with different shading models to illustrate the shading depth cue. Left to right: flat shading, Phong shading, Cook-Torrance Shading, Gooch shading. . . 11
2.11 Accommodation depth cue. (Left: The eye lens is distorted to see a close object, right: the eye lens is distorted to see a further object.) 12
2.12 Convergence depth cue. . . 12
2.13 Binocular disparity depth cue. . . 13
2.14 Motion parallax depth cue. . . 14
2.15 Kinetic depth cue. . . 14
2.16 An example of cue conflict. . . 15
2.17 The effectiveness of depth cues as a function of distance [41]. . . . 18
2.18 Dropping lines to the ground as an artificial depth cue [53]. . . 20
2.19 Left ro right: traditional texture mapping, normal mapping, par-allax mapping. . . 21
2.20 Relief mapping example [38]. . . 22
2.21 Left: Phong shading. Right: ambient occlusion. (The 3D model is Hebe.3ds from the sample models of AMD RenderMonkey.) . . . 24
2.22 Left: regular diffuse plus specular shading. Right: vicinity shad-ing. ( c 2003 IEEE. This figure has been taken from A. J. Stewart, “Vicinity Shading for Enhanced Perception of Volumetric Data,” Proceedings of the 14th IEEE Visualization, page 47, 2003 [48].) . . . 24
2.23 Left: Phong shading. Right: cool-to-warm shading. . . 25
2.24 Halo effect (Left: without halos, Right: with halos). ( c 2007 IEEE. This figure has been taken from S. Bruckner and E. Groller, “Enhancing depth-perception with flexible volumetric halos,” IEEE Transactions on Visualization and Computer Graphics, 13(6): 1344-1351, 2007 [5].) . . . 27
2.25 Result of depth-of-field method by Kraus and Strengert [27].
( c 2007 Wiley-Blackwell. This figure has been taken from M. Kraus and M. Strengert, “Depth-of-field rendering by pyramidal image processing,”
Com-puter Graphics Forum, 26: 645-654.) . . . 28
2.26 Cyclopean scale [54]. . . 29
3.1 General Architecture of the System. . . 32
3.2 Fuzzy Cue Prioritization Stage. . . 33
3.3 Membership functions. . . 35
3.4 A decision tree-like structure for the shadow related rules in Table 3.5. 43 3.5 A sample output of the system for shadow depth cue. . . 45
3.6 Demonstration of the fuzzy cue prioritization stage on shadow depth cue. . . 46
3.7 Method Selection Stage. . . 48
3.8 Illustration of the shadow map. . . 52
3.9 Shadow map method. (Left: original scene, Right: the scene with shadows) . . . 52
3.10 Effect of the fog rendering method. (Left: original scene, Middle: the scene with linear fog, Right: the scene with exponential fog) . 54 3.11 Effect of the Gooch shading method. (Left: original scene, Right: Gooch shaded scene.) . . . 56
3.12 Effect of the proximity luminance method. (Top-left: original scene, top-right: only saturation is changed, bottom-left: only lu-minance is changed, bottom-right: both saturation and lulu-minance are changed with the distance.) . . . 57
3.13 Effect of the boundary enhancement method. (Left to right: orig-inal scene, spatial impotance function, contrast enhanced scene.) . 59
3.14 Face tracking: system architecture. . . 59
3.15 Demonstration of the face tracker in a camera application. (Left: The user looks at the scene from left. Right: The user looks at the scene from right.) . . . 61
3.16 Demonstration of the face tracker in a game application. The face tracker is integrated into a sample game from Xith3D toolkit [18]. (Left: The user looks at the scene from left. Right: The user looks at the scene from right to see around the corner.) . . . 62
3.17 Multi-view rendering process. (The images are taken from the sample images of i-Art Auto3D Viewer tool.) . . . 64
4.1 Left: The scene used in the objective experiment. (Red bars show the boundaries in z and blue bars show the boundaries in y.) Right: Submission of the results. . . 66
4.2 RMS errors for the objective depth judgement test. . . 68
4.3 Results of the reliability analysis. . . 69
4.4 Left: The scene (without cues) for depth judgement task. Right: The scene (without cues) for shape judgement task. . . 70
4.5 Submission of the results. . . 71
4.6 Experimental results for subjective depth judgement. (Error bars show the 95% confidence intervals.) . . . 72
4.7 Experimental results for subjective shape judgement. (Error bars show the 95% confidence intervals.) . . . 73
4.8 Left: Original scene. Right: The scene with enhanced depth per-ception. . . 75
A.1 A Fuzzy Logic System. . . 84
A.2 A Simple FLS to Control an Air Conditioner. . . 85
A.3 Membership Functions for T(temperature) = {too-cold, cold, warm, hot, too-hot}. . . 86
A.4 Different Types of Membership Functions. . . 87
2.1 Categorization of the depth cues. . . 6
2.2 Depth perception enhancement methods according to depth cues. 19 3.1 Linguistic variables and terms used for task input variables. . . . 37
3.2 Linguistic variables and terms used for distance input variables. . 38
3.3 Linguistic variables and terms used for scene input variables. . . . 39
3.4 Fuzzy logic operators used in the evaluation of the rules. . . 42
3.5 Sample fuzzy rules for shadow depth cue. . . 42
3.6 Linguistic variables and terms used for cue output variables. . . . 44
3.7 Rendering methods corresponding to the depth cues. . . 47
3.8 Parameters used in fog equations. . . 53
3.9 Parameters used in Gooch shading. . . 55
3.10 Parameters used in interlacing equations. . . 63
4.1 Results of the t-test for objective depth judgement experiment. . . 69
4.2 Results of the t-test for subjective depth judgement experiment. . 72
4.3 Results of the t-test for subjective shape judgement experiment. . 73
A.1 Sample fuzzy rules for air conditioner system. . . 87
A.2 Fuzzy matrix example. . . 88
A.3 Fuzzy set operations. . . 88
A.4 Accumulation methods. . . 89
A.5 Defuzzification algorithms [1]. . . 90
Introduction
Motivation
3D rendering methods and display technologies such as head-mounted displays and autostereoscopic displays have advanced significantly in the past few years. This rapid development in the 3D technology also brings the need of better visu-alization of the 3D content. People desire to see realistic scenes and feel as if they were present in the virtual environment, especially when they are playing games or watching 3D movies. Another application area of 3D computer-generated im-agery is Information Visualization. Presenting the information effectively is the main concern of the Information Visualization field. Therefore, usage of the third dimension in an effective manner becomes very important.
It is known that “what is perceived” is more important than “what is dis-played”. Poorly designed 3D contents will have a strong negative effect on what is perceived. In addition, incorrect usage of depth will also lead to physiological problems such as eye strain. Ware emphasizes the significance of depth perception in Information Visualization as follows [53]:
“It is inevitable that there is now an abundance of ill conceived 3D design, just as the advent of desktop publishing brought poor use of typog-raphy and the advent of cheap color brought ineffective and often garish
use of color. Through an understanding of space perception, we hope to reduce the amount of poor 3D design and clarify those instances in which 3D representation is really useful.”
It is clear that providing correct depth information during the design of a 3D scene is very important, however, it is not easy to deal with this additional depth issue for a 3D application designer. It requires understanding of real-life depth cues that are used to perceive the spatial relationships between the objects by the human visual system. Therefore, an automated system for improving the depth perception of an input 3D scene would be very beneficial. In order to develop such a system, an algorithm that combines different depth cues and rendering methods is needed. There are a variety of studies on enhancing depth perception in computer graphics. A number of methods have been proposed to improve depth perception in 3D computer-generated imagery. However, these methods are generally limited and insufficient, since either they are proposed to operate on specific domains or they do not provide a solution to unify different depth enhancement methods appropriately. In conclusion, a comprehensive system that combines existing depth enhancement methods properly according to the given scene is required.
Overview of the System
Our aim is to develop a framework that applies refinements to a given input scene, in order to provide better depth perception. For this purpose, we need an approach to combine the techniques used for depth enhancement. Although the first approach is to provide all possible depth cues at the same time, this is not always the best solution. Providing all the cues may lead to problems such as high computational cost, unnecessary scene complexity, and cue conflicts. Hence, a system designed to enhance depth perception should consider the aspects such as the nature of the task, distance of the objects, other scene attributes and computational costs of the methods.
depth enhancement methods to the scene and preview the effects of these meth-ods. In addition, we present an algorithm that automatically selects the proper methods for the given scene, depending on the task, spatial layout of the scene, and the costs of the rendering methods. The algorithm makes use of fuzzy logic for determining the significance of different depth cues, and knapsack problem for modeling the trade-off between the cost and the profit of a depth enhancement method.
Challenges
Developing a system for enhancing depth perception in computer graphics is a challenging job due to several reasons. First of all, we cannot restrict the problem to only the use of Computer Graphics techniques. It requires a comprehensive investigation of two different domains: Human Visual Perception and Computer Graphics. Furthermore, the principles of the human visual system are not fully understood yet. For instance, there is not a single, accepted model to identify how the human visual system combines different depth cues to obtain a final percept. Thus, adapting the principles of human visual system to Computer Graphics is a challenging task.
Secondly, which depth cues and rendering methods will perform best for the given scene depends on many different factors. The proposed solution should be multidimensional, which considers many aspects such as the target task, spatial layout of the scene, distance of the objects, costs of the methods, capabilities of the devices, and so on.
Summary of the Contributions
The contributions of this thesis can be summarized as follows:
• A survey on the visual cues that are used to perceive the spatial relationship between the objects in 3D by the human visual system, the combination models for these depth cues, and rendering methods that provide these cues in computer-generated imagery,
enhancement methods on a given scene, using a simple graphical user in-terface,
• A fuzzy logic based algorithm for automatically determining the proper depth cues for the given scene and task,
• A knapsack model for selecting proper depth enhancement methods, eval-uating the cost and profit of these rendering methods,
• Demonstration of different rendering methods that are used for improving depth perception in computer-generated imagery,
• An experimental study to evaluate the effectiveness of the proposed algo-rithms.
Outline of the Thesis
• Chapter 2 presents a comprehensive investigation of the previous work on the topic of Depth Perception, from the perspectives of Human Perception and Computer Graphics fields.
• In Chapter 3, our proposed system for enhancing the perception of depth in an input 3D scene is explained in detail.
• Chapter 4 contains the results of an experimental evaluation of the proposed depth enhancement system.
• Chapter 5 concludes the thesis with a summary of the current system and future directions for the improvements on this system.
Background
This chapter is mainly divided into two sections. In the first section, the principles of depth perception are investigated from the Perception point of view, while the second section presents the application of these perceptual principles to Computer Graphics.
2.1
Depth Perception
2.1.1
Depth Cues
Depth cues, which help the human visual system to perceive the spatial relation-ships between the objects in 3D, construct the core part of the depth perception. These visual cues can be categorized as pictorial, oculomotor, binocular, and motion-based cues. These depth cues are shown in Table 2.1 and explained in detail in the subsequent parts, based on the studies by Howard and Rogers [17], Shirley [47], and Ware [53].
Table 2.1: Categorization of the depth cues.
Pictorial Oculomotor Binocular Motional Occlusion Accommodation Binocular disparity Motion parallax Cast shadow Convergence Motion perspective Linear perspective Kinetic depth Size gradient Relative height Texture gradient Relative brightness Aerial perspective Depth of focus Shading Pictorial Cues
Pictorial cues are the cues that are generally used by artists to provide 3D effect in 2D paintings.
Occlusion: Occlusion, also known as interposition, is the most basic depth cue which arises when an object occludes another object (Figure 2.1). When an object overlaps some part of the other, it is known that the object that is blocked is further. Interposition only gives binary information about the depth order of the objects; it does not provide information about the magnitude of the depth.
Figure 2.1: Occlusion depth cue. (The left rectangle is perceived furhtest and the right one is perceived closest.)
Cast shadow: Shadows also give information about depth. If the object is in shadow, it is further from the light source. When the object moves away from
the light source, it gets darker. The number and position of light sources are also effective on the perception of depth. Shadows of the objects on the ground facilitate the perception of the objects’ relative positions by connecting them to the ground plane (Figure 2.2). While interpreting shadows, two important assumptions of the human visual system should be considered: “single, stationary light source” and “light-from above” assumptions. In other words, the human visual system assumes that there is a single, stationary light source and the illumination direction is from above, while interpreting the scenes [17].
Figure 2.2: Shadow depth cue.
Linear perspective: In real life, parallel lines seem converging, as they move away, towards the horizon. This is known as linear perspective. Linear perspective is obtained by perspective projection, which scales the image by the inverse of the depth while projecting it onto its corresponding location on the projection plane. Linear perspective helps to perceive the surface inclination especially when it is textured. Moreover, a perspective ground plane aids to understand the relative positions of the objects above it. (See Figure 2.3.)
Figure 2.3: Linear perspective depth cue.
Size gradient: The size of an object is inversely proportional to the distance from the viewer. In other words, larger objects may seem closer to the viewer. There-fore, the relative distance can be inferred from the size of the objects, when the
objects are of the same type. This is known as “relative size” (Figure 2.4). “Fa-miliar size” is another type of size gradient depth cue. In this type, “relative size” interpretation is combined with the previous knowledge about the sizes of the known objects to estimate the absolute depths of the objects. For example, people generally know the size of a car relative to a person and if the absolute distance of a human in an image is known, the absolute distance of the car in that image can be inferred from the previous knowledge about the size of a car and a human. However, according to Howard and Rogers, only long term familiarity is effective [17].
Figure 2.4: Size gradient depth cues. Left: relative size (the largest rectangle may seem closest), Right: familiar size (the lower bug seems closer than the elephant).
Relative height: The objects that are higher in the visual field are perceived as distant (left of Figure 2.5). For instance, Roelofs and Zeeman report that the lower one among two equal circles appears closer and smaller, when there is no other source of depth information [17]. When the world is divided by a horizon line; for the objects under the horizon, the objects that are closer to the horizon seem further. On the other hand, above the horizon line, the objects closer to the horizon seem closer. In the right of Figure 2.5, the clouds that are higher in the visual field seem closer.
Figure 2.5: Relative height depth cue. (Painting on the right: “The Coast of Protrieux” by Eugene Boudin)
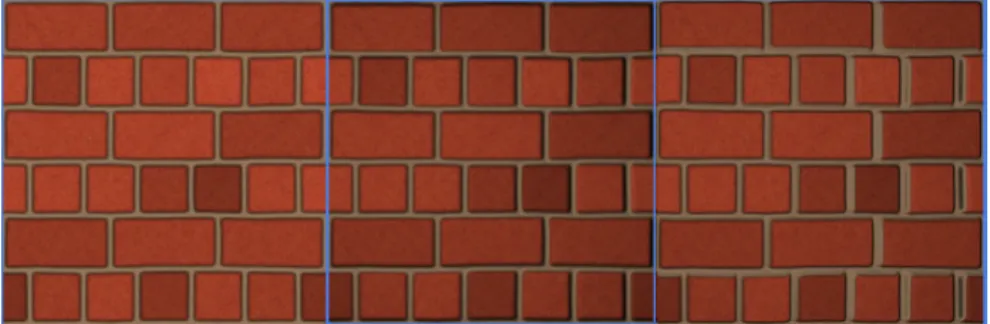
Texture gradient: In textured surfaces, when the surface gets further away, the texture becomes smoother and finer (Figure 2.6). Texture elements are spaced more densely with the increasing distance. Hence, texture gradient is helpful es-pecially for perceiving the shape and slant of a surface. According to the experi-ments by Gibson, perceived inclination of a surface increased with the increase in texture gradient and this effect is more obvious for regular textures than irregular textures [17].
Figure 2.6: Texture gradient depth cue.
Relative brightness: The intensity level of an object varies with depth. Brighter objects are prone to be seen closer to the viewer. Hence, by comparing the inten-sities of the objects, relative depth information can be obtained. The brightness level of an object approaches to the background as its distance to the viewer increases. For instance, in a dark environment, as the distance to the viewer increases, the object gets darker; conversely, if the background color is bright, further objects seem brighter. (See Figure 2.7)
Figure 2.7: Relative brightness depth cue. (On the upper part, the brightest rectangle is perceived closest; on the lower part, the darkest rectangle is perceived closest.)
Aerial perspective: Atmospheric scattering reduces the brightness and the con-trast in the distant parts of the scene. In other words, in a natural scene, further objects seem hazy and bluish due to the scattering of the light in the atmosphere. Hence, aerial perspective primarily increases the perceived distance. It may affect the perception in different ways, however: it may obscure the texture gradient or it may cause an object to be seen closer and larger by blurring the borders of the object [17]. (See Figure 2.8.)
Figure 2.8: Aerial perspective.
Depth of focus: In essence, depth of focus is a term used in optics. The depth of focus of an eye lens is defined as “the range over which objects are in focus when the eye is adjusted for a particular distance” [53]. Our eyes fixate on different objects in the world to bring them to sharp focus. The objects other than the object in the sharp focus seem blurry. Ordinal information about the spatial relationship of the objects can be obtained from this property. (See Figure 2.9.)
Figure 2.9: Illustrations of depth of focus depth cue.
Shading: Shading is defined as “the variation in irradiance from a surface due to changes in the orientation of the surface to the incident light and/or variations in specularity” [17]. Shading provides important information about the surface shape by enabling the observer to distinguish between convexities and concavities; because the shade of a surface depends on the viewpoint, orientation with respect to the light source, and surface reflectance characteristics [47]. The number of
light sources is also effective in perceiving the surface shape. The process of shape perception from shading is known as “shape-from-shading”. However, shading is assumed to give ambiguous depth information when used alone [17]. It requires knowledge about the direction of illumination. The human visual system has a prior of a simple lighting model with a single, stationary light source located left-above [17]. In Figure 2.10, spheres with different shading models are shown. As shown in the figure, the specularity, transparency, and other shading-related properties of the spheres affect the perceived convexity/concavity of the objects in different ways.
Figure 2.10: Spheres with different shading models to illustrate the shading depth cue. Left to right: flat shading, Phong shading, Cook-Torrance Shading, Gooch shading.
Oculomotor Cues
Depth cues that are caused by the muscular control of the eye lens are known as oculomotor cues.
Accommodation: The process of the distortion in the eye lens to fixate on a point is called accommodation. The amount of accommodation that the eye lens performs to focus on an object varies with depth. In a limited range, absolute depth information can be obtained using the accommodation of the eye lens. However, this is a weak depth cue and ineffective beyond about 2m [47]. (See Figure 2.11.)
Figure 2.11: Accommodation depth cue. (Left: The eye lens is distorted to see a close object, right: the eye lens is distorted to see a further object.)
Convergence: Convergence, or vergence, is another oculomotor cue which strongly interacts with the accommodation. It is the fixation of the eyes towards a single location in space in order to maintain a single binocular vision. Also, the angle between the eye and the focus point, which is shown as θ in Figure 2.11 is called as convergence angle. The increase in the convergence angle indicates that the fixation point comes closer (Figure 2.12). In the human visual system, accommo-dation helps to determine the convergence angle, and convergence angle assists in setting the focal length [47].
Figure 2.12: Convergence depth cue.
Binocular Cues
Binocular disparity: Left and right eyes look at the world from slightly different angles, which results in slightly different retinal images (Figure 2.13). This pro-vides binocular vision. This is a very strong cue that propro-vides true 3D vision, unlike pictorial cues. However, binocular disparity becomes ineffective for far distances. The human visual system is able to match the points in one retinal
image to the corresponding points in the other retinal image, which is referred to as correspondence process [47]. In order to completely match the two retinal im-ages, the disparity between the two images should not exceed a threshold value. If the disparity becomes large, double vision called diplopia occurs. According to Patterson and Martin, the maximum disparity before the fusion breaks down is only 1/10 degree [53].
Figure 2.13: Binocular disparity depth cue.
Motional Cues
When an object or the viewer himself is moving, the retinal image will change due to the motion. From the difference in the retinal images during motion, some clues about the depth can be obtained. Understanding the relative depth and shape of the objects using this type of motion-related depth cues is known as motion [53]. According to Rogers and Graham, structure-from-motion cues are at least as important as binocular disparity in providing depth information [53]. There are different kinds of structure-from-motion cues:
Motion parallax: As the user moves his eyes side to side, the images of the closer objects move more in the visual field than those of further objects. This is because the angular speed of an object is inversely related to the distance from the viewer. In Figure 2.14, the angular velocity (α) of the closer (blue) object is greater than the angular velocity (Θ) of the further (red) object. As an example, in a moving car, close objects such as trees translate very fast, while further objects such as mountains move slowly.
Figure 2.14: Motion parallax depth cue.
Motion perspective: Motion perspective is very similar to motion parallax. This time, the user is stationary and the objects are moving. In this scenario, the velocity of the retinal images of the further objects seem slower than the near objects.
Kinetic depth: Motion can also be used in perceiving the three-dimensional shape of an object, if there is a rotation around an axis perpendicular to the direction of view [47]. This is called kinetic depth effect. The overall shape of an arbitrary object can be perceived better when it rotates around its local axis, since the ambiguities due to the projection from 3D to 2D are resolved with the rotation (Figure 2.15). While interpreting the shape of an object, the human visual system assumes that the object is rigid [53].
Figure 2.15: Kinetic depth cue.
2.1.2
Depth Cues in Combination
In the field of human visual perception, how the human visual system unifies different sources of depth cues into a single knowledge is a widely-investigated topic. Many studies have investigated the interaction of different cues. There is
not a single, accepted cue combination model, however.
Cue Combination Models
The mostly-accepted models of cue interaction are generally the variations of the following categories: cue averaging, cue dominance, cue specialization, range extension, and probabilistic models [17].
Most of the research on cue combination focuses on the cue averaging models, in which each cue is associated with a weight determining its reliability. The overall perception is obtained by summing up the individual depth cues multiplied by their weights [17]. Maloney and Landy [30] and Oruc et al. [40] present a weighted-linear combination model based on the cue summation and averaging models. A more specialized form of linear combination is presented by Clark and Yuille [9] by distinguishing between weak and strong fusion. In the weak fusion model, the interactions between depth cues are omitted; whereas the strong fusion estimates the nonlinear interactions between the individual cues. Landy et al. suggest the modified weak fusion approach, in which cue interactions are limited to cue promotion [28]. In cue promotion, the cues that do not supply complete depth information are promoted by using information from richer cues [17].
The variations of linear combination models are not designed to handle severe cue conflicts. Cue dominance is a model proposed to consider conflicting situa-tions, by vetoing some sources of information totally [17]. In other words, if two depth cues provide conflicting information, one of them may be suppressed and the final percept may be based on the other cue. For instance, in Figure 2.16, oc-clusion and relative size depth cues give conflicting information about the depth order. In such cases, the judgement is generally based on the occlusion cue.
Figure 2.16: An example of cue conflict.
used for interpreting different components of a stimulus. For instance, when the aim is to detect the curvature of a surface, binocular disparity is more effective; on the other hand, if the target is to interpret the shape of the object, shading and texture cues contribute more to the result [17].
Range extension is another cue interaction type, whose main concern is that different cues may be effective in different ranges. For example, binocular dispar-ity is a strong cue in the near distances, while perspective becomes more effective at far distances.
Lastly, Bulthoff and Yuille present a probabilistic approach to estimate the cue interactions by considering some prior assumptions of the human visual system on the scene and material attributes, using a Bayesian framework [7]. One ex-ample to the prior assumptions of the human visual system is single light source assumption. Rigidity and surface smoothness are other known examples of these prior assumptions. In this Bayesian framework, cues are assumed to be strongly interacting with each other.
Apart from the above cue integration models, there are a variety of experi-mental studies that investigate the interaction between different depth cues. In one of these studies, Hubona investigates the relative contributions of binocular disparity, shadows, lighting, and background scenes to 3D perception [19]. As the most obvious result, he found that stereoscopic viewing strongly improved the depth perception with respect to both accuracy and the response time. On the other hand, there were further interactions between other cues. Mather and Smith focus on stereopsis and image blur cues; and suggest that when both cues are available, stereopsis dominates [34]. Also, they state that image blur is used by the visual system for far distances. Wanger et al. explore the effects of picto-rial depth cues on perceiving the depth, and concludes that the effectiveness of a depth cue is highly affected by the target task [52].
Task-based Depth Perception
A number of researchers establish their work on the cue specialization model described in the previous section and accept the target task as the most significant
factor on determining the visual cues that enhance the depth perception [4, 12, 45, 52]. For instance, according to the experimental results obtained by Wanger et al. [52], shadow and perspective significantly increase the accuracy in positional tasks while perspective decreases the performance in orientation related tasks.
However, the tasks discussed in the above studies are very limited. Ware presents a more comprehensive list of the tasks and a survey of the depth cues according to their effectiveness under these tasks [53]. In his work, the tasks are categorized as listed below. The detailed explanation of these tasks is in Section 3.2.1.
• Tracing data paths in 3D graphs
• Judging the morphology of surfaces and surface target detection • Finding patterns of points in 3D space
• Judging the relative positions of objects in space
• Judging the relative movement of self within the environment • Reaching for objects
• Judging the “up”direction
• Feeling a sense of presence (aesthetic impression) • Navigation (way finding)
For instance, according to his investigations, perspective is a strong cue when the task is “judging the relative positions” or “judging the up direction”; while it becomes ineffective for the tasks “tracing data paths in 3D graphs” and “finding patterns of points in 3D space”. Another example is that stereo viewing is a strong cue for the tasks other than “feeling a sense of presence” when coupled with near vicinity. According to Ware et al., stereoscopic viewing and kinetic depth together significantly increased the accuracy when the task is “tracing data paths in 3D graphs” [55].
Distance-based Depth Perception
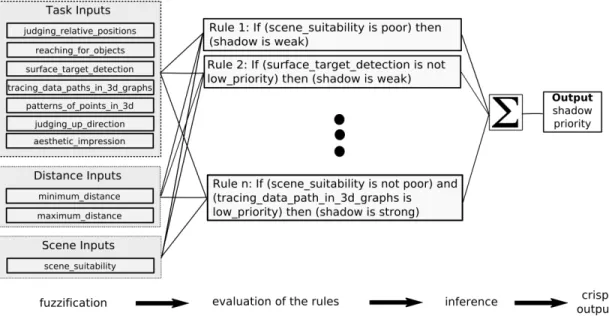
Another factor that determines the effectiveness of a cue is the distance from the viewer to the object of interest, as the range extension models suggest. Cutting and Vishton provide a distance-based classification of depth cues by dividing the space into three ranges and investigating the visual sensitivity of the human visual system to different depth cues in each range [10]. According to his measurements; the strength of the pictorial cues are invariant with the distance; and the effec-tiveness of some of the sources such as binocular disparity, motion parallax, and oculomotor cues are dissipating with the distance; whereas aerial perspective is the only cue that becomes stronger as the distance increases. The effectiveness of each depth cue according to the distance is shown in Figure 2.17.
Figure 2.17: The effectiveness of depth cues as a function of distance [41].
2.2
Depth Perception in Computer Graphics
Based on the depth cues and principles discussed in the previous section, different rendering methods have been developed for enhancing depth perception in 3D rendered scenes.
2.2.1
Depth Enhancement Methods
In this section, we discuss different rendering methods that are used for improving the depth perception in Computer Graphics. Table 2.2 contains a categorization of these methods according to the depth cues they provide. Afterwards, the methods in each category are explained in more detail.
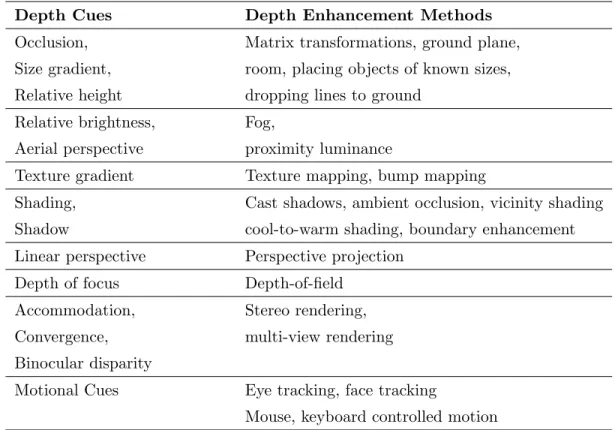
Table 2.2: Depth perception enhancement methods according to depth cues.
Depth Cues Depth Enhancement Methods Occlusion, Matrix transformations, ground plane, Size gradient, room, placing objects of known sizes, Relative height dropping lines to ground
Relative brightness, Fog,
Aerial perspective proximity luminance
Texture gradient Texture mapping, bump mapping
Shading, Cast shadows, ambient occlusion, vicinity shading Shadow cool-to-warm shading, boundary enhancement Linear perspective Perspective projection
Depth of focus Depth-of-field Accommodation, Stereo rendering, Convergence, multi-view rendering Binocular disparity
Motional Cues Eye tracking, face tracking
Mouse, keyboard controlled motion
Occlusion, Size Gradient, Relative Height
It is possible to obtain the cues occlusion, size gradient, and relative height by transforming the objects in the scene. For instance, scaling the size of the objects of interest to occlude the other objects is an example for this kind of transformation [49]. Moreover, for the relative height depth cue, drawing lines from the objects to the ground plane (Figure 2.18) is a commonly-used artificial method to make the height between the object and the ground more visible [53].
A ground plane or a room facilitates the interpretation of the cues relative height and size gradient. In addition, placing objects of known sizes is a technique for enabling the user to judge the sizes of unknown objects more easily [53].
Figure 2.18: Dropping lines to the ground as an artificial depth cue [53].
Another point to consider is that most of the 3D scenes are rendered under perspective projection, which already provides size gradient and relative height cues to some extent. Using additional transformations for size gradient and rela-tive height may damage the understandability of the perspecrela-tive projection and may cause cue conflicts.
Relative Brightness, Aerial Perspective
In order to add atmospheric effects to the graphical contents, it is very com-mon to use fog. Fog is obtained by interpolating the color of a pixel between the surface color and the fog color with respect to the distance of the object [2]. The distant objects are highly exposed to fog when compared to the closer ob-jects. Thus, the effect of the fog increases with the depth. It provides both aerial perspective and relative brightness, since the distant objects seem more hazy and blurry and the contrast decreases with the depth.
To make the relative brightness more obvious, Dosher et al. have proposed another method called proximity luminance covariance, which alters the contrast of the objects in the direction of the background color as the distance increases [53]. Proximity luminance covariance generates an atmospheric effect, as it makes closer objects seem brighter and further objects seem darker. Lastly, cool-to-warm shading, which will be discussed in more detail in the section related to shading cue, also provides atmospheric effects to some extent.
Texture Gradient
In Computer Graphics, surfaces are covered with textures to obtain texture gradient cue. Traditional texture mapping does not need to be discussed here, since there are several bump mapping techniques that improve the surface de-tails and 3D appearance of the objects when compared to ordinary texture map-ping. These techniques are normal, parallax, and relief mapping, which are im-plemented by modifying the per-pixel shading routine.
In normal mapping, a normal map is stored in addition to the actual texture map, to perturb the shade of each pixel according to the normal retrieved from the normal map of that pixel [2]. Parallax mapping improves this idea to provide parallax effect, by enabling the bumps to occlude each other as the user moves [2]. This parallax effect is performed by displacing the texture coordinates ac-cording to the value of the height map at that pixel and the view angle relative to the surface normal [23]. Relief mapping presents more accurate results with self-occlusions, self-shadows, and parallax effect [39]. In this technique, relief textures, which can be considered as extended textures with an orthogonal dis-placement per texel, are converted into ordinary textures using warping equations and mapped to the surface [39]. Figure 2.19 shows a comparison of normal and parallax mapping to the traditional texture mapping and Figure 2.20 shows an example of relief mapping.
Figure 2.19: Left ro right: traditional texture mapping, normal mapping, parallax mapping.
Figure 2.20: Relief mapping example [38].
Shading and Shadows
In visual perception, shading and shadow cues are examined together, since it is difficult to separate them totally. In Computer Graphics, it becomes harder to split them as they both depend on the illumination calculation and most of the shading methods produce shadows at the same time.
Mamassian et al. [31] and Kersten et al. [26] show the effect of moving cast shadows on interpreting the shapes of the objects and the spatial layout of the scene. This interpretation is done based on the idea that cast shadows move according to the movement of four factors: light source, background, object, and viewpoint. The human visual system combines the information from these four sources and infers the spatial layout of the 3D scene.
Therefore, shadows would be a useful tool especially for perceiving the rela-tive positions of the objects. Shadow generation techniques are generally slow, however. For this reason, real-time shadows that are generated by approximation techniques are needed.
One example of approximated shadows is proposed by Zhang and Crawfis [57]. This method keeps an accumulated shadow buffer and uses convolution to splat the shadow across the slices. In addition to saving computational time, this algorithm produces shadows that are visible in the range of 0 and 1, not only 0 or 1.
Another point to consider is the shadow quality. Wanger and Leonard inves-tigate the effects of shadow quality on perceiving the distance, shape and size of objects; and finds no significant effect of the shadow quality on the perception of spatial layout [51]. On the other hand, they claim that soft shadows have a strong negative effect, especially on shape perception tasks. Kersten et al. also support the claim of the ineffectiveness of shadow quality on perception [25]. Thus, com-putationally cheaper hard shadows are generally adequate and more effective for depth perception than expensive soft shadows. On the other hand, the positive effect of the soft shadows on the realism of the scenes should not be oversighted.
Shading is another important cue to aid shape and depth perception. In Com-puter Graphics, there are numerous shading models and techniques. However, most of the time, these models require a complete illumination calculation, which requires high rendering cost. Hence, several techniques have been developed in order to approximate the global illumination calculation for real-time rendering. Some of these techniques, such as ambient occlusion and vicinity shading, are discussed below.
The ambient occlusion technique aims to increase the realism of 3D graph-ics in real time without a complete global illumination calculation. Most of the proposed ambient occlusion methods require pre-computation for the visibility of vertices to each other. Bunnell presents a new technique, dynamic ambient occlusion, for calculating the light transfer from diffuse surfaces using GPU [8]. The algorithm assumes that each polygon mesh is a set of surface elements that can emit, transmit or reflect light. Firstly, the mesh is converted into surface elements, where each vertex is assumed to be a surface element. Then, for each surface element, an accessibility value, which represents the amount of hemisphere above the surface element not occluded by the geometry, is calculated by approx-imation. The surfaces are darkened according to the accessibility values. This method is efficient because it works without calculating the visibility of one ele-ment from another. The effect of this method can be seen in Figure 2.21. Tarini et al. combine this method with edge cueing methods in order to better visualize molecular data in real time [50]. Shanmugam et al. divide the ambient occlusion process into two parallel domains: detailed (high-frequency) domain and distant
(low-frequency) domain. The high-frequency approach uses an image-space ap-proximation for ambient occlusion, whereas the low-frequency approach performs a spherical approximation using the GPU [46].
Figure 2.21: Left: Phong shading. Right: ambient occlusion. (The 3D model is Hebe.3ds from the sample models of AMD RenderMonkey.)
The vicinity shading technique provides perceptual cues on the relative depth, without a complete illumination calculation. Stewart assumes that the perception of a surface is superior under uniform, diffuse lighting compared to point source lighting; and based on this idea, each surface point is shaded according to uniform diffuse lighting that is blocked only in the proximity of that point [48]. Even though vicinity shading seems to provide better perceptual cues, it should also be verified by user experiments. The comparison of the vicinity shading with regular diffuse plus specular shading is shown in Figure 2.22.
Figure 2.22: Left: regular diffuse plus specular shading. Right: vicinity shading.
( c 2003 IEEE. This figure has been taken from A. J. Stewart, “Vicinity Shading for Enhanced Perception of Volumetric Data,” Proceedings of the 14th IEEE Visualization, page 47, 2003 [48].)
also non-photorealistic (NPR) shading models, which aim to provide additional cues about depth. A technique that is commonly used by technical illustrators is known as cool-to-warm shading. According to this method, cool colors (blue tones) are used for the distant objects and warm colors (yellow tones) are used for near objects. This idea is also used by many researchers in computer graphics [13, 14, 42]. Cool-to-warm shading, which is also known as Gooch shading, is performed by interpolating between cool colors to warm colors according to the distance from the light source. This kind of shading provides atmospheric effect on the scene. Figure 2.23 demonstrates the effect of cool-to-warm shading.
Figure 2.23: Left: Phong shading. Right: cool-to-warm shading.
Boundary enhancement using silhouette and feature edges is a commonly-used tool in NPR. There are different methods to extract feature edges of geometrical models. One method uses geometric buffers to store the geometrical properties of an image and takes these G-buffers as input to extract the discontinuities in the image. Nienhaus et al. [37] and Saito et al. [44] use this idea to find silhouette and crease edges in an image. The limitation of this method is that it cannot be applied on transparent images.
Markosian uses another approach based on Appel’s hidden line algorithm, to solve the trade-off between the performance and the accuracy of determining key edges [33]. This method identifies the silhouettes based on a probabilistic approach. Not every silhouette is rendered in every frame, instead, larger silhou-ettes are rendered. A probability value, which is inversely proportional to the dihedral angle of that edge, is assigned to each edge. The edges with the highest probabilities are examined, and when a silhouette edge is found, the adjacent edges are also checked. In this way, checking a small fraction of the edges suffices to detect silhouette edges.
McGuire and Hughes propose a hardware solution for detecting feature edges in terms of local, per-vertex calculations by introducing the “edge mesh”, which packs the information about an edge into the vertex attributes [35]. The edge mesh is calculated in a pre-processing step and sent to the vertex shader to be used in extracting the key edges such as silhouettes, creases, and boundaries. The algorithm requires a pre-processing step and the edge mesh is nine times larger than the original mesh.
The above edge enhancement methods operate on the geometry of the scene elements, and they are highly dependent on the scene complexity. As an alter-native to these methods, an image-space approach is proposed based on the idea of retrieving the depth information from depth buffer, and using this data to enhance the depth effect on these areas in real time. Luft et al. use this idea to enhance images that contain depth information [29]. In this method, the differ-ence between the original and the low-pass filtered depth buffer is computed to find spatially important areas. Then, color contrast on these areas is increased to give better 3D effect. Tarini et al. [50] also employ the depth buffer to perform depth-aware contour lines and contrast changes for increasing the visibility of borders of the atoms in molecular visualization.
Halos are also delegated for enhancing the perception of 3D objects, especially in volume rendering [5, 42]. In the method of Bruckner et al. [5], an interactively defined halo transfer function is used to determine the halo intensities. The method first identifies the regions to emit halo, then generates the halo intensity value field. Afterwards, this intensity field is converted to color and opacity values with the help of a halo profile function. No pre-computation is needed since the halo contribution is computed during the volume rendering. However, which settings of halo intensities perform the best is an open issue. An example of the halo method by Bruckner et al. is shown in Figure 2.24.
Figure 2.24: Halo effect (Left: without halos, Right: with halos). ( c 2007 IEEE. This figure has been taken from S. Bruckner and E. Groller, “Enhancing depth-perception with flexible volumetric halos,” IEEE Transactions on Visualization and Computer Graphics, 13(6): 1344-1351, 2007 [5].)
Linear Perspective
In order to provide linear perspective, perspective projection, in which the sizes of the objects are scaled in an amount inversely proportional to the distance, is used while projecting the 3D scene to 2D screen. Moreover, a ground plane, or a room will reveal the effect of the perspective, especially when the surface is covered with suitable textures such as grid or checkerboard [53].
Depth-of-focus
A method called depth-of-field is used to simulate the depth-of-focus cue. According to this method, objects in the range of focus are rendered sharp, while the objects outside of this range are rendered blurry and the blurriness level increases as the objects get further away from the range of focus. Haeberli and Akeley implement this method by using the accumulation buffer to accumulate the images rendered from various viewpoints across the aperture of the lens [15]. Kraus and Strengert present another solution, which decomposes the original image into several sub-images according to the pixel depth, blurs these sub-images uniformly, and blends the blurred sub-images in back-to-front order to obtain the depth-of-field image [27]. An example application of this method is shown in Figure 2.25.
Figure 2.25: Result of depth-of-field method by Kraus and Strengert [27]. ( c 2007 Wiley-Blackwell. This figure has been taken from M. Kraus and M. Strengert, “Depth-of-field rendering by pyramidal image processing,” Computer Graphics Forum, 26: 645-654.)
Accommodation, Convergence, Binocular Disparity
None of the rendering methods discussed above provides the binocular and oculomotor depth cues when used in 2D displays. In order to obtain these cues, we need an apparatus that provide multiple views of a 3D scene. For this purpose, there are several technologies such as anaglyph glasses, shutter glasses, parallax barrier displays, lenticular displays, holographic displays, and head-tracked dis-plays [11]. These technologies provide at least two different views of the scene and enable binocular and oculomotor cues in computer generated scenes. The principles underlying these technologies are out of the scope of this work and the reader is referred to the references [11] and [16] for further details.
There are not specific methods to provide accommodation and convergence cues in Computer Graphics, since they are related to the muscular control of the eye lens. However, multi-view rendering comprises these cues too. In addition, in order to prevent the eye strain caused by the improper calculation of the camera parameters in multi-view rendering, Ware et al. propose several adjustments. In this work, eye separation is dynamically calculated as a function of depth, and a method called cyclopean scale is used to transform the scene to a proper range where the nearest part of the scene is located just behind the screen [54] (Figure 2.26).
Figure 2.26: Cyclopean scale [54].
Motion Related Cues
The methods used for controlling the motion of the scene objects can be employed in different ways for providing motion parallax, motion perspective, and kinetic depth cues. For instance, rotating an object around its local axis can be used for obtaining kinetic depth effect. Controlling the movement of the scene objects using different input devices such as mouse, keyboard or joystick could provide motion perspective. In addition, tracking the user’s position by head-tracking, eye-tracking or face-tracking and controlling the motion of the scene elements according to the information coming from the position of the user can be a tool for motion parallax.
Bulbul et al. propose a face tracking method to be used as a means for human computer interaction on mobile devices, based on the motion parallax effect [6]. A color-based tracking algorithm is presented in this study, to use the users face position as analogous to the camera position in a 3D graphics application. By this way, the user’s head movements control the position of the camera and a motion parallax effect is obtained by enabling the user to see the scene from different viewpoints. The reader is referred to the survey on face tracking algorithms [32] for different solutions.
2.2.2
Depth Enhancement Methods in Combination
In the previous subsection, we have presented the rendering methods that are used for enhancing depth perception in Computer Graphics. Although these methods provide significant improvements on the depth perception when applied
individually, there are not sufficient studies that concern about the combination of these methods.
Tarini et al. propose a system for enhanced visualization of molecular data [50]. In this work, ambient occlusion and edge cueing schemes, such as depth aware contour lines and halo effect, are applied for molecular visualization. This system provides significant enhancements on visualization; however, it is domain specific and does not concern about how to combine different methods.
Weiskopf and Ertl developed a more comprehensive depth cueing framework based on the principles of color vision [56]. In this study, only color properties such as intensity and saturation are employed for providing depth cues by transforming the color values according to the distance. In addition, they introduce a concept called semantic depth cueing, which applies color transformations to make the important objects more visible.
There are a number of patents in this area. One of these patents presents a framework for integrating some of the monocular depth cues including shading, brightness, occlusion, and image blur [49]. In this method, the original image is segmented and objects are identified as foreground, background, or object of interest. Then, several intermediate images are created. In one of these interme-diate images, the object of interest casts shadow; in the second one, the brightness level of the object of interest is increased; and in the third one, the background and foreground objects are blurred. Lastly, these intermediate images are com-bined and the sizes of the objects of interest are increased to occlude the other objects in the scene [49]. At the end, an image with increased depth effect is produced and the object of interest is made more visible.
As the literature survey indicates, there is a lack of comprehensive frameworks for uniting different methods of depth enhancement. The current solutions are limited, as they are either domain specific or they involve only the combination of several methods. Hence, there is a need for a framework that puts all the depth cues and different rendering methods together in an appropriate manner, to provide better 3D perception.
System for Enhancing Depth
Perception
In this work, we propose a system that enables the 3D graphical application developers to apply different methods of depth perception in an easy way. In this system, the user is able to select the methods he wants to apply and preview the scene with the selected methods using the graphical user interface of the system. Although this functionality facilitates the job of the content creator significantly, this is not the inventive part of the framework. The system we propose presents an algorithm for automatically selecting the proper depth cues for the current scene and the rendering methods that provide these depth cues.
3.1
General Architecture
In the system, while automatically selecting the suitable cues and rendering meth-ods for the given scene, we consider the following factors:
• the distance of the objects in the scene, • important tasks in the application,
• the suitability of the spatial layout of the scene for the cues, • and the costs of the rendering methods.
The system takes the above items as input and calculates the weights of each depth cue. According to the weights of the cues and the costs of the rendering methods, suitable methods for the given scene are determined. Hence, our al-gorithm can be considered as a mixture of the cue averaging, cue specialization, and range extension models of cue combination described in Chapter 2.
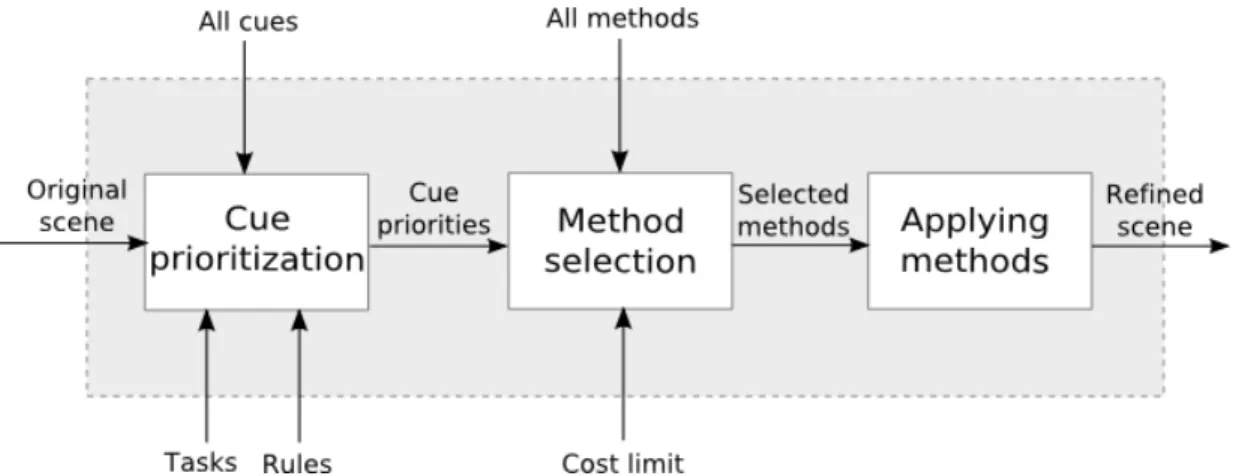
Figure 3.1: General Architecture of the System.
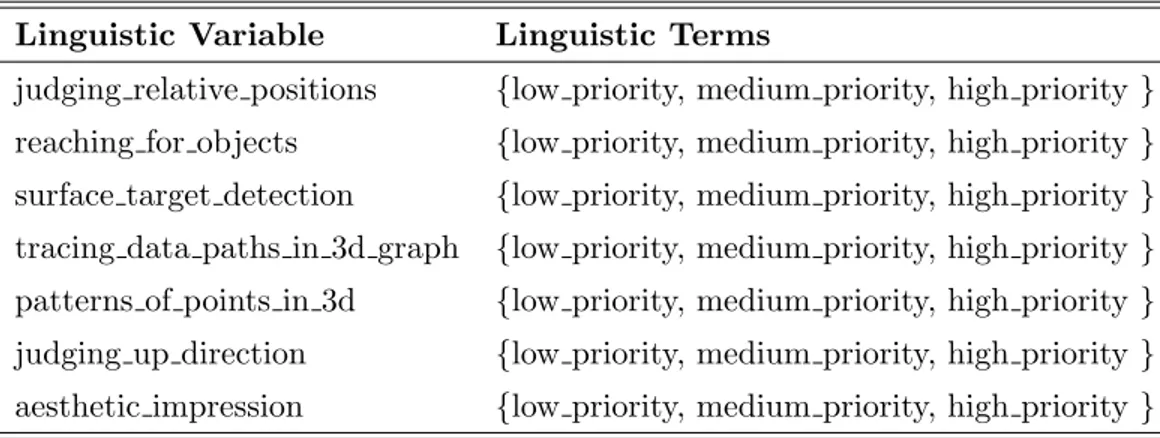
The general architecture of the automatical depth perception enhancement process can be seen in Figure 3.1. Our approach first determines the priority of each depth cue based on the task, distance of the objects and several scene attributes, using fuzzy logic. The next stage is to decide on the rendering methods that provide the cues whose priorities are calculated as high in the previous stage, since there are generally more than one rendering methods that provide the same cue. In this stage, we consider the costs of the methods if there is a cost limitation and try to solve the cost and cue priority trade-off. After selecting the proper rendering methods, we apply these methods to the given scene and produce a refined scene with a better depth perception.
3.2
Cue Prioritization
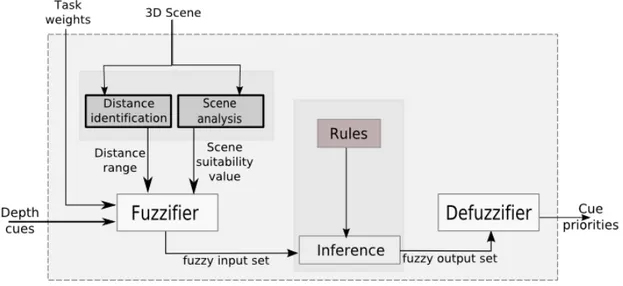
The first stage of our algorithm is cue prioritization as shown in Figure 3.1. The purpose of this stage is to determine which depth cues are appropriate for the given scene. At the end of this stage, a priority value, which represents the effec-tiveness of that cue for the given scene, is assigned to each depth cue; considering the user’s tasks, distance of the objects, and different scene characteristics.General architecture of this stage is shown in Figure 3.2.
Figure 3.2: Fuzzy Cue Prioritization Stage.
The depth cues used in our system are described in detail, in Section 2.1.1. The system maintains a cue priority vector which stores the priority values for each depth cue. The priority values are in the range of (0, 1) and all the cues have 0 priority, initially. At the end of this stage, the cue priority vector is filled with the values that indicate how strong the corresponding cue is for the given scene.
Why Fuzzy Logic?
In order to calculate the cue priorities, our choice is to fuzzy logic as the decision making method. A short tutorial on what fuzzy logic is and how it is applied is provided in Appendix A. It is recommended to read that section first, for the
readers without prior knowledge on fuzzy logic.
First of all, according to Mendel, there are two forms of problem knowledge: objective and subjective. Objective knowledge is used in engineering problem formulations such as mathematical equations, while subjective knowledge con-tains vague terms such as “small”, “big”, “too many”, and etc. [36]. Most of the time, binary logic is insufficient to represent such kind of subjective knowledge. In binary logic, the truth values are 0 or 1; however, in fuzzy logic, these values can be any quantity between 0 and 1.
Secondly, fuzzy logic systems are widely used in image processing, pattern recognition, controlling robots and artificial intelligence applications. Fuzzy logic is also used to model complex systems such as human intelligence, perception, and cognition. Some examples of the use of fuzzy logic in Perception are [3, 43, 20].
Additionally, the problem of combining different depth cues and rendering methods depends on many factors such as task, distance, cost, and etc. Fuzzy logic systems provide a robust solution for this kind of multi-input systems whose mathematical modeling is difficult.
In conclusion, our problem covers two different domains: Human Visual Per-ception and Computer Graphics. We consider the Human Visual Perception domain as the subjective part, and we prefer to formulate the subjective part of our problem using fuzzy logic since the domain contains really vague terms such as “strong”, “weak”, “effective”, and etc.
3.2.1
Fuzzification
In the fuzzification step of the algorithm, crisp set of input variables are con-verted to fuzzy set of variables as in other fuzzy logic systems. In this process, linguistic variables are defined for each input variable, firstly. Then, linguistic terms that correspond to the values of the linguistic variables are defined. Lastly, membership functions are constructed to quantify the linguistic terms. In this system, we have three types of input variables: task related, distance related, and
scene layout related variables. Each of these variables is explained in detail, in the following sections.
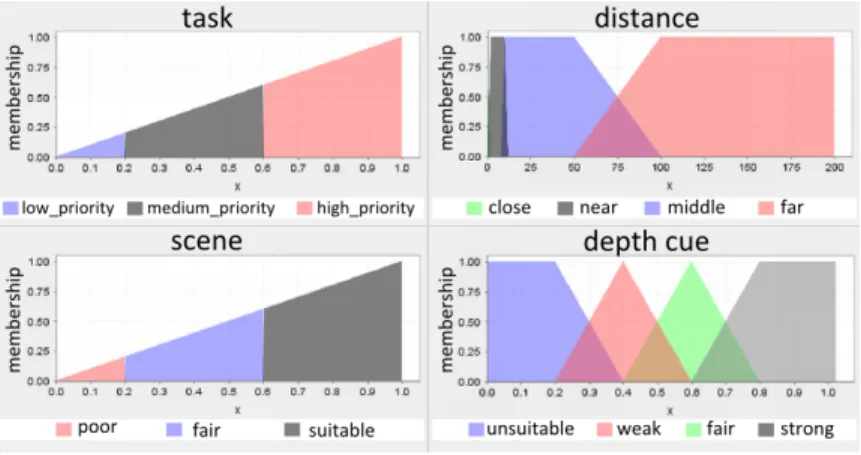
Figure 3.3: Membership functions.
Tasks
One of the inputs to the fuzzy cue prioritization stage is the task weights since cue specialization model constitutes an important part of the proposed algorithm. In our system, we have followed the task classification by Ware [53]. According to this classification, the tasks are as follows:
• Judging the relative positions of objects in space: In a 3D scene, one fundamental task is to judge the relative distances of the objects. When the scene is complex, it is difficult to understand the positions of the objects relative to each other. In the near vicinity, fine depth judgements can be made using the binocular disparity cue [53]. For the far distances, binocular disparity becomes ineffective, however.
• Reaching for objects: In interactive applications, it is important to facil-itate the user to reach the objects using the input device, when necessary. Especially for the Virtual Reality (VR) applications, it is difficult to adjust the eye-hand coordination without mismatch between the feedback from the scene and the proprioceptive sense of body position [53].
In computer generated scenes, reflecting the actual shapes of the objects and the surface details is a challenging issue. For example, the shading model dramatically affects the shape perception. Shape-from-shading, structure-from-motion, and texture cues are also widely investigated in the literature, to be used in revealing the surface shapes. Thus, the use of visual cues properly is an important issue for visualizing the shapes and surfaces of the objects.
• Tracing data paths in 3D graphs: A graph can be considered as an information visualization method using networks of nodes and arcs. The nodes in the graph are the entities or components of the data collection, and the arcs represent the relationship between these components. For example, tree is a widely-used graph structure to visualize hierarchical data. Various forms of 3D graphs are employed in the field of Information Visualization, like cone trees. As the tree or graph becomes more complex, tracing the paths in the graph gets harder. Presenting more data in a 3D graph, without distracting the understandability requires efficient usage of 3D space and visual cues.
• Finding patterns of points in 3D space: In 2D, a common information visualization method is using scatter plots. Clouds of data points can be considered as the application of 2D scatter plots in 3D. However, in 3D space, it becomes complicated to interpret the positions of the points in the plot.
• Judging the “up” direction: In real life, the gravity and the ground help us to determine the directions, however, an artificial environment generally lacks such kind of cues to perceive the directions. Hence, in computer generated images, it is important to provide visual cues that help judging the directions.
• The aesthetic impression of 3D space (Presence): An important problem with the virtual environments is the difficulty in providing a sense of presence. In order to make the user feel that he is actually present in the virtual environment, the aesthetic impression of the scene is important.
For each task listed above, a fuzzy linguistic variable whose value is between 0 and 1 is kept. These values correspond to the weights of the tasks in the appli-cation and initially assigned by the appliappli-cation developer using any heuristics he desires. Fuzzification of the task related input variables are obtained by piecewise linear membership functions which divide the region into three as “low priority”, “medium priority”, and “high priority” (Table 3.1).
Table 3.1: Linguistic variables and terms used for task input variables.
Linguistic Variable Linguistic Terms
judging relative positions {low priority, medium priority, high priority } reaching for objects {low priority, medium priority, high priority } surface target detection {low priority, medium priority, high priority } tracing data paths in 3d graph {low priority, medium priority, high priority } patterns of points in 3d {low priority, medium priority, high priority } judging up direction {low priority, medium priority, high priority } aesthetic impression {low priority, medium priority, high priority }
As an example, the membership function of task “reaching for objects” is shown in the top left of Figure 3.3 on page 35. The membership functions for other tasks are also the same. Using these membership functions and the task weights, each task is labeled as “low priority”, “medium priority”, or “high priority” to be used in the rule base according to Eq. 3.1.
µlow priority(x) = x, x ∈ [0, 0.2)
µmedium priority(x) = x, x ∈ [0.2, 0.6) (3.1)
µhigh priority(x) = x, x ∈ [0.6, 1)
where x is the crisp input value which corresponds to the weight of the task and µlow priority, µmedium priority, and µhigh priority are the functions for low priority,
Distance Range
As stated previously, range extension is another cue combination model that con-structs our hybrid model. For this part, we consider the distance of the objects to the user as an input to the system. In order to represent the distance range of the objects, two input linguistic variables “minDistance” and “maxDistance” are defined. These values are calculated as the minimum and maximum distances be-tween the scene elements and the viewpoint, and mapped to the range 0-100. In order to fuzzify the input variables for distance, we use the trapezoidal member-ship functions, which are constructed based on the distance range classification in [10], shown in the top right of Figure 3.3 on page 35. Based on these membership functions, the degree of the membership of the input variables “minDistance” and “maxDistance” are determined for each linguistic term as “close, “near”, “middle”, or “far” (Table 3.2, Eq. 3.2).
Table 3.2: Linguistic variables and terms used for distance input variables.
Linguistic Variable Linguistic Terms
minDistance { close, near, medium, far } maxDistance { close, near, medium, far }
µclose(x) = −x/2 + 1, x ∈ [0, 2) µnear(x) = x/2, x ∈ [0, 2) 1, x ∈ [2, 10) −x/2 + 6, x ∈ [10, 12] µmedium(x) = x/2 − 4, x ∈ [8, 10) 1, x ∈ [10, 50) −x/50 + 2, x ∈ [50, 100] (3.2) µf ar(x) = x/50 − 1, x ∈ [50, 100) 1, x ∈ [100, ∞)
![Figure 2.17: The effectiveness of depth cues as a function of distance [41].](https://thumb-eu.123doks.com/thumbv2/9libnet/5761656.116575/32.918.277.688.513.810/figure-effectiveness-depth-cues-function-distance.webp)