EFFECTS OF AGING AND SHORT-TERM
DIETARY RESTRICTION ON
NEUROGENESIS AND CELLULAR
SENESCENCE IN THE ZEBRAFISH (DANIO
RERIO ) BRAIN
a thesis submitted to
the graduate school of engineering and science
of bilkent university
in partial fulfillment of the requirements for
the degree of
master of science
in
neuroscience
By
Beg¨
un Erbaba
September 2016
Effects of Aging and Short-Term Dietary Restriction on Neurogenesis and Cellular Senescence in the Zebrafish (Danio rerio) Brain
By Beg¨un Erbaba September 2016
We certify that we have read this thesis and that in our opinion it is fully adequate, in scope and in quality, as a thesis for the degree of Master of Science.
Michelle Marie Adams(Advisor)
Mehmet Somel
Ay¸se Beg¨um Tekinay
Approved for the Graduate School of Engineering and Science:
Ezhan Kara¸san
ABSTRACT
EFFECTS OF AGING AND SHORT-TERM DIETARY
RESTRICTION ON NEUROGENESIS AND CELLULAR
SENESCENCE IN THE ZEBRAFISH (DANIO RERIO )
BRAIN
Beg¨un Erbaba M.S. in Neuroscience Advisor: Michelle Marie Adams
September 2016
Currently we know from rodent and fish studies that adult neuron generation is reduced but still continues in old animals with a dynamic change throughout aging. This process occurs mainly in hippocampal region, which is thought to be analogous to a region in telencephalon of the zebrafish brain. Changes in this neuron turnover are thought to be one contributing factor to cognitive change occuring with advanced age. Since we know that external factors can affect the process of neurogenesis, and as previous studies showed, dietary restriction (DR) extends life span; here, we hypothesized that DR should also alleviate several age associated alterations. In order to test this, we applied a 10-week feeding regimen to young (8-9 months) and old (26-32.5 months) male and female fish. We had two dietary regimen groups, one fed Ad libitum and one fed with a DR that was a pattern of every-other-day feeding, which is a widely accepted method of DR. A total of 124 animals were used in this study. As a result, a significant loss of body weight in both young and old DR groups was observed without an effect on body lengths. To be able to label actively dividing cells we used Bromodeoxyuridine (BrdU), which is a thymidine analog. It is injected into the fish intraperitoneally prior to euthanasia. Four hours later the brains were dissected and fixed for sectioning. We obtained cross-sectional slices of 50 µm thickness with a vibratome, performed immunostaining with antibodies against BrdU, NeuN (neuronal marker), HuC (neuronal marker); and visualized the brain sections with confocal microscopy forming 3D reconstructed pictures. We counted the BrdU positive cells in all brain slices, forming a regional map of the telencephalic region of zebrafish brain, in which we documented the specific regions where the adult neurogenesis dominates the most and least. Our results confirmed that there are more BrdU positive cells in young animals than olds,
iv
and that age is correlated with an increased senescence associated β-galactosidase (SA-β-gal) activity, along with shortened telomere lengths. The 10-week diet was not found to be creating a significant change in cell proliferation rates, cellular senescence, or the differentiation pattern of glial cells. However, it was demon-strated to have a shortening effect on telomere lengths. Our data suggest that the potential effects of DR could be related to telomere regulation. Therefore, in order to detect differentially expressed genes that could be related to this mech-anism between the groups, we performed microarray analysis with differing DR regimens. Initial data indicated no significant effects of a 4-week diet on gene expression differences among aged fish. Further analysis of the different periods of DR will be performed. Taken together, the effects of age are more robust than a short-term DR.
Keywords: Neurogenesis, aging, dietary restriction, zebrafish, brain, cell prolif-eration, microarray, telomere, cellular senescence.
¨
OZET
YAS
¸LANMA VE KISA D ¨
ONEM KALOR˙I
KISITLAMASININ ZEBRA BALI ˘
GI (DANIO RERIO )
BEYN˙INDE N ¨
OROGENEZ VE H ¨
UCRESEL
YAS
¸LANMA ¨
UZER˙INDEK˙I ETK˙ILER˙I
Beg¨un Erbaba
N¨orobilim Lisans¨ust¨u Programı, Y¨uksek Lisans Tez Danı¸smanı: Michelle Marie Adams
Eyl¨ul 2016
Yapılan kemirgen ve balık ¸calı¸smaları sayesinde, n¨orogenez dedi˘gimiz yeni sinir h¨ucresi olu¸sumunun, zamanla azalarak dahi olsa, ya¸slı hayvanlarda da devam etti˘gi bilinen bir ger¸cektir. S¨ure¸c, a˘gırlıklı olarak beynin hipokamp¨us kısmında ger¸cekle¸smekte, bu b¨olge ise zebra balı˘gı beyninde telensefalon alanına denk d¨u¸smektedir. Yeni sinir h¨ucresi yapımının ya¸sın ilerlemesi ile azalmasının, ya¸slılık ile ortaya ¸cıkan bili¸ssel bozukluklara i¸stirak etti˘gine inanılmaktadır. G¨un¨um¨uz bilgileri ı¸sı˘gında dı¸s fakt¨orlerin n¨orogenez s¨urecini etkileyebildi˘gini bilmekteyiz. Bir dı¸s fakt¨or olan kalori kısıtlamasının ya¸sam s¨uresini uzattı˘gı yapılan ¸calı¸smalar ile kanıtlanmı¸stır. Biz de hipotezimizi kalori kısıtlamasının, ya¸sa ba˘glı bazı belir-tileri bastırabilece˘gi ¨uzerine kurduk. Hipotezimizi test etmek i¸cin, gen¸c (8-9 aylık) ve ya¸slı (26-32.5 aylık), di¸si ve erkek balıklara 10 hafta s¨uresince bir diyet programı uyguladık. Deneylerimizde, kalorisi kısıtlanan (Dietary Restricted, DR) ve arzu etti˘gi kadar yiyebilen (Ad libitum, AL) ¸seklinde iki adet beslenme grubu belirley-erek toplamda 124 hayvan kullandık. Sonu¸c olarak, diyet uygulanan gen¸c ve ya¸slı hayvanlarda kısıtlama uygulanmayan hayvanlara kıyasla, v¨ucut uzunluklarına etki etmeksizin ¨onemli ¨ol¸c¨ude a˘gırlık kaybı oldu˘gu g¨ozlenmi¸stir. Etkin bir ¸sekilde b¨ol¨unen h¨ucreleri i¸saretleyebilmek i¸cin bir timidin t¨urevi olan Bromodeoksiuridin (BrdU) n¨ukleositi, ¨otenazi ¨oncesi balıklara karın i¸ci enjeksiyonu ile verilmi¸stir. Elde edilen beyinlerden vibratom ile 50 µm kalınlıkta kesitler alınıp; BrdU, NeuN (n¨oron i¸saret¸cisi), HuC (n¨oron i¸saret¸cisi) antibadileri ile imm¨un boyama yapılarak konfokal mikroskopta ¨u¸c boyutlu g¨or¨unt¨ulemeleri yapılmı¸stır. T¨um kesitler i¸cin BrdU pozitif h¨ucreler sayılmı¸s, zebra balı˘gı telensefalon b¨olgesi i¸cin b¨olgesel bir
vi
harita olu¸sturularak, n¨orogenezin ¸co˘gunlukta ve azınlıkta oldu˘gu b¨olgeler sap-tanmı¸stır. Sonu¸clar, ya¸slılara nazaran gen¸c balıklarda ¸cok daha fazla BrdU poz-itif h¨ucre bulunmasını do˘grulamı¸s; telomer kısalmasının ve ya¸slanmayla ilgili β-galaktosidaz (SA-β-gal) aktivitesi artı¸sının ya¸slanma ile ilgilerini peki¸stirmi¸stir. Diyetin; h¨ucre ¸co˘galması, h¨ucresel ya¸slanma veya glia farklıla¸sması ¨uzerinde ¨
onemli bir etkisi bulunmamı¸stır. Fakat, gen¸c balıkların beyin telomer uzunlukları ¨
uzerinde diyete ba˘glı bir kısalma g¨osterilmi¸stir. Verilerimiz, kalori kısıtlamasının, potansiyel etkilerininin telomer i¸sleyi¸si ile ilgili olabilece˘gine i¸saret etmektedir. Bu nedenle deneylerin devamında, ya¸slı balıklarda mikrodizin analizi ile gruplar arasında diyete ba˘glı bir gen anlatım d¨uzeyi farklılı˘gı olup olmadı˘gı incelenmi¸s, fakat ¨onemli bir ilginin varlı˘gı bulunamamı¸stır.
Anahtar s¨ozc¨ukler : N¨orogenez, ya¸slanma, kalori kısıtlaması, zebra balı˘gı, beyin, h¨ucre ¸co˘galması, mikrodizin, telomer, h¨ucresel ya¸slanma.
Acknowledgement
Firstly, I would like to express my endless and deepest gratitutes to Assoc. Prof. Michelle M. Adams, and Dr. Ayca Arslan-Ergul for their guidance, advices, time and efforts on me, and making it possible for me to work on a topic that was of great interest to me. I inspired by their courage, strength of purpose and most importantly always smiling manner. From them, I learned never losing any hope even in very hard times and always pushing harder to move further.
Secondly, I wish to express my sincere thanks to my family for their moral support at all times. And I feel tremendously fortunate to have such a beautiful second family in Ankara, who are Melek Umay Tuz, Elif Tugce Karoglu, Zeynep Yildirim, Bahar Sahin, Ilgim Ardic, and Ozge Burhan. I am thankful for their unworldly support and infectious joy.
Thirdly, I am grateful for dear Assoc. Prof. Ayse Begum Tekinay and dear Assoc. Prof. Mehmet Somel for their previous efforts on me during my academic career, and for their sincere kindness on accepting to take part in my thesis committee.
Lastly, I owe a special thank to Zeliha Gozde Turan sparing her precious time to help me on the microarray analysis and statistics.
This work was supported by The Scientific And Technological Research Council Of Turkey with grant number 114S548.
Contents
1 Introduction 1
2 Cell Proliferation and Markers of Cellular Differentiation 4
2.1 Introduction . . . 4
2.2 Experimental . . . 6
2.2.1 Feeding, Maintaining and Aging of Zebrafish . . . 6
2.2.2 Cortisol Extraction . . . 7
2.2.3 Senescence associated beta galactosidase assay . . . 7
2.2.4 BrdU Injections . . . 8
2.2.5 Immunohistochemistry . . . 8
2.2.6 Statistics . . . 9
2.3 Results and Discussion . . . 9
2.3.1 A short-term dietary regimen leads to weight loss without causing any increase in stress levels or change in cellular senescence . . . 9
CONTENTS ix
2.3.2 Actively proliferating cells per unit volume . . . 12
2.3.3 Differential Cell Proliferation Across Distinct Telencephalic Brain Regions . . . 15
2.3.4 Identification of the Actively Proliferating Cells . . . 17
2.4 Conclusion . . . 21
3 Effects of Short-Term Diet on Telomere Lengths of Different Tis-sues 22 3.1 Introduction . . . 22
3.2 Experimental . . . 24
3.2.1 Telomere Assay . . . 24
3.2.2 TeloTAGGG Telomere Length Assay . . . 25
3.2.3 Statistics . . . 26
3.3 Results and Discussion . . . 27
3.3.1 Telomere Length is Shortened by Diet in Brain . . . 27
3.3.2 Validation of Results with TRF assay . . . 28
3.4 Conclusion . . . 30
4 Gene Expression Changes in Old Zebrafish Following Short-Term Dietary Restriction Period 31 4.1 Introduction . . . 31
CONTENTS x
4.2.1 RNA Isolation . . . 33
4.2.2 Gene Expression Profiling . . . 33
4.2.3 Microarray Analysis and Statistics . . . 34
4.3 Results and Discussion . . . 34
4.4 Conclusion . . . 37
5 Conclusion and Future Perspectives 38
List of Figures
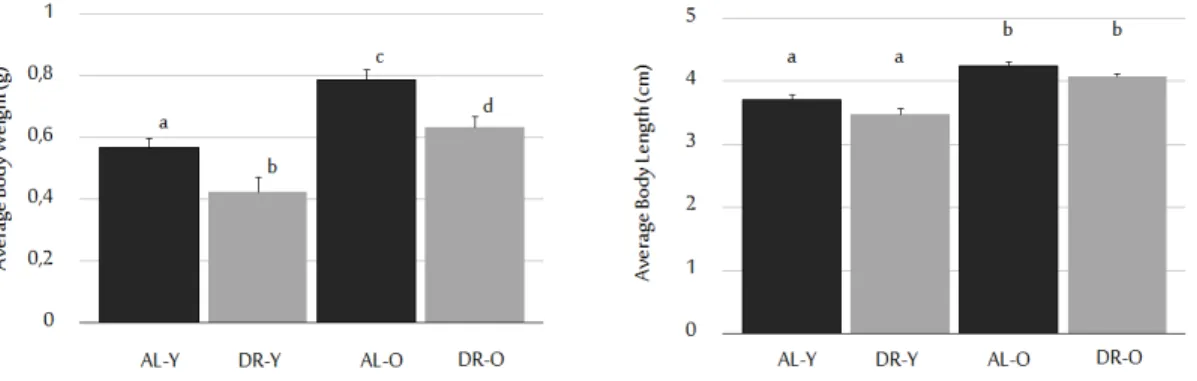
2.1 Effects of age and diet on animal body weight and lengths. . . 11
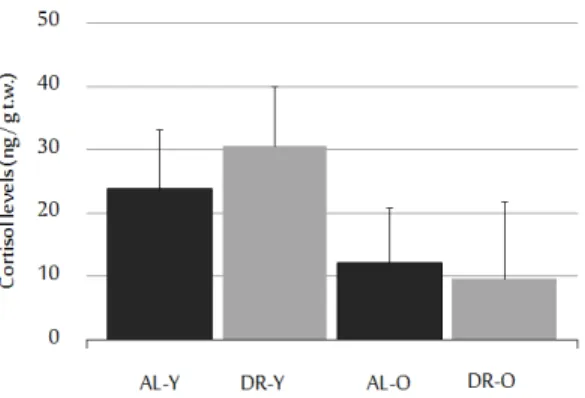
2.2 Cortisol levels of experimental groups. . . 12
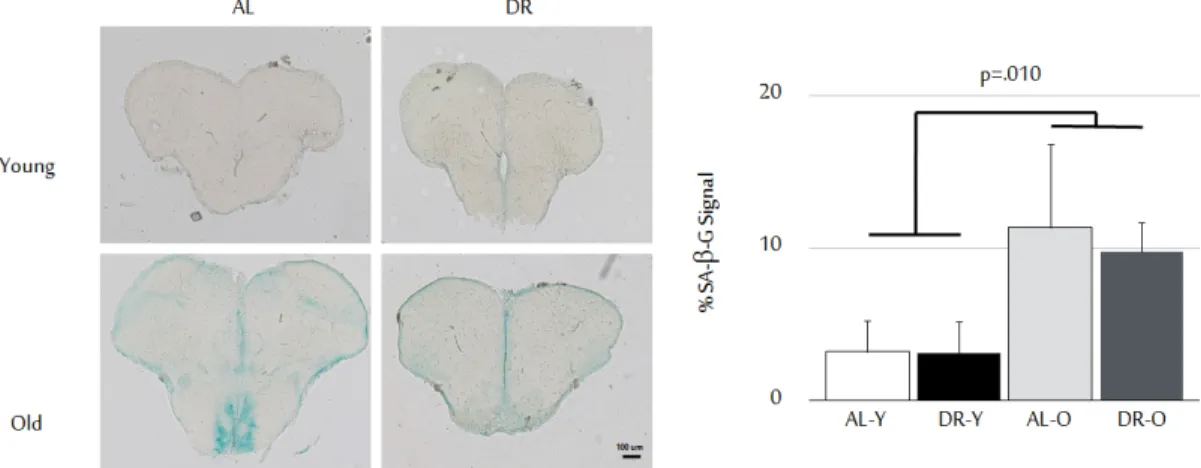
2.3 Senescence states. . . 13
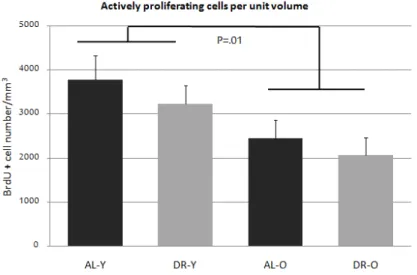
2.4 Rates of proliferation. . . 14
2.5 BrdU positive cells across the telencephalon. . . 15
2.6 Regionwise cell counts across the telencephalon. . . 16
2.7 Characterization of proliferating cells. . . 18
2.8 Percentage of gfap:GFP and BrdU positive cells. . . 20
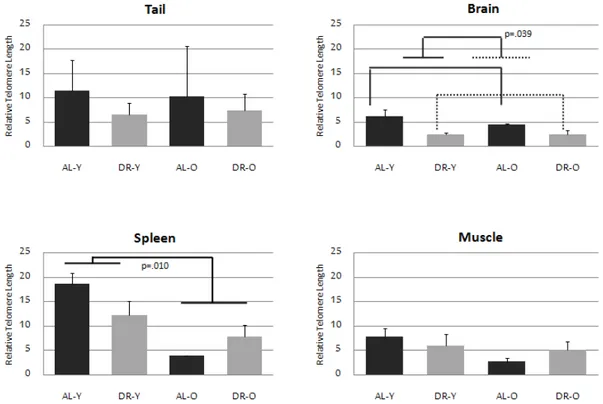
3.1 Comparison of telomere lengths of four tissue types in zebrafish. . 28
3.2 TRF assay. . . 29
4.1 Distribution of normalized microarray data. . . 35
4.2 Degradation plot. . . 36
Chapter 1
Introduction
As the human lifestyle dictates, we are born, age, and die in a continuum. Unless time stops, aging is an inevitable biological process that occurs for all organisms in different ways [1]. Thus all we can do is to seek a formula for a healthier and longer life to keep up with our loved ones.
Aging is a very complex state that induces numerous alterations in the human body such as genomic instability, telomere attrition, epigenetic alterations, loss of protein homeostasis, deregulated nutrient sensing, mitochondrial dysfunction, cellular senescence, stem cell exhaustion, and altered intercellular communication [2]. Gene expression variation is also found to be occuring with advancing age having a minor effect on individual genes but being more widespread throughout the transciptome level [3]. All of these alterations can contribute to age-related cognitive decline.
Not only genetic, but many environmental factors also contribute to brain ag-ing. That is why scientific research keeps searching for the most effective and easy-to-apply approaches to counteract with the aging process. In search of such an intervention to alter the course of aging, we chose to investigate dietary re-striction (DR) as a candidate since it is a non-genetic intervention that reliably extends both health- and lifespan.
DR is a dietary intervention that is reached by applying a 30-40% reduction in overall calorie intake without causing malnutrition with the reduced diet for a certain period of time. Effects of DR on increased life- and healthspan have been studied and shown in diverse species such as budding yeast, flies, spiders, worms, fish, and monkeys [4–6]. It was reported that DR is helping not only slow down aging, but also increases learning and motor performance, protects against the deterioration in tissue structure and function, maintains stem cell function that normally declines with age, and reduces DNA damage [7, 8]. The overall effectiveness of DR on lifespan is affected not only by dietary composition but also by the length and time of initiation of the diet. Several scientific reports on the effect of initiation and duration of DR have been provided, and it is stated that dietary restriction applied in the first or second half of life was more effective than application during both halves [9]. A study presented on rotifer species demonstrated that increases in length of DR state up to longer than the median life span of the animal, extends the life span by decreasing the life time reproduction [5].
The zebrafish is an ideal model organism to study human associated diseases as well as aging [10–12]. The animals live up to 3 to 5 years on average, and show gradual aging like humans [13, 14]. Its genome resembles the human genome and many orthologs are available for many human genes [15]. During normal brain aging in zebrafish, cognitive decline occurs and this process is similar to that described in humans and likely under the influence of both genetic and environmental factors [16]. The zebrafish nervous system is comparable with humans, having fore-, mid-, hind-brain structures. They also have an integrated nervous system, and show higher behavioral capabilities such as memory, and social behavior [12]. However, most importantly they show a greater proliferative potential as compared to mammals [17, 18]. This potential earned its signicance when previous research studies documented the decline in neuronal generation and turn-over rates arising with age in rats, mice and humans [19–26].
Regeneration is an ability to recover damaged tissues and/or to restore the lost body parts in multicellular organisms. Among vertebrates, fish and amphibians
are known to be able to regenerate a diversity of complex organs through epimor-phosis, which is the regeneration type by dedifferentiation of differentiated adult tissues. The zebrafish is a very attractive model organism to study regeneration regarding their ability to repair complex organs upon damage such as retina, sev-ered spinal cord, injured brain/heart, and amputated fins while mammals have a very limited regenerative capacity [27–30]. This process takes its base from alterations in gene expression [31–33] and the composition of the cytoplasmic compartment, which then leads to cell fate transformations [34].
The purpose of this thesis work was to apply a short-term DR intervention in the zebrafish to investigate the effects of a limited duration of DR during aging on cellular senescence states, cell proliferation rates, characterization of the newly produced cells, patterns of cell proliferation across the telencephalon; and telomere lengths of brain, spleen, muscle, and tail. For each animal, the aim was to identify the main genetic pathways in the brain that occur during normal aging and following limited durations of dietary intervention. This is the first set of data of DR experiments performed in the zebrafish.
Chapter 2
Cell Proliferation and Markers of
Cellular Differentiation
2.1
Introduction
The majority of studies focused on the formation of new neurons, ie. neurogenesis, at the embryonic level. It has long been debated whether any sufficient neuroge-nesis occurs in adult human brains to compensate any loss or harm in existing neurons throughout life. Studies have demonstrated that in the brains of mam-mals, including humans, new neurons continue to form in the adult state [35, 36]. Most of our knowledge about neurogenesis comes from rodent and non-human primate studies. The data have demonstrated that the formation of new neu-rons are mostly associated with two distinct areas in the telencephalon; one is the subventricular zone (SVZ) and the other is the subgranular zone (SGZ) lo-cated between the granule cell layer and hilus of the dentate gyrus, a part of the hippocampal formation. Beside these two areas, there are also regions where lim-ited neurogenesis has been reported, such as basal forebrain, striatum, amygdala, substantia nigra, subcortical white matter, and hypothalamus.
With the evidence that new neurons are formed in hippocampus, whether or not they are related to learning and memory is still a debatable question. In-deed, hippocampal-associated learning has been shown to be linked to increase in survival of new granule neurons, suggesting that newly born adult neurons could specifically be involved in hippocampal-dependent learning in rodent and avian species [37–41]. Research shows that one-third of the neurons in hippocampus are capable of being exchanged. In fact, during human adulthood, it is stated that approximately 700 new neurons are added to each hippocampus per day with a modest decline in generation rates during aging [42]. Thus, it is thought that age-related diseases like dementia or cognitive impairment might be related to some disturbances in the neurogenic abilities occuring with old age.
Along the same lines, it has been suggested that other external factors can affect neurogenesis. For example, while sleep and exercise, specifically running, are enhancing; negative stress suppresses the rates of adult neuron generation in the hippocampus [43–45]. One study examined the effect of prenatal stress on rate of neurogenesis and spatial learning in adult mice. They have shown a reduction in newly born granule cells and impairments in spatial learning ability in mice exposed to stress [46].
With regards to external factors, in our study, we aimed to investigate the emerging neurogenic roles of the nutrient-sensing signaling pathways. Accumu-lating evidence demostrates that dietary restriction (DR) supports neural stem cells (NSC) quiescence and promotes self-renewal [47]. Teleosts like zebrafish dis-play a much greater ploriferative potential when compared to mammals. Around 16 different proliferating areas were detected in distinct regions of the brain of adult zebrafish, including the areas corresponding to SVZ and SGZ in the mam-malian brain [18, 48]. Within every 30 minutes, nearly 6000 cells are born in the adult zebrafish brain, representing 0.06% of the zebrafish brain [48]. Neurogenesis in zebrafish is a continuous process and aging decreases its amount [49]. In one study, the proliferative zones of zebrafish brain were shown on cross sections of telencephalon with PCNA labeling, an alternative to BrdU staining [48]. There is a region called lateral pallium, located in the telencephalon of zebrafish brain, and is thought to correspond to the hippocampus in mammals [50, 51], which is
responsible for learning and memory. One study detected a significant decrease in learning skills in 3-year old fish compared to 1-year ones [16]. Considering its high neurogenic activity throughout the entire brain, the zebrafish becomes an attractive model organism to study the adult neurogenesis. Given that DR can improve health parameters during ageing in numerous organisms, and given that regeneration decline can cause age-related problems, we hypothesized that DR can improve regeneration in zebrafish.
2.2
Experimental
2.2.1
Feeding, Maintaining and Aging of Zebrafish
In this study, overall 124 fish were used. In our facility, fish were fed twice a day on a 14-hour light and 10-hour dark cycle set-up. A full time technician cared for the maintenance of zebrafish in the facility. Young fish were selected that were between 8-9 months old, while old ones were 26-33-months old. In this study we either used the wild-type AB strain or TgBAC(gfap-GFP)zf167 transgenic line of zebrafish, which was obtained from the European Zebrafish Resource Center and maintained and fed in our facility. The transgenic gfap:GFP-line was only used for the immunohistochemistry-triple staining experiments to be able to characterize the origin of the proliferating cells. For the determination of fish gender, we performed gonad examination, i.e. testes or eggs, for each fish. We divided experimental fish into two as Ad libitum (AL) and dietary restricted (DR). AL fish were fed a spoonful of dry flakes twice a day, while DR-fed zebrafish a spoonful of dry flakes once in two days. The animals’ diet was also supplied with artemia, which is a small type of shrimp, three times a week for AL-fed and once in a week or DR-fed fish. We continued diet for 10 weeks, and sampled the fish just after diet. The animal protocol for this study was approved by the Bilkent University Local Animal Ethics Committee (HADYEK) with the approval date: Sept 3, 2012, no: 2012/24 and with the approval date: Jan 8, 2012, no: 2013/2.
2.2.2
Cortisol Extraction
Cortisol is considered as bodys hormonal response to stressors. It is accepted as a primary stress indicator, in fish also. Its levels increases during exposure to chronic or acute stressors. A cortisol extraction method optimized for zebrafish was described in a previous paper [52]. Cortisol EIA Kit (ACE, 500360) was uti-lized for cortisol measurement experiments, and the kit manual was followed for the experimental protocol. After anesthetizing the fish in ice-cold water (4◦C), the head of the fish was decapitated. Trunks were stored at -80◦C after euth-anization of the fish. While using brain samples in other protocols, for cortisol experiments we used the trunk parts as samples. For the experimental proce-dure; we first immersed frozen trunks in cold PBS, weighed and homogenized them with smallest probe of the homogenizer, mixed with diethyl ether, cen-trifuged for phase separation, and captured cortisol with overnight evaporation. We diluted the samples and tested in duplicates via ELISA assay. (After opti-mizing the the protocol, the cortisol measurement experiments were performed by Elif Tugce Karoglu.)
2.2.3
Senescence associated beta galactosidase assay
As an indicator of cellular senescence, we measured senescence associated β-galactosidase activity (SA-β-gal) in the zebrafish brain samples. For that pur-pose, we utilized an SA-β-gal staining kit (9860S, Cell Sig-naling Technologies) following the manufacturer’s instructions. We followed similar steps as will be de-scribed in immunohistochemistry part. For image quantification, we used Image J software, where the signals were measured as a percentage of the selected brain area. Unbiased and blind measurements were followed. Experimentors quatifying the images were not aware of the sample categories.
2.2.4
BrdU Injections
Fish were transferred from their main tanks into a separate 17◦C tank supplied with system water, and a gradual temperature loss to 12◦C was provided with addition of ice cubes. When the fish were anesthesized, 10-20 L of a 10 mg/mL in water BrdU (Sigma, B5002) solution was injected into the fish intraperitoneally. Fish were then taken immediately to a 28◦C tank supplied with fresh system water. Behaviors of the fish were observed, as well as viability. After 4 hours, we put the fish into ice cold water for anesthesizing prior to euthanization. (BrdU injections were performed by Ayca Arslan-Ergul.)
2.2.5
Immunohistochemistry
For immunohistochemistry experiments, we followed a previously optimized pro-tocol [7]. Specificially, after decapitation, immersion of the head in fixation buffer (FB001, Invitrogen) was performed overnight at 4◦C. The head was washed with PBS, and dissection of the brain was performed. We performed dehydration and rehydration in methanol, then embedded the whole brain in 3% agarose in PBS. After solidification of the gel, we took slices covering the telencephalic region, of 50µm thickness with a Leica Vibratome VT1200S. We washed the slices with PBS-T, performed HCl treatment, neutralized with borax buffer, and blocked with goat serum (Sigma). After an overnight primary antibody incubation at 4◦C, 2-hour secondary antibody incubation was performed at room tempera-ture. Prolong antifade reagent (P36934, Invitrogen) was used for mounting the slices onto microscope slides. The antibodies used in the study were as follows; RabMab anti-NeuN antibody (ab177487, Abcam), anti-HuC antibody (ab78467, Abcam), anti-BrdU antibody- mouse monoclonal (5292S, Cell Signaling Tech-nologies), anti-GFP antibody (ab13970, Abcam); anti-rabbit Alexa Fluor 555 secondary antibody, anti-mouse Alexa Fluor 488 secondary antibody, raised in goat (4408, Cell Signaling Technologies), and anti-chicken Alexa Fluor 647 (ab150175, Abcam). 7-AAD nuclearstain (A1310, Invitrogen) was used as nu-clear stain. Zeiss LSM 510 confocal microscope was utilized for observation and
taking the images. We scanned 6-8 sections with 10-15 layers at the z-axis, and 4-6 squares at the x-y axis for each sample. ImageJ was used to create composite images.
2.2.6
Statistics
For all the statistical analysis, IBM’s SPSS software was utilized. Using the Kolmogorov-Smirnov and Levene's tests, all the data used in this study were tested for a normal distribution and homogeneity of variance. The significance level was set as 0.05. When any of the assumptions were violated, either Wilcoxon signed rank, Kruskal-Wallis or Friedman test was run. For comparison of the two groups, Mann Whitney U test was used post-hoc with a corrected p-value re-garding the number of comparisons between the groups. In the cases where the assumptions of homogeneity of variance and normal distribution were not vio-lated, a two-way ANOVA with the factors of age and diet was run. In order to detect between which groups a significant change was found, a post-hoc com-parison with a Bonferroni correction was applied following the ANOVA analysis. (Statistical analyses were performed by Elif Tugce Karoglu.)
2.3
Results and Discussion
2.3.1
A short-term dietary regimen leads to weight loss
without causing any increase in stress levels or
change in cellular senescence
Prior to and after the dietary regimen, weight and length measurements of fish used in our experiments were recorded. At the end of our 10-week diet, the dietary restricted (DR) animals weighed significantly less than their Ad-libitum-fed (AL) counterparts [53]. DR led to 25% weight reduction in young group, and DR old animals weighed 19% less than AL old ones (Figure 2.1). Moreover, the
data indicated that the old fish weighed significantly more than the young fish as expected [53, 54]. Average weights for DR young and old fish were 0.43 g (±0.03, n=28) and 0.64 g (±0.036, n=27); whereas, numbers were 0.57 g (±0.04, n=34), and 0.79 g (±0.035, n=29) for AL young and old fish, respectively. The significant weight loss within the age and diet groups was shown with a Kruskal-Wallis test with the main effect of age and diet [H (3)=45, (p<0.0005. All effects are reported at a 0.008 level of significance with a Bonferroni correction application. Post hoc comparisons using a Mann Whitney U test was employed, and significant differences measured were observed between the AL-Y and DR-Y groups (U=191, r=-0.42), DR-Y and DR-O groups (U= 135, r=-0.55), DR-Y and AL-O groups (U=66.50, r=-0.72), AL-Y and DR-O groups (U=252, r= -0.38), AL-Y and AL-O groups (U=176.50, r=-0.55) and AL-O and DR-O groups (U=224.50, r=-0.37)]. The average body lengths were 3.7 cm (±0.105, n=19) for AL young, 3.5 cm (±0.08, n=25) for DR young, 4.2 cm (±0.05, n=26) for AL old, and 4.08 cm (±0.08, n=24) for DR old groups. The lengths of aged animals were found to be significantly increased when compared to young groups [H (3)=40.07, p<0.0005. All effects are reported at a 0.008 level of significance with a Bonferroni correction application. Significant differences were found between AL-Y and AL-O groups (U=83.50, r=-0.57), DR-Y and DR-O groups (U=77.50, r=-0.64), AL-Y and DR-O groups (U=111.50, 0.44), and DR-Y and AL-O groups (U=41, r=-0.76)]. Since the effect of diet did not establish any statistical significance in terms of body lengths of the fish [(U=159, r=-0.29) for AL-Y and DR-Y groups, (U=230.50, r=-0.23) for AL-O and DR-O groups], it is likely that DR does not interfere with normal growth patterns [53].
In order to eliminate stress as a confounding factor, we performed an exper-iment comparing mean cortisol levels of caloricly restricted and ad-libitum-fed animals. For stress measurements, 5 DR-Y, 3 DR-O, 5 AL-Y, 6 AL-O fish were used. For the purpose, we utilized a kit measuring the body cortisol levels. The employed protocol was adapted from a previous study [52]. The comparative results demonstrated no significant difference between treatment groups (U=34, z=-0.83, p=0.41, r=-0.19), and between age groups (U=29, z=-1.31, p=0.19, r=-0.30) (Figure 2.2). Therefore, the diet does not seem to be establishing an
additional stress on animals. However, high cortisol levels were found in all sub-jects. This could be a response to the intraperitonial BrdU injections which were applied to all animals to detect the proliferating cells.
Figure 2.1: Effects of age and diet on animal body weight and lengths. DR regi-men applied significantly decreased body weight without affecting body lengths. Body weights are given in grams, and lengths are in cm. Sample sizes for ALY, DRY, ALO, DRO groups are 34, 28, 29, and 27, respectively. Error bars reflect +SE., and different letters above the bars show significant differences. (This fig-ure was published by our group [53] and reprinted with permission from Elsevier.) Furthermore, besides turn-over rates and telomere shortage, as another pa-rameter for cellular aging, the senescence associated β-galactosidase (SABG) as-say was carried out. The SABG asas-say relies on measuring the amount of β-galactosidase deposited in cells, which has been proposed as a biomarker to be expressed by senescent cells or cells under oxidative stress. Therefore its deposi-tion is expected to be increased in aged cells [55, 56]. For this assay, in total 91 brain slices were analyzed, for which 3 AL young, 3 DR young, 2 AL old, 2 DR old fish were used. According to the results, percentages of areas positive for the SABG signal are as follows; 3.23% (±2.05, n=3) for AL young, 3.13% (±2.06, n=3) for DR young, 11.37% (±5.41, n=2) for AL old, 9.78% (±1.87, n=2) for DR old groups (Figure 2.3). As expected from previous reports [55, 57], the SA-β-gal signal was shown to be significantly increased with old age [F (1,6)=6.76, p=0.041)]. Yet, our 10-week diet did not show establishing any significant ef-fect on both young and old groups in terms cellular senescence [F (1,6)=0.09, p=0.78)].
Figure 2.2: Cortisol levels of experimental groups. Body cortisol levels are shown in the graph. Diet did not increased the stress levels in a statistically significant way (+SE). Data shown reflects average cortisol concentrations per trunk weight. Samples sizes are 5 for ALY, 5 for DRY, 6 for ALO, and 3 for DRO groups. (This figure was published by our group [53] and reprinted with permission from Elsevier.)
2.3.2
Actively proliferating cells per unit volume
To investigate the number actively proliferating cells in the zebrafish telen-cephalon, we have sectioned the telencephalic region of the BrdU-injected AL and DR-fed young and old zebrafish brains. Actively proliferating cells are the cells that are proliferating in a restricted time interval of 4 hours. With this, we aimed to detect the proliferation occuring in cells in the time between injection and decapitation of the fish, which is 4 hours.
Confocal images were processed with Image J software. For proliferation count, double immuno stainings were performed with BrdU and a neuron marker (either HuC or NeuN) for image background. Therefore, in the image files, signals were coming from two channels. In the image processing composite jpeg images were formed by combining the two channels, and all stacks in the Z-projection; i.e. all the slices of images of the same brain tissue imaged in the z-axis. Then the BrdU signals were counted for each section of the brain (Figure 2.5).
The number of telencephalic sections obtained from the vibratome varied de-pending on the age of the fish, since old fish have bigger brain sizes than the young ones. Therefore to eliminate the size differences, we calculated a cell count
Figure 2.3: Senescence states. Increased senescence signals (+SE) were observed with age but not with diet. The y-axis represents SA-β-Gal signal as senescence marker per unit area of the brain section. Images were quantified using ImageJ. Sections shown are oriented as their dorsal sides up. Scale bar indicates 100 µm. Number of fish used for ALY, DRY, ALO, DRO groups were 3, 3, 2, and 2, respectively, examining 9 brain sections on average per animal. (This figure was published by our group [53] and reprinted with permission from Elsevier.) value per unit volume for each fish. Volumes (in mm3) of the brain sections were
calculated by multiplying area (in mm2) and depth (in mm), both of which were obtained by Image J.
At the end, we got 5-8 brain sections that belong to telencephalic area from each fish brain; and, volume and cell count values for each sections. What we did to compare the different groups was that, for each fish, we divided the total proliferating cell count into the total volume of the sectioned area, and took the average of count per volume for the fish in the same group. The average count per mm3 values were; 3772 cells/mm3 (n=9, ±551) for Ad-libitum-fed young group
(ALY), 3240 cells/mm3 (n=7, ±410) for DR young group (DRY), 2444 cells/mm3
(n=10, ±421) for Ad-libitum-fed old group (ALO), and 2074 cells/mm3 (n=9,
±395) for DR old group (DRO). There was a significant decrease in cells / mm3
calculations with age (U=68, z=-2.58, p=0.01, r=-0.44); however, the numbers were not differing statistically neither in terms of diet (U=137, z=-0.24, p=0.81, r=-0.04), nor between the groups (H(3)=6.83, p=0.078) (Figure 2.4).
Figure 2.4: Rates of proliferation. Cell proliferation rates (+SE) across the te-lencephalon of age and treatment groups is reported. Rates decrease with age without an evident effect of diet. 8 ALY, 7 DRY, 10 ALO and 9 DRO fish were used. Values are given as the number of BrdU positive cells per unit volume (mm3). (This figure was published by our group [53] and reprinted with
permis-sion from Elsevier.)
Lee et al (2000) stated that in the hippocampal dentate gyrus region of rats maintained on a DR regimen there is significantly higher numbers of newborn neural cells. However, they found no significant change in cell proliferation 1 day after the BrdU injections. They inferred from the increased survival rates of rats on DR that the higher number of new cells were actually arising from a decline in death of the newly produced cells [58]. Results from a recent study on hippocampal dentate gyrus of adult mice showed similar findings on DR’s inducement of survival of newly produced cells [59]. Another study conducted on the granular cell layer and the hilus of the dentate gyrus of mice from different age groups, supports the idea that DR promotes the survival cells in hilus without preventing the age related decrease in neurogenesis [60]. The age associated decline in number of proliferating cells in the zebrafish brain was also similar to another report [49]. Our contribution to the area is that the DR in our study did not alter the age-related declines.
The observation that our 10-week dietary regimen does not have a serious impact on the overall cellular proliferation rates, leaded us to that response to diet
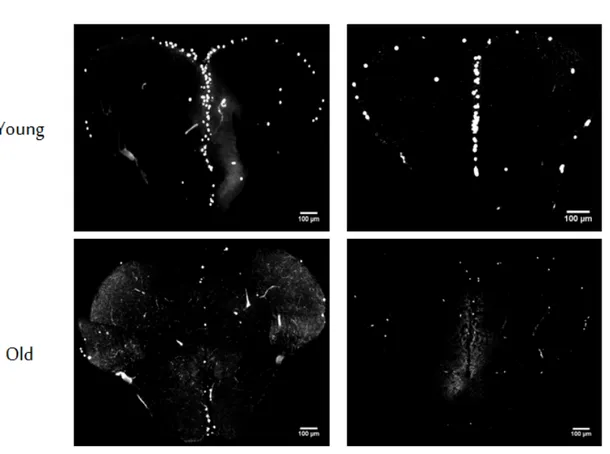
Figure 2.5: BrdU positive cells across the telencephalon. Representative immuno-histochemistry images are seen for each age and treatment group. White signals correspond to BrdU positive, actively proliferating cells. Scale bars show 100 µm. (This figure was published by our group [53] and reprinted with permission from Elsevier.)
might be region-specific there is a region-specific in the telencephalon. Therefore differences in cell proliferation rates among 10 distinct regions in the zebrafish telencephalon were examined next.
2.3.3
Differential Cell Proliferation Across Distinct
Telen-cephalic Brain Regions
In order to detect whether the cell proliferations follow a regional pattern, we have designed a simple regional map across telencephalic area of the zebrafish brain.
As can be seen from the diagram (shown on Figure 2.6), the brain slices of 34 fish were divided into 10 distinct regions. We have denoted the symmetrical border regions as 1, 2, 3, 1’, 2’, 3’; the middle border as 4, 5; and inside the border areas as 6 and 6’. Then, we counted the BrdU positive cells corresponding to the actively proliferating cells for each region. We used 7 DRY, 9 DRO, 8 ALY, and 10 ALO fish for this experiment. For each, 4-12 sections of telencephalon were counted depending on the experimental success. This difference in section numbers were either due to the different brain sizes of the fish, or due to some experimental obstacles, i.e. loss of- or harm to the sections during vibratome sectioning or wash steps in immunohistochemistry. Also to minimize the imperfections in sections, we took the average of BrdU+ cell counts of all sections of all fish, for each region and for each group.
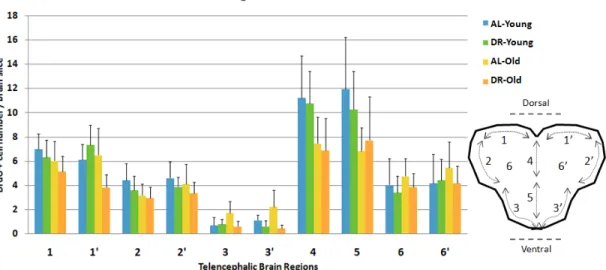
Figure 2.6: Regionwise cell counts across the telencephalon. Graph shows distri-bution of actively proliferating cells (+SE) in distinct regions of the telencephalon, as shown on the right diagram. Numbers do not seem to be affected by age or diet significantly in region-specific manner. Regions 4 and 5 score the highest and region 3 and 3’ score the lowest in proliferation rates. n=8 for ALY, n=7 for DRY, n=10 for ALO, and n=9 for DRO group. (This figure was published by our group [53] and reprinted with permission from Elsevier.)
The results demonstrated that symmetrical regions follows similar rates of proliferation [(T=238,50, p=0.45, r=-0.09) for region 1 and 1; (T=250, p=0.42, r=-0.10) for 2 and 2; (T=193, p=0.60, r=-0.06) for 3 and 3; and 6 and 6 (T=205, p=0.27, r=-0.13)] (Figure 2.6). The highest proliferation rates among the regions
for all groups are belong to the regions 4 and 5, which represent the midline of the telencephalon; and regions 3 and 3 have the lowest rate. And the lowest rates for all groups were detected for the regions 3 and 3’. Overall, the cell proliferation rates decreased numerically with old age and diet, but there was no significant difference either among the age or diet groups. Hence, proliferations do not seem to be affected by diet.However, cell proliferation rates were variable among the telencephalic areas and the differences were statistically significant (Friedman test, χ2 2(9)=177.73, p<0.0005)(Figure 2.6).
2.3.4
Identification of the Actively Proliferating Cells
Upon finding no significant change with DR in cell proliferations per mm3, the
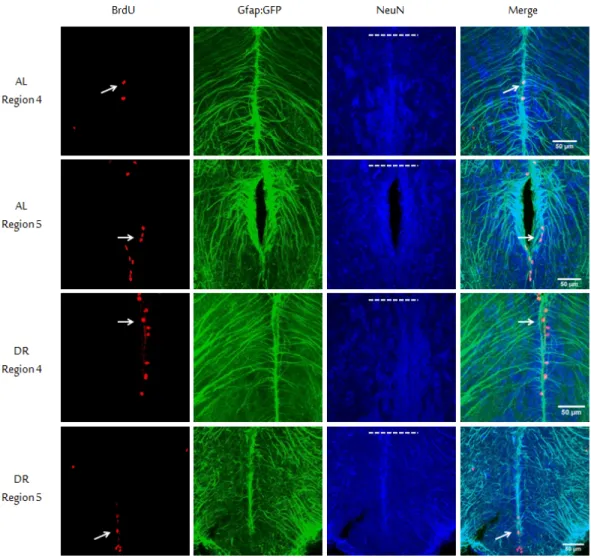
origin of the actively proliferating cells was determined. The cells were character-ized depending on their either neuronal or glial properties. However, it was not possible to detect the expression neuronal markers due to our observation of the actively proliferating cells under 4 hour exposure to BrdU. Therefore we counted the glial cells and analyzed the ratio of gfap-positive cells among the proliferating cells with and without DR. For this part of the study we used a Glial fibril-lary acidic protein gene (gfap):GFP transgenic zebrafish line, which expresses green fluorescent protein (GFP) under the gfap promoter. We established two diet groups as in the previous experiments on wild-type young fish, as 10-week DR and AL. After BrdU injections, fish were euthanized 4 hours later. Follow-ing triple immunostainFollow-ing protocols performed with anti-BrdU, anti-NeuN, and anti-GFP; composite images of telencephalic regions 4 and 5 were obtained with confocal microscope (Figure 2.7). Our regionwise selection was due to these two regions’ being the most proliferative two regions in the zebrafish telencephalon. We counted the overlapping signals coming from both BrdU and GFP. This is because the vast majority of neurons are strongly NeuN positive, and as a require-ment of our transgenic line the GFP signal is linked with gfap expression therefore associated with glial cell origin. Now since BrdU marks the proliferating cells, we thought double signal (indicated with arrows in figure; yellow color in com-posite image) coming from BrdU (red) and GFP (green) should indicate us the
Figure 2.7: Characterization of proliferating cells. Representative triple immunos-taining images are shown. In order to characterize the population of proliferating cells, gfap: GFP transgenic young fish line was used. The GFP antibody was used to label glial cells (Green), and NeuN was to mature neurons (Blue). BrdU (Red). Due to their highest ranking in regionwise proliferation rate analysis, re-gion 4 and 5 were chosen to examine the proliferating population. White arrows indicate some o the cells double stained with both BrdU and GFP. Dorsal sides of sections are shown with dashed lines. Scale bars represent 50 µm. (This figure was published by our group [53] and reprinted with permission from Elsevier.)
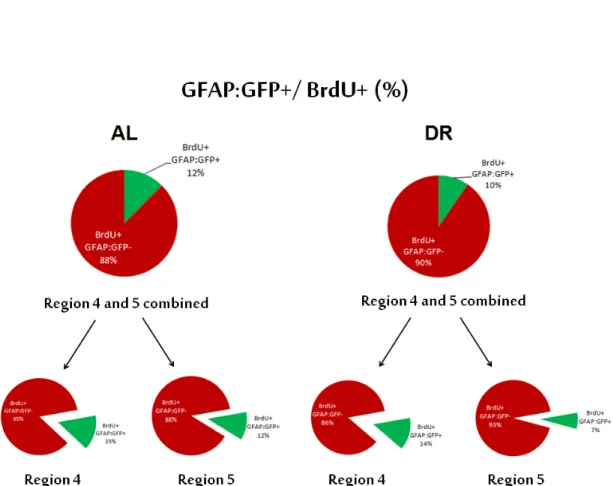
proliferating cells of glial origin. Results showed that; the glial cells correspond to 12.45% (±3.69) of all the actively proliferating cells in the AL group, while the ratio was 9.62% (±0.6) for the DR group (t(9)=-0.74, p=0.48). Calculating the ratio of proliferating cells in region 4 and 5 combined per brain slice, we found that 16.35% (±1.99) of AL group is consisted of proliferating cells, whereas the ratio is 14.44% (±1.20) for DR group (t(9)=-0.74, p=0.48) (Figure 2.8). Examin-ing the regions individually; for region 4 there was no difference between AL and DR groups (U=7.50, z=-1.37, p=0.17, r=-0.41); and in region 5 AL group scored higher in terms of glial cell percentages but again with no statistical significance (U=14, z=-0.18, p=0.86, r=-0.06). Glial cell percentages were found as follows; 14.72% (±3.95) for region 4 of AL group, 14.08% (±1.16) for region 4 of DR group, 11.54 (±3.68) for region 5 of AL group, and 6.91% (±1.14) for region 5 of DR group. So we found no significant effect of DR on cellular fate; i.e. glial or neuronal origin, of actively proliferating cells in young fish.
GFAP is an intermediate filament expressed astrocytes, schwann cells, and enteric glial cells. Among them astrocytes are found to be important elements in brain aging. GFAP gene activation and subsequent astroglial activation are found to have a key role in nervous system injuries and neurodegeneration, beside demonstrating age- and senescence-associated alterations such as increasing cy-tokine expression or proteotoxic aggregate accumulations [61, 62]. So it is inferred that those senescence related changes of astrocytes could be linked to decline in brain’s functional capacity. However, not only we did not detect an increase in glial proportion of cells with our regimen on the most proliferative regions of the telencephalon; but also due to the limited time interval between BrdU injections and brain dissections, it is also unexpected for the GFP positive proliferating cells (GFAP:GFP+/BrdU+) to be the mature astrocytes. The actively proliferating GFP positive cells in this study are likely to be the type 1 hippocampal progen-itor cells, since hippocampal neurons express gfap during early development as proposed in a former study [63]. This is also supported by Garcia et al reporting that all newly generated neuroblasts and neurons are derived from progenitors expressing gfap [64]. Thus, as a result, the GFAP:GFP+/BrdU+ cells are prob-ably type 1 hippocampal progenitors, and our 10-week calorie restricted diet did
Figure 2.8: Percentage of gfap:GFP and BrdU positive cells. Pie graphs show all proliferating cells for AL and DR fish groups. Green slices represent double positive cells for both gfap:GFP and BrdU, red area show gfap:GFP- proliferating portion of cells. The first row pie graphs represent proliferation data of region 4 and 5 combined, below the regions are separated. n=5 for ALY, n=6 for DRY group. (This figure was published by our group [53]; modified and reprinted with permission from Elsevier.)
not influence percentages of the double positive cells significantly.
2.4
Conclusion
According to the results, there are much more BrdU positive cells in young an-imals than old ones (Figure 2.4), meaning that old fish has less cells that are actively proliferating, supporting that proliferation decreases with age. However, the 10-week diet was not found to be creating a significant effect neither in terms of proliferation rates (Figure 2.4), nor cellular fate decision of actively proliferat-ing cells (Figure 2.8).
Chapter 3
Effects of Short-Term Diet on
Telomere Lengths of Different
Tissues
3.1
Introduction
Inside the nucleus of a cell, our genes are arranged along twisted, double-stranded molecules of DNA called chromosomes. At the ends of the chromosomes are stretches of DNA called telomeres, made of repeating sequences of TTAGGG on one strand paired with AATCCC on the other strand. Telomeres protect our genetic data, and make it possible for cells to divide. Without telomeres, chromosome ends could fuse together and corrupt the cell’s genetic blueprint, possibly causing malfunction, cancer, or cell death. Telomeres keep chromosome ends from fraying and sticking to each other, which would destroy an organism’s genetic information.
Since DNA polymerase α is unable to copy the very 3’ end of the DNA template where the primer resides, there occurs a progressive loss at the chromosomal ends of normal somatic cells, shortening with each replication cycle, which is called the
end replication problem. Each time a cell divides, the telomeres get shorter due to this problem, on average losing 30 to 200 base pairs from the ends. This shorten-ing scenario is overcome by the enzyme called telomerase, which adds TTAGGG repeats onto the telomeres [65]. The zebrafish’s remarkable regenerative abilities are thought to be associated with this constitutively rich telomerase activity in their somatic tissues from the beginning of life to old age [13]. However most of the human somatic tissues lack telomerase activity, which will eventually lead the cells suffer from telomere shortening after each DNA replication [66]. When they get too short, the cell can no longer divide; it becomes inactive or senescent or it dies. Data indicates that shorter telomeres are correlated with shorter human lives [67]. This shortening process is linked to the aging process, cancer, and a higher risk of death. A study among people older than 60 suggested that those with shorter telomeres were three times more likely to die from heart diseases and eight times more likely to die from infectious diseases [65].
There are numerous studies investigating telomere length (TL) differences among different tissues with great inter-individual and age-related variability. One of them conducted on adult zebra finches, compares telomere lengths of different somatic tissues with differing cell turnover rates (bone marrow, brain, spleen, pectoral muscle, heart, liver and in red blood cells). They found that there are age-independent differences between liver and muscle, and between spleen and red blood cells in terms of telomere lengths [68]. In another study, measur-ing telomere lengths of leukocytes, skeletal muscle, skin and subcutaneous fat of adult human subjects with differing ages; the longest telomeres were found to be belonging to the muscle tissue, while the shortest ones were to the leukocytes. They inferred also from the similarity of telomere shortening rates of the four tis-sues that TL differences of proliferative (skin and blood) and slightly proliferative tissues (fat and muscle) are settled in early life rather than adulthood [69]. It has been demonstrated from two separate surveys that both human fetuses and newborns have similar TLs in different tissues (white blood cells, umbilical artery and skin) of the same donor regardless of the gender; however, they exhibit an im-portant variability among the individuals suggesting that TL alterations among tissues in adulthood stem from the variabilities in telomere attrition of different
tissues later in life [70–72]
According to some, tissuewise TL differences are because of the divergent cell proliferation rates among tissues; however, others believe that the turnover rates of all tissues are same but the telomeric attrition rates are distinctive, and for the others the reason is in-born genetic or environmental individual differences and nothing else. Such contrasting ideas might be due to the type of tissues or cohorts used in the studies. In order to establish an understanding on the physiology of diet-related human longevity, here, data measuring TLs of four seperate tissues (brain, muscle, spleen, tail) of young and old, AL-fed and DR-fed animals is presented.
3.2
Experimental
3.2.1
Telomere Assay
In order to compare telomere lengths (TL) of the cells from different tissues, we benefited from a real time quantitative polymerase chain reaction (qPCR) based on a protocol adapted from a previous study [73], which includes DNA isola-tion from tissue, qPCR with telomere (telo) and a single copy gene (deiodinase, iodothyronine, type II) (Dio2) primers, and qPCR analysis.
Brain, tail, spleen and muscle tissues were dissected from individual fish. Then the DNA isolation procedure was carried out using Qiagen’s QIAamp DNA Mini Kit (Qiagen, 51304). After anesthesizing the fish with ice-cold water, the kit protocol was followed. Firstly, excision of the tissue sample from decapitated fish was performed and soaked into cold PBS, mechanical disruption of tissues in 180 µl Buffer ATL plus 20 µl proteinase K with 26G-1ml sterile syringe and vortexing, 1-hour incubation at 56 ◦C, addition of 200 µl buffer AL, pulse vortexing for 15 seconds, 10-minute incubation at 70 ◦C, addition of 200 µl ethanol (96-100 %), pulse vortexing for 15 seconds, cetrifugation at 8,000 rpm for 1 minute using QIAamp Mini spin column, addition of 500 µl Buffer AW1 to the spin column,
cetrifugation at 8000 rpm for 1 minute, addition of 500 µl Buffer AW2 to the spin column, cetrifugation at 14,000 rpm for 3 minutes, placing the spin column into a clean 1.5 ml microcentrifuge tube, addition of 200 µl Buffer AE for elution of DNA, incubation at room temperature for 1 minute, cetrifugation at 8,000 rpm for 1 minute again, and reelution of the filtrate from spin column at the same centrifugation speed. The concentrations of isolated DNAs were measured via a NanoDrop 2000 Spectrophotometer. In order to use the same amount of DNA, dilutions were performed where it is necessary with nuclease free water to reach 10 ng/µl concentration for each sample.
After this, we conducted qPCR experiments in which each sample was treated with both primers, that were telo and dio2 primers. All qPCR experiments were performed in triplicates. Premixes from primers were prepared prior to the experiments using 180 µl nuclease free water, 10 µl left and 10 µl right primers. This protocol was followed with 2 µl of premix, 6 µl of nuclease free water, 2 µl DNA (10 ng/µl), and 10 µl of SYBR Green.
Telomere length measurements were performed in a relative manner using a single copy gene, which is dio2 in our case. After we got the Cp values in triplicate of experiments, we substracted dio2 Cp averages from telo cp averages for each animal and each tissue, giving a ∆ value, and calculate 2∆ for each sample; which represents the relative telomere lengths. Averages of 2∆ values for all experimental groups were taken and compared. We used tail, brain, spleen and muscle tissues of 16 fish, in which 6 of them were ALY, 6 of them were DRY, 2 of them were ALO, 2 of them were DRO.
3.2.2
TeloTAGGG Telomere Length Assay
As a confirmation to qPCR based telomere length assay, we performed another TL assay using Roche’s TeloTAGGG Telomere Lenght Assay Kit with the same DNA samples. The test comprises 3 main steps in its protocol. The first step included digestion of genomic DNA with the help of a mixture of frequently cutting restriction enzymes, Hinf I and Rsa I enzymes. The enzymes’ sequence
specificity was such that non-telomeric DNA is fragmented into low molecular weight pieces but telomeric and sub-telomeric DNA stay intact. The second step included separation of DNA fragments by agarose gel electrophoresis and transfer of DNA fragments to a positively charged nylon membrane by Southern blotting. The third step was composed of hybridization of blotted DNA fragments with telomere-specific digoxigenin (DIG)-labeled hybridization probe, and incubation with Anti-DIG-Alkaline phosphatase that is a DIG-specific antibody covalently coupled to alkaline phosphatase. With the addition of substrate solution contain-ing CDP-Star, that is a highly sensitive chemiluminescence substrate, the alkaline phosphatase on the antibody produced a visible signal indicating the presence of the telomere probe.
The assay was repeated twice, and various exposures were taken into account during chemiluminescence detection. The bands were quantified using Telomeric Software as indicated in a former study [74] by the help of Dr. Ayca Arslan-Ergul. For that measurement rectangles were formed above and below the highest and lowest MW bands. Yet, contrary to the human samples used in the previous study that we adapted this protocol from, smears on the lanes appeared above the reactangles put in the software with our zebrafish samples, although the positive control sample from the kit was measured as reported. Therefore all the bands were included in the rectangles by covering the smears below the wells.
3.2.3
Statistics
3.3
Results and Discussion
3.3.1
Telomere Length is Shortened by Diet in Brain
As a telomeric shortening mechanism could induce replicative senescence, dif-ferentiation or even apoptosis [75], we wondered whether our dietary regimen affects telomere lengths of the animals. We used four tissues of DR and AL-fed, old and young zebrafish (brain, tail, spleen, muscle). The data pointed to signif-icant differences in each tissue from the others [H (3)=18.99, p<0.0005] (Figure 3.1). Similar TLs were observed between muscle and brain tissues. The tail represented two-fold longer telomeres than brain and muscle, while spleen had three-fold longer telomeres suppporting their regenerative abilities. A significant main effect of diet on brain TLs [F (1,15)=5.28, p=0.039] was observed without an evident impact of age [F (1,15)= 1.5, p=0.240]. On the contrary, for spleen, we found an important main effect of age [F (1,15)= 8.65, p= 0.010], but not treatment [F (1,15)= 0.80 p=0.384]. The impact of age on spleen is thought to be related to its high cellular turnover rates displaying high telomerase activ-ity [66, 76]. The spleen was identified by shorter telomeres than red blood cells in another study [68]. No significant change was observed with diet and age neither in tail [H (3)=0.37, p=0.95] nor in muscle tissues [H (3)= 5.11, p=0.16] (Figure 3.1).
Although not significant, it seems there is a tendency towards a reduction in telomere length in response to diet in AL-fed groups. However these shortened TLs in young subjects are not lower than old group DR fish, proposing a TL sta-bilizing effect. This lowering but maintaining result is corroborated with previous work done on rat hippocampal synaptic proteins [54, 77, 78]. Moreover, interest-ingly, Rolyan et al (2011) revealed a recovering effect of telomere shortening on mice with Alzheimer’s disease amyloid plaque pathology, and reducing reactive microglia activation, despite evidence of a maintenance of post-mitotic neurons and adult neurogenesis [79].
Figure 3.1: Comparison of telomere lengths of four tissue types in zebrafish. Differential effects of age and diet are shown on on telomere lengths (+SE) of four tissues of zebrafish (tail, brain, spleen, muscle). Telomere lengths were measured by normalizing the telomere expression to a single copy gene (Dio2) using qPCR with genomic DNAs. Sample sizes are 6 for ALY, 6 for DRY, 3 for ALO, 4 for DRO groups. (This figure was published by our group [53] and reprinted with permission from Elsevier.)
Moreover, the tissue specific differences seen from the results might be a re-flection of the differential aging paradigms, such as varying cell proliferation or telomere attrition rates of different tissues.
3.3.2
Validation of Results with TRF assay
To validate our results on qPCR based telomere length measurement analysis about the DR effects, we have used Roche’s TeloTAGGG Telomere length assay kit for the telomeric terminal restriction fragment (TRF) assay. Only brain sam-ples were included in the assay, with three samsam-ples in each group. The samsam-ples
included in the assay were the same samples used in the qPCR analysis.
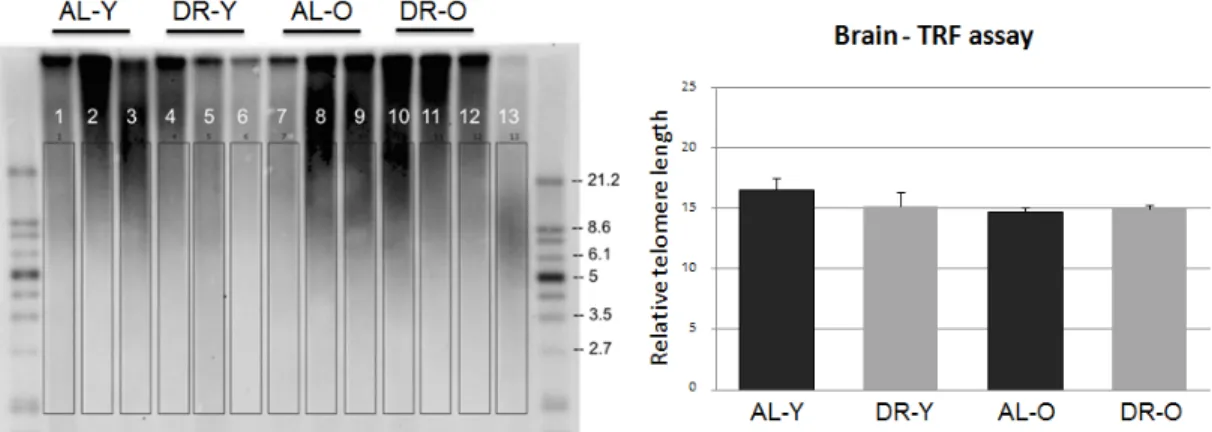
Figure 3.2: TRF assay. A second method of terminal restriction fragment (TRF) assay for telomere length measurement was applied using zebrafish brain sam-ples. A Southern blot image of the samples is shown. Values shown in the graph correspond to average median TRF lengths (+SE). A similar pattern of results to the qPCR based method was observed without any statistical differences. Ex-periment was conducted with Roche’s TeloTAGGG telomere length assay, and analysis was done via Telomeric Software. A positive control sample is included in lane 13 provided by the assay kit. A total of 3 samples were used for each group. (This figure was published by our group [53] and reprinted with permission from Elsevier.)
Quantification of the bands in southern blotted gel image was performed with Telomeric software. The calculations were adapted from a previous study [74]. The whole smear in the band area covering the highest and lowest MW signals was selected for each lane respectively in the software analysis. Obtaining the TRF median values from the software, plot was drawn with the standard errors of the groups. Findings were not found to be statistically significant (F(3,12)=1.022, p=0.443) (Figure 3.2). However this could because of the low sample size due to the requirement of high concentration of DNA for the measurement. Yet, numerically, the results from TRF analysis were following the same trend with the data from the qPCR experimental results which shows that the telomere lengths were shortened with DR. Due to its requirement of minimal amount of DNA, we believe that the qPCR method results were more sensitive and accurate in terms of quantification.
Therefore, although there was no significance in TRF assay due to lower sam-ple size (3 fish for each 4 groups) or experimental difficulties, such as trying the existing method on a different species, we believe that we have verified the telomere length data came from qPCR method since both of the methods were following the same trend.
3.4
Conclusion
Although we did not detect any significant effect of diet on cell proliferations (Figure 2.4), we saw a statistically significant change with DR on relative telomere length measurements in the brain (Figure 3.2). Thus, as our data points out, DR could be presenting a negative pressure on telomere lengths possibly causing an accelerated shortening.
Chapter 4
Gene Expression Changes in Old
Zebrafish Following Short-Term
Dietary Restriction Period
4.1
Introduction
Converging lines of evidence indicate that aging reduces neurogenesis in zebrafish as well as in other vertebrate species [49]. Up to this point, we successfully applied a 10-week DR regimen to the fish and did not see any reductional effect on age-related decrease in neurogenesis, but telomere lengths (TL) (Figure 2.4)(Figure 3.1). Observing a diet specific shortening and stabilizing effect on TLs made us curious about whether DR shows its effects on telomere maintenance.
With the advances in technology, microarrays have become a feasible tool to perform whole genome and transcriptome analyses in the zebrafish which have orthologues to approximately 70% of human genes [15]. In a previous study, the gene expression levels of young and old, male and female adult zebrafish brains were compared via using microarray technology [80]. It was demonstrated that age and gender differentially affect genes related to neurogenesis and neuronal
differentiation, as well as synaptic structure and growth [80]. Another study con-ducted using a short-lived teleost fish model Nothobranchius furzeri characterized the whole genome-wide transcript regulation with RNA-seq analysis during brain aging [81]. With this method, they pointed out the markers of brain aging includ-ing reduced learninclud-ing performances, gliosis, and reduced adult neurogenesis. Their use of genetic profiling demonstrated downregulation in neurogenesis, extracellu-lar matrix, synaptic and axonal genes with age. Moreover, not long ago, a study emphasized the role of cellular self-digestion in differentiation and tissue pattern-ing [34]. It was stated in the research article that genetic and pharmacological inhibition of autophagy, which is a regulated lysosome mediated self-degradative process disassambling unnecessary or dysfunctional cellular components, disrupts the regenerative ability in zebrafish impairing the reconstruction of their ampu-tated caudal fins. Thus, inhibition of autophagy was also suggested to be involved in extensive cellular remodelling and aging.
In the current chapter, we intended to identify the main genetic pathways in brain aging that are affected by differential periods of short-term DR (1-,2-,4-, and 8-week) using male aged zebrafish in order to establish an understanding of diet-specific physiological effects on the aging brain and to check possible genes that are differentially expressed upon a short-term DR; and if there is any, to see their relevance to cell cycle, and telomere regulation, as well as other genes possible related to synaptic structure and growth. Short periods of DR were cho-sen because the brain can rapidly adapt to environmental triggers. For example, stress can quickly alter synaptic plasticity and neurogenesis [52, 82–85]. Since this part of our work is based on recent data collection, only the prelimenary work will be presented here. The experimental data shown comprises 6 old animals (26-33 months), 3 of which were AL and 3 were exposed to a 4-week DR. RNAs from whole brain were isolated from individual fish, and subjected to microarray analysis. We predict that our results will give a deeper understanding on how short-term DR contribute to successful brain aging.
4.2
Experimental
4.2.1
RNA Isolation
For the RNA isolation procedure we utilized Qiagen’s RNeasy Mini Kit. As a starting material, individual dissected zebrafish brains were used, which weigh 6-10 mg per brain [80]. The experimental protocol involved lysis and homoge-nization, ethanol 70% addition, binding of total RNA, washing and elution steps. Brain tissue disruption and homogenization were performed using 26G-1ml ster-ile syringes. In the protocol, either β-mercaptoethanol (β-ME) or dithiothreitol (DTT) was applied as a protein reducing agent. The isolation protocol were then followed by DNase treatment with Ambion TURBO DNA-free Kit from Thermo Fisher Scientific. The concentrations of the RNA samples isolated, were measured via either NanoDropTM2000 or Agilent 2100 Bioanalyzer instruments.
4.2.2
Gene Expression Profiling
The microarray technique was performed for gene expression profiling. For the microarray experiments, we used GeneChip R 3’ IVT PLUS Reagent Kit, and
prepared targets for GeneChip R 3’ Expression Arrays manually. 3’ IVT PLUS
Amplification and Labeling Process follows this route; Poly-A RNA Control ad-dition to total RNA sample that was isolated with Qiagen RNeasy Mini Kit, reverse transcription of total RNA into single stranded cDNA with T7 oligo (dT) primer, conversion of single-stranded cDNA into double-stranded cDNA, labelled complementary RNA (cRNA) synthesis and amplification by in vitro transcrip-tion using T7 RNA polymerase, labelled cRNA purificatranscrip-tion, cRNA yield and size distribution assessment using Bioanalyzer instrument, labelled cRNA frag-mentation, cartridge array target hybridization on the GeneChip R instrument,
washing, staining and scanning. The hybridization and scanning step afterwards, were performed at Ankara University, Biotechnology Institute.
4.2.3
Microarray Analysis and Statistics
In order to analyze the GeneChip Zebrafish Genome array data, we utilized R for statistical computing and to visualize data. We first normalized the data prior to performing principal component analysis (PCA). This was because the PCA calculates a new projection of the data set, which is based on the standart deviation (sd) of the data variables. Not to put more weight of a data with higher sd to the overall calculation than data with a lower sd, prior normalization is needed to bring all the variables to the same sd. The distribution of p-values of the probesets was obtained employing a t-test. Having two nominal variables as AL and DR with low sample sizes, Fisher’s exact test was applied to the data set. The test helps to discriminate the proportions for one variable from the values of the other variable [86] (Statistical help was received from Zeliha Gozde Turan).
4.3
Results and Discussion
As this is preliminary work done up to now, in this section only data from 6 old male fish is presented here. These experiments were performed in order to detect if a short-term DR applied at old age has any effect at transcriptomic level. A total of 3 DR treated (4-week) and 3 AL-fed, 27-33-month old fish were used in this section.
For the data distribution assessment, principal component analysis was fol-lowed. An uneven distribution of several data points on the normalized PCA plot was observed rather than treatment-based grouping, which was not expected. The two outliers observed in the PCA plot are samples ALO3 (one of the Ad libi-tum samples) and AE101 2 (one of the dietary restricted samples) (Figure 4.1). The qualities of the two samples can be inferred from the RNA degredation plot (Figure 4.2), showing highest and lowest mean intensity values. Despite this situation the outliers were not excluded from the data due to low sample size.
Figure 4.1: Distribution of normalized microarray data. Distribution of normal-ized data is shown. Outliers can be seen from the principal component analysis plots. Those outliers could not be exempted from the data because of small sample size of 6, in which 3 of them were AL and 3 were DR (4-week).
Figure 4.2: Degradation plot. RNA degredation plot was drawn to assess the quality of RNAs. The two outliers detected from PCA analysis were also found to be divergent from the other samples.
Figure 4.3: p-value distributions. Histogram of the p-values obtained from t-test is visualized. Graph shows that a large part of the genes were accumulated at the p>0.05 region on the distribution of the p-values, indicating that there was no significant change on gene expressions of the brains of aged zebrafish that is altered with diet.
from t-test. No statistically significant change with diet was seen between the groups as seen from the distribution of the p values, where the probe sets ac-cumulate around the p-value of 0.425, which is >0.05. There are a relatively low number of genes having p-values below 0.05 (n = 67) which indicate no sig-nificant difference between the two-groups. We next conducted Gene Ontology (GO) analysis for 3 domain - Biological Process (BP), Cellular Component (CC), Molecular Function (MF) - to find enriched groups which might have possibly contributed to the difference between the compared treatment groups. However, no statistically significant result was obtained at the end of the analyses using Fisher’s exact test.
4.4
Conclusion
Here, we tried to examine the effects of diet on aged zebrafish, yet we did not find any important gene expression level change between the treatment groups (Figure 4.3). This is probably due to our insufficient number of observations in the experiment yet. The sample sizes will be increased and different durations of DR will be analyzed in the continuing experiments.
Chapter 5
Conclusion and Future
Perspectives
In the present work, the effects of a short-term dietary regimen was investigated in young (8-9 months old) and old (26-32 months old) zebrafish. The old zebrafish used in the present study is thought to be equivalent to a 60-year old human. The diet that was used, therefore, likely corresponds to approximately 4 years in humans, which is short enough to apply and long enough to be able to create an effect after a certain age. Moreover, this dietary regimen caused only a weight reduction with no change in the animal’s body lengths nor circulating cortisol levels. Thus, our DR regimen seems to be administered effectively without inter-vening in normal healthy growth or adding stress onto the animals. We looked at the impacts of age and diet on cellular turnover rates in a narrow window of 4 hours, regional proliferation rates across the telencephalon, characterization of the proliferating cells, telomere length, SABG senescence states, and effects of diet on whole brain transcriptome of old subjects. We have found that actively proliferating cells were decreasing significantly with age. Diet seems not affecting cellular generation rates and cell fate decisions of actively proliferating cells. We detected the telencephalic regions where proliferation prevalence is high and low, and characterized the BrdU positive cells with coimmunostaining with neuronal