ASYMPTOTIC
i-S F O ¡TSv.F.Q«: NORMAilTV- ^BASÊO О »
ST .«EGKf SS
Ш в . г .
л Rh. Ό -^'Oissertatio!
■’М м -Μ-· ^ Ϊ^'«Λί*5· -л 5 - ñ.. ■ S' :-ïî4‘-îî?·ï r. ■t.l.ç.l Ы. 6: O c ^ASYM PTOTIC EXPANSIONS FOR TEST STATISTICS AND
TESTS FOR NORM ALITY BASED ON ROBUST REGRESSION
The Institute of Economics and Social Sciences of
Bilkent University
by
A. OZLEM ONDER
In Partial Fulfillment of the Requirements for the Degree of DOCTOR OF PHILOSOPHY IN ECONOMICS
m THE DEPARTMENT OF ECONOMICS BILKENT UNIVERSITY ANKARA June 1999
I certify that I have read the thesis and have found that is fully adequate, in scope and in quality, as a thesis for the degree o f Doctor o f Philosophy in Economics
I certify that I have read the thesis and have found that is fully adequate, in scope and in quality, as a thesis for the degree o f Doctor o f Philosophy in Economics
Asst. Prof Dr. Kıvılcım Metin Examining Committee Member
I certify that I have read the thesis and have found that is fully adequate, in scope and in quality, as a thesis for the degree o f Doctor o f Philosophy in Economics
Asst Prof DnAdetin Karadağ Examining Committee Member
I certify that I have read the thesis and have found that is fully adequate, in scope and in quality, as a t j^ is for the degree o f Doctor o f Philosophy in Economics
AssiftProf Dr. Mehmet Caner Examining Committee Member
I certify that I have read the thesis and have found that is fully adequate, in scope and in quality, as a thesis for the degree o f Doctor o f Philosophy in Economics
Asst. Prof Dr. Ashhan Salih Examining Committee Member
ABSTRACT
ASYM PTOTIC EXPANSIONS FOR TEST STATISTICS AND
TESTS FOR NORM ALITY BASED ON ROBUST REGRESSION A. Özlem Önder
Ph. D. Department of Economics Supervisor: Prof.Dr. Asad Zaman
June 1999
This dissertation focuses on two different topics in econometrics. The first one is presented in Chapter 2 and is related to higher order asymptotic theory. The power of the Lagrange multiplier, Wald and likelihood ratio tests for the first order autoregressive model is compared through the approximations to the distributions of these three tests. The adequacy of the approximation is examined. The Wald and likelihood ratio tests are found to have superior performance than the Lagrange multiplier test. The comparisons are done ac cording to stringency of the test statistics.
As a second topic in Chapter 3, the dissertation examines the use of resid uals from robust regression instead of OLS residuals in test statistics for the normality of the errors. According to simulation results their improvement over standard normality tests is found only in specialized circumstances. The ap|)lications on real data set show these conditions occur often enough in prac tice.
Key Words: Asymptotic Expansion, Autoregressive Model, Stringency, Nor mality Test, Robust Regression
ÖZET
TEST İSTATİSTİKLERİ İÇİN ASİM PTOTİK AÇILIMLAR VE
GÜÇLÜ REGRESYONA DAYALI NORMAL DAĞILIM TESTLERİ A. Özlem Önder
Doktora, Ekonomi Bölümü Tez Yöneticisi: Prof.Dr. Asad Zaman
Haziran 1999
Bu çalınma ekonometrinin iki farklı konusunu incelemektedir. Bunlardan ilki
2. bölümde yer almaktadır ve yüksek dereceden asimptotik teoriyle ilgilidir. Lagrange çarpanı, Wald ve olabilirlik oranı testlerinin birinci dereceden otoregresif modelde güçleri, söz konusu testlerin dağılımlarına yaklaştırını yoluyla karşılaştırılmaktadır. Yaklaştırımlarm yeterlilik dereceleri incelenmiştir. Wald ve olabilirlik oranı testlerinin, Lagrange çarpanı testinden daha üstün perfor mansa sahip olduğu gözlenmiştir. Testler arası karşılaştırma sıkılık kriterine göre gerçekleştirilmiştir.
İkinci konu olarak 3. bölümde tez, hata teriınlerinin normal dağılımıyla ilgili test istatistiklerinde olağan en küçük kareler artıkları yerine, güçlü regresyon artıklarının kııllammının etkisini inceh'mektedir. Siınıılasyon sonuçlarına göre teknik, standart kullanılan normal dağılım testlerinden ancak belli koşullar altında üstün performans göstermektedir. Gerçek veri setiyle yapılan uygula malar bu koşulların gerçekte yeterli sıklıkta görüldüğünü göstermektedir.
Anahtar Kelimeler: Asimptotik açılım, Otoregressif Model, Sıkılık, Normal Dağılım Testi, Güçlü Regresyon
I would like to express my sincere gratitude to my supervisor, Professor Asad Zaman for his guidance, help and support throughout the development of the thesis. He has not only supervised my thesis but also helped me overcome my problems which I had encountered while doing my research. I am grateful to Kıvılcım Metin for li<‘r help and encoiiiagi'inent I thank to Metin Karadağ for his careful reading and valuable comments.
I would like to thank Erdem Ba^çı, Sıdıka Başçı, Aziz Sağlam and Aykut Lenger for their help.
I also thank to my professors and research assistants from Ege University, for their understanding and support.
A C K N O W LED G EM EN TS
I would like to thank my family for their encouragements. I owe the greatest dept to my husband Abdullah who has provided me with constant support and patience. Without him it would be difficult to suceed.
TABLE OF CONTENTS
ABSTRACT
iii
ÖZET
iv
ACKNOWLEDGEMENTS
v
TABLE OF CONTENTS
vi
CHAPTER I: INTRODUCTION
1
CHAPTER II: ASYMPTOTIC EXPANSIONS FOR TEST STATIS
TICS
6
2.1 Higher Order Asymptotic T h e o r y ... 6
2.1.1 Introduction... 6
2.1.2 Preliminary Notation and D efin ition s... 7
2.1.3 Central Limit T h eorem ... 8
2.1.4 Edgeworth Expansion ... 9
2.1.5 Saddlepoint A p p ro x im a tio n ... 16
2.2 Literature S u r v e y ...17
2.3 LR, Wald and LM tests ...27
2.3.1 Definitions... 27
2.3.2 Three Test P ro ce d u re s... 29
2.3.3 Approaches to Compare Test S ta tistics... 30
2.3.4 Asymptotic Equivalence of the Test Statistics and Higher Order Efficiency...31
2.4 An Auotocorrelation E x a m p le ... 32
2.4.1 Critical Values ... 35
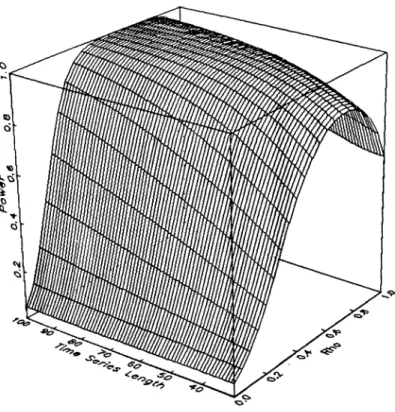
2.4.2 The P ow er...38
2.4.3 The Power E n v e lo p e ... 40
2.4.4 Lagrange Multiplier T e s t ... 40
2.4.5 The Wald Test ... 41
2.4.6 The Likelihood Ratio T e s t ...43
2.4.7 Comparisons ...45
CHAPTER III: TESTS FOR NORMALITY BASED ON RO
BUST REGRESSION
47
3.5 Diagnostic Tests for Normality Based on Least Squares Residuals 47 3.6 A Robust Estimator: L T S ... 493.7 The Normality Tests with LTS E stim ator... 50
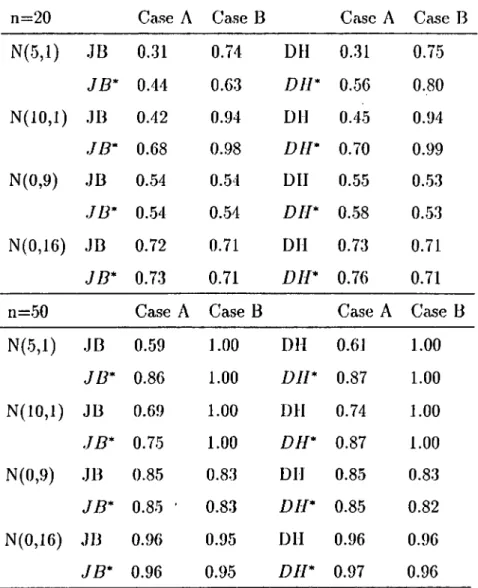
3.8 Power Com parisons... 52
3.9 A pplications... 56
CHAPTER IV: CONCLUSION
58
SELECT BIBLIOGRAPHY
62
APPENDICES
A. THE EXPLICIT FORMULA OF zi AND Z2 FOR DH TEST . . . 70LIST OF TABLES
1 Significance Points for Four Tests for N o r m a lity ...51 2 The Values of the Normality Test Statistics from Rousseeuw
and Leroy Data S e t s ... 52 3 Estimated Power for n=20 ...53
4 Significance Points for Four Normality Tests with New Regres sor M a tr ix ... 54 5 Power Comparisons of Mixture of Normal Alternatives with 20%
Outliers under Different C o n d itio n s...55
6 The Values of the Normality Test Statistics from Tansel (1993) and Metin (1998) M od els...56
LIST OF FIGURES
1 Empirical Size of First Order Approxim ation... 71
2 Empirical Size of Second Order Approxim ation...71
3 Theoretical Approximation to Critical V a l u e ... 72
4 Theoretical Approximation to Power E n v e lo p e ...73
5 Approximation Error of Power E n v e lo p e ... 73
6 Theoretical Approximation to LM T e s t ... 74
7 Approximation Error of LM T e s t ... 74
8 Theoretical Approximation to Wald T e s t ... 75
9 Approximation Error of Wald 'lest ...75
10 'I'lieoretical Approximation to LR Test...76
11 Approximation Error of LR T e s t... 76
12 Power Envelope vs. LM for T = 5 0 ... 77
13 Power Envelope vs. LM for T = 1 0 0 ... 77
14 Power Envelope vs. Wald for T = 5 0 ... 78
15 Power Envelope vs. Wald for T= 1 0 0... 78
16 Power Envelope vs. LR for T = 5 0 ...79
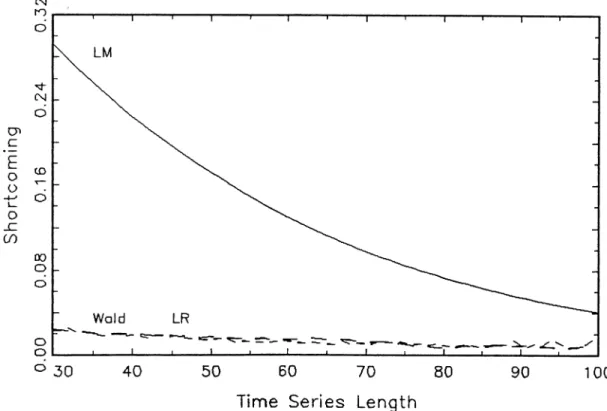
17 Power Envelope vs. LR for T = 100 79 18 Empirical Shortcoming of LM, Wald and LR ... 80
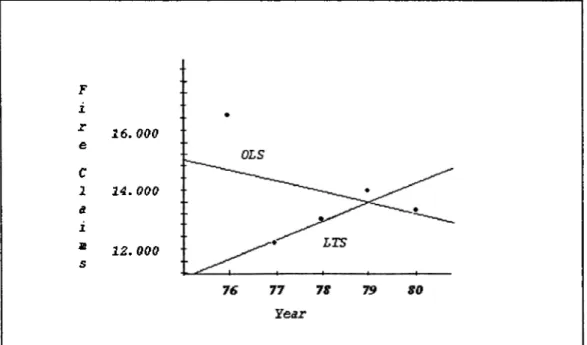
19 Theoretical Approximate Shortcomings of LM, Wald, and LR . 80 20 Fire Claims in B elgiu m ...81
C H A P T E R I
IN T R O D U C T IO N
Tliis dissertation examines two different topics in econometrics. The first part of the dissertation is related to the higher order asymptotic theory, which is presented in Chapter 2. For most of the econometric problems the exact dis tributions of estimators and test statistics are not known. Then as a remedy we can rely on asymptotic theory. The limiting distribution of a statistic can be used to infer an approximate distribution for the statistic in a finite sample. The central limit theorem provides us such an approximation. But as it is pre sented in the literature small sample accuracy of this kind of approximations are often not accurate enough. This situation directed econometricians to ben efit from the approximation techniques devised by mathematical statisticians. Edgeworth and sadllepoint expansion are some of these methods. It is called as higher order theory since according to these methods the first few terms of asymptotic expansions of distributions is used instead of the first order normal or chi-squared approximations.
Although there is an extensive literature about higher order asymptotic theory in mathematical statistics, the use of these techniques among econome tricians have been slow. The techniques devised were dealing with expansions of distributions of sums of independent and identically distributed random vectors at the beginning. The expansions was in general for the univariate statistics. As Rothenberg (1984a) points out, the increased interest about the issue among econometricians forced the statisticians to generalization of expan sions to more complex problems, like multidimonsional cases with dependency.
nonlinearity etc. The approximation to these complicated problems requires difficult computations, but the advances in this area are still continuing with the new applications in econometrics.
In this direction, in this study we attempt to get better approximation by the application of Edgeworth expansions to some test statistics. We have used the classical trio of the test statistics, namely, likelihood ratio (LR), Wald and Lagrange multiplier (LM). However, firstly, we present the higher order asymptotic theory in Section 2.1. Considering the complexity of the topic, this section is attempted to be presented at a simple level. It especially covers the techniques used through this chapter in the dissertation. Therefore it provides the formulas related to the expansions of one dimensional statistics. Some preliminary notation and definitions are also presented in this section.
Section 2.2 presents the literature study. Although there have been a few surveys about econometric applications of asymptotic expansions to the best of our knowledge, increased interest about the subject has given rise to new researchs to emerge. The studies in this area are related to a wide variety of problems such as autoregressive and simultaneous equation models. In tins section we only present the previous studies that are related to approximations to test statistics.
Section 2.3 provides the definitions of the test statistics and techniques to compare the performance of test statistics. The concept of stringency will be introduced. The theoretical results related to efficiency of test statistics is pre.sented. Asymptotic equivalence of the test statistics will be presented as a result of the first order theory and the higher order efficiency of test statistics will be discussed.
After that point the dissertation presents an application to a simple model. Section 2.4 provides the statistics for testing the first order autocorrelation in a stationary process. If there is a. uniformly most powerfid test (UMP), than it is not possible to improve upon this test. So it is unnecessary to use other test statistics. Ilovewer, UMP test does not exist in all hypothesis testing problems. Also, we can include test for autocorrelation in this category. In this context, different tests are proposed for these types of hypothesis testing problems. LM, Wald and IjR tests are among them.
For the test statistics, firstly we calculate the empirical critical values and powers through Monte Carlo simulations and then try to get good approxima tions for reasonable sample sizes. The comparisons of test statistics have been condiict<id by using accurate approximation formulas instead of empirical ones. Our comparison method is stringency. Regarding to this the shortcomings of the tests are compared.
.According to the first order theory the test performance of the LM, Wald and LH tests are equivalent. Engel (1984) shows that the asymptotic local power curve of the three tests are the same. If they are asymptotically eciuivalent the choicii between the test statistics should be according to ease of com])utation. Milt the higher oı·<l<·r theory suggest the performanci* of tli(‘ three tests ar<‘ differing and the results of the higher order theory are in favor of the LR test.
The aim of this dissertation, therefore, is to see the situation for the test of first order autocorrelation. The significance of this thesis is mainly to clarify the finite sample performances of the test statistics for the first ord<;r autocor relation model. Also, this study presents the formulas for the critical values and the power curves of each tests, so that this results could be replicated without the need of Monte Carlo simulations. We hope that the formulas for
the critical values could be used for applied studies to test for first order au tocorrelation.
Chapter 3 develops a normality test based on robust regression and discusses its improvement on other normality tests. The consequences of violation of the normality assumption of regression residuals are known, and many test statis tics devised for testing the normality of residuals. See for example Pierce and Gray (1982), VVdiite and McDonald (1980) and Pearson et.al. (1977), Urzua (1996) and Jaixpie and Bera (1987) for the descriptions some of these tests and discussions about their powers.
One difficulty related to normality tests is that the residuals are not directly observaTle. So the tests developed for these purposes depending on estimated residuals which are the ordinary least squares (OLS) ones. On the other hand, it is also known tliat OLS estimators can highly be influenced by the outliers. In oth<!i· words, outliers and nonnormal errors may easily be maslasl in an OLS analysis.
For the identification of the outliers some robust techniques are developed. For instance. Least Trimmed Sipiares (LTS) estimator, which is introduced by Roiisseeuw (1984), is one of them. Since the robust regression reveals tlie out liers, it may provide a clearer indication about lack of normality of resirluals. I'he main idea in this chapter is to use residuals from a robust estimator (L'l'S) instead of OLS residuals as the basis for normality tests. Although it seems a clear idea, there does not seem to be such a study in the literature. In this context, we can say that this part of the thesis fills this gap in the literature and presents the effect of the use of robustified normality tests through simu lations and applications on some real data s<?t.
Thoi normality tests developed by Jarcpie and Bera (1980) and Doornik and Hansen (1994) are very popular regarding regression applications. We have se lected these two tests in our analysis as the standard normality tests. Section 3.1 presents these statistics, with their explicit formulas. As in most of the normality tests the statistics depend on sample skewness and kurtosis. Section
3.2 introduces the LTS estimator. Also, the general tdgorithm to find the es timator is presented. In Section 3.3, some motivating examples are presented. However, first the calculations of critical values are conducted through Monte Carlo experiments. Section 3.4 develops the simulation study. In this section the comparisons of the tests are presented. The situations in which the robust tests have improvement over the standard normality tests are examined. Sec tion 3.5 presents some applications to data sets from economic literature.
Finally Chapter 4 is devoted to concluding remarks regarding to the success of higher order approximations in our application and the success robust tests of normality. Also, the recommendations for the directions of further research are given in this chapter.
C H A P T E R II
A S Y M P T O T IC E XP A N SIO N S FOR T E ST
STATISTICS
2.1
Higher Order Asymptotic Theory
2.1.1 Introduction
Exact finite sample distributions of estimators and test statistics are not avail able in most of tlie cases. Then a solution is to rely on asyinjitotic theory. Several approximation methods devised for this purposes. Techniques for approximating probability distributions have been studied by mathematical statisticians since the nineteenth century, and there is an extensive literature on this subject.
It is possible to obtain approximate distribution of an estimator or test statistic as the sample size becomes large. The central limit theorem provides us with cipproximation to distribution of estimator. Similar approximations are used for test statistics although the limiting distribution is often chi-squared rather than normal. It is also possible to get better approximations through higher order asymptotic expansions. Edgeworth expansion and sadll<;point expansion ar<j the two well known methods for obtevining the higher order ap proximation to distribution functions. There are also different approximation rruîthods (see Rothenberg (1984a) for tlie alternative methods). But as Mag- dalinos (1992) points out, these ad hoc methods may lead to more accurate
but less interpretable I'esults relative to asymptotic approximations, so may not be suitable for theoretical work.
We will give the emphasis to the I'esults related to univariate distribution limction, since the econometric application of the asymptotic expansions will be for the univariate case in the dissertation.
2.1.2 P relim in a ry N o ta tio n and D efin ition s
We will adhere closely to the notation presented here throughout the disserta tion.
The cumulative distribution function ((T )F ) is d(;noted by F and the cor responding distribution function is / . The CDF of a standard normal random variable is represented by and its distribution function by </». Normal distri bution with mean /i and variance cr will be denoted by N{fi,a). The notation
will be u.sed lor chi-squared distribution with k degrees of freedom.
b(;t X Ixi a random variable. F ( X ) represents expected value of X, while V ar { X ) the variance of X. With liderence to a sequence {A ',} of random vec tors, the abbrevation i.i.d. will stand for “independent and identically dis tributed” . The probabilty of an event will be indicated by P{.).
D efin ition 1 Given two sequences o f real numbers { « „ } and we say that a„ is o f o rd e r denoted = 0{itn), if there exist a constant M > 0 such that \a,Jnn\ < M fo r all n. Clearly a„ = 0 (1 ), if the sequence is bounded.
D efin ition 2 Given two sequences o f real numbers {«,,} and { we say that «„ is o f low er o rd e r than denoted a„ = if
a„
Clearly a„ = o{un) implies that « „ = 0 (w „).
D efin ition 3 (Convergence in Distribution)
X „ con verges in d istrib u tio n to a random variable X with distribution function F(X), if limn-^<x,\Fa{X) — /'’(-V)| = 0 at all continuity points o f
F(X). This is written as Xn X
D efin ition 4 If X is a scalar random variable with distribution function F, its ch a ra cteristic fu n ction is defined as '4>{t) = E t x p { i t X } , where t is real, E represents the expectation with respect to the distribution o f X, and i = y/—l
D efin ition 5 The r-th m om en t o f X is given by the r-th derivative o fi~ ’’ il’ il) evaluated at zero;
E {X^) = / - ’■0<’ )(O).
D efin ition 6 The function K { l , X ) — h’ (t.) — togi/i(t) is called the. ciim ulant g en era tin g f u n c t i o n The r-th derivative ofi~^K{t) evaluated at zero, is called the r-th cum ulan t o f X and is denoted by;
Kr = r 'i & H o ) .
R em a rk : k\ is the mean and «2 is tlie variance.
2.1.3 C entral L im it T h e o r e m
The centriil limit tlioiorem is the basic theorem of the asymptotic theory, through which it is possible to approximate the distribution of many statistic as normal.
T h e o r e m 1 (Lindeberg-Levy Central Limit Theorem) Let {X|} be i.i.d. with mean fi and finite variance <7^. Then
1 n
P r o o f: Rao (1973:127)
It is possible to generalize this result to non-icleritical distributions and multivariate case (see Serfling (1980) for the central limit theorems in general cases).
Berry-Essen th(;orem gives an explanation to the accuracy of tlu“ central limit theorem. It is related to the difference between the exact distribution of the standardized statistic and the standard normal distribution.
T h e o r e m 2 (Berry-Essen)
Suppose X i...X n (ire i.i.d. random variables with EX{ = { ) , E X f = a^and = />< oo. Let Fn{l) be the CDF o f S„ = X , ) J ^ i a ) .
sup |F„ (0 - 4>(<)| < P r o o f: see Bhattacharya and R a o(l976:110).
2.1.4 E d g ew orth E xpan sion
The central limit theorem provides us approximation of test statistics. This is certainly a powerful tool but unfortunately in many cases these approxi mations are poor in quality and does not provide a good accuracy unless the sample size is very large. Many techniques have been devised to ¡ncrea.se the accuracy of the approximation to the test statistics.
Edgeworth expansion is one of these methods. This is an expansion in pow ers of The asymptotic approximation of the central limit theorem is the leading term in the Edgeworth expansion. So it can be seen an extension of large-sample techniques based on central limit theorem. The central limit
theorem provides us an approximation of order We will call it as a first order approximation. Besides we will <levelop Edgeworth approximation accurate of order and call it as third order approximation in this sec tion. More generally a k-th order a[)proximation will be one of order
In order to make the approximation we will benefit from the Taylor expansion.
T h e o r e m 3 (Taylor Expansion)
Let the function <j have n-th derivative everywhere in the open interval (a,b) and (n-l)-th derivative continuous in the closed interval [a, b]. Let X € Eor each point y G [«, b], y ^ x, there exists a point z interior to the interval joining x and y such that
, / ( . - / ) = + Î ;
- *)‘ +
A·! n!
Edgeworth expansions requires the use of the higher order cumulants. We will need the following preliminary results related to CGE’s and cumulants.
L em m a 1 (Properties o f CGF) Let K(t,X) be cumulant yeneratiny function o f X. It has the following properties;
K ( t , a X + b) n t = l />·((, A') itb -(- K(at, X ), è A'((, A'.), *=1 C» 1=1
P r o o f: The first two equations follow from the definiton of cumulant gener ating function, the last one can be shown by 'faylor expansion.
L em m a 2 (Properties o f the cumulants) Let Kj[x) be the j th curnulant o f X.
i = l
Kj(X + ¿) Kl(X + 6)
i= l
*/ i > 1,
P r o o f: I'ollows IVom l.lic |)ro|x‘rl,i<‘.s of n iiiiiila iit gciK'niiiiig liincl ions.
R em a rk s: Let fi. be the mean and cr the standard deviation of X . From the properties of cumulants follows that, the curnulants of standardized variable are «j((-V — h)/(t) = Kj{X)/a^ for j > 2, while « i = 0 and «2 = 1 for the standardized variable. The third curnulant of the standardized variable called as skewness and the fourth cumulant as kurtosis. For a standardized variable
«3 is the third moment and the /c,i is the fourth moment less three. For a normal random variable all cumulants greater than two are zero.
Let X\...Xn be i.i.d. random variables with common density function / and E {Xi ) = 0 and Var(xi) = 1 and Xi posseses derivatives up to the fourth order. Let 0 be characteristic function associated with / , then the CGF /o</0 can be expanded around zero as a power series through Taylor expansion:
log4>{t) = 2(^0^ + + "M
where is the r-th cumulant of / .
The standardized sum Tn = J2 Xi/\/n a\so has zero mean and variance one; let fn and 4’n be its density and characteristic functions. Then,
logipn(t) = nlogil;{l/s/n).
This follows from Lemma 1. By the Taylor expansion of the CGF,
Taking the exponents,
V>„(0 = ea;p(/i>.#„(/)),
Since has the expansion 1 + .t + if we expand the second term,
, /X 1 /·^ з 3«4(i 7)‘‘ + \
( l + + . . . ) . 0 )
L em m a 3 If f has characteristic function 4>{t), then the first derivative / ' has characteristic function '(l^jt{t) = —¿/?/^(/).
P r o o f: Let ¿¿(.t) = and dv{x) — f'[x)dx^ from integration by parts
/
00 poou{x)dv{x) = «(;c)e(x)|!°oo “ / v{a^u\x)dx,
00 J —00
- - f
f {x)dx —
From this result by induction follows that, if / has the characteristic function
0(<), then the r-th derivative / ’’ has chariicteristic function ( —
L em m a 4 (Fourier inversion) Let be cfiaracterislic function forTn- The density function fa fo r Tn can be written as:
1
/(a·) = ^
y
e - V (0d/. (2)T h e o re m 4 (Edgeworth Density)
Suppose Xi are i.i.d. with mean 0 and variance 1, and «3 and K4 the ski wncss and kurtosis, respectively. A third order approximation to density Ta = X] X,/\/n is
f(x)
«<Hx) +
P r o o f: The result follows through application the Fourier inversion formula in Lernma(4) to characteristic function in Rquaton (1) and dropping the higher order terms. Ily using the Lemma (.3) and the fact that characteristic iunction of (?!>(.r) is the desired result is obtained.
D efin ition 7 A lltrmite polynomial o f degree r is
Using the Hermite polynomials, we can write the third order approximation to the density Tn as:
/(X) P. «X) (l + ¡^ //:,( x ) +
.
(3)
It is easily checke<l that,
H[ ( x) = X, I h i x ) = “ 1, iJ'^ix) — x^ — 3x, I h { x ) = a-·“* — 6a·^ + 3, Hs{x) = x^ - 10u;3 + 15x, //«(x ) = x*^ - 15x' + -ISx^ - 15.
Integration of the Edgeworth density in Equation (3) gives us the approxi mation to the cumulative distribution function:
Fn{x) ^ ^
) 3 / c . i / i / 3 ( x ) - f K f j H a [ x )
72« (4)
The approximation in Equation (4) is called cis Edgeworth-A expansion. Note that the Edgeworth expansion is not a probability density since it does not integrate to one and can take negative values. The following formula avoiils thi.s problem.
T h e o r e m 5 (Edgeworth-B Expansion) Another third order approximation to the cumulative distribution function is given by
r.. .
. . i
- 1) , 3«,(3x - x^) -f «2(8x^ - 14x)'Fn{x) « ^ h r --- + --- (5)
6v/n ' 72«
P r o o f: Let a, b, be unknown quantities. By Taylor expansion of P = <l>(x -f a j ^/n -f- bln),
= ^ (x ) + -^<f>{x)
-J---y/n n
Matching the terms of order 1 jy/n to tlie ones in Equation (4) we see that, a — If we put the value of lltu rnite polynomial, we get the value of a. Matching the terms of order 1/n and solving for 6, yields the formula of the theorem.
From Edgeworth-B expansion it is possible to have an inversion, called as the Cornish-Fisher expansion. The inversion is related to a representation of a random variable by asymptotic exi)ansion in terms of a standard normal variable.
C o ro lla ry 1 (Cornish-Fisher Inversion)
Let c* be the upper a quantile, i.e. the solution fo r fixed a o f the equation F{c*) = Oi, where 4>(cc) = a. Let a( x), b( x) be as defined in Theorem 5, where a'{x) be the first derivative o f a. Then,
a{ca) a'{cc)a{cc,) - b(Ca) t-a = Ca - +
y/n n
is a third order approximation. P{Tn < c*) — o goes to zero at rale
P r o o f: Let c* = Co, + f J\/n-\r gin. Then,
P{Tn < c^) = $ f c ; + ^
y/n n
Substitute cl. Note that a (c·) « a(ca) + fa'{ca)/y/n and 6(c*) «s 6(c„), where these approximations gives the required degree of accuracy. So,
nr..
<o
= * ( . „ + .Since 4>(ca) = CV, we must set the higher terms to zero to get the desired accuracy. So, / = - a ( c ^ ) and g = «(c^)«'(c<,) - ¿>(c„). We can get the approx imation by substituting the values of / and g.
Expansion under General Condilions
Until this point we have discussed asymptotic expansions of independent and identically distributed random variables. Following the procedure in Rothen berg (1984a) it is possible to develop higher order approximations for more general cases. Now we will make a summary of his approach.
Let T„ be a standardized statistic having stochastic expansion:
Tn
= A',. + 4 ?= + — + - % ■ y/n n riy/nwhere .Y„, An, Bn are sequences of random variables with limiting distributions as n tends to infinity. Suppose /?„ is stocastically bounded and the limiting distribution of Xn is A^(0,1). Let T = X „ + + Bnn~K Suppose, T' has finite moments up to high order and its r-th cumulant is order of n "12-r )/2^ wliere /· is greater than 2. Furthermore, su|>pose the mean and variance can be written as:
E ( r ) = y 11
V a r { r ' ) = 1-h --H o(n ~ ^ ). n
where a and b depend on the moments of Xn, An and Bn- The restandardized variable is,
V -a !y / E
Its third and fourth moments are
\/l + V n
E i ^ r f = ^ - H o ( n - ’ ), y 11
E ( r Y = 3 - f - - h o ( n - ‘ ). 71
here c/\/n and d/n is the approximate third and fourth cumulants of T' re spectively. It is clear that
P { T < x ) ^ P f ' r <
V
\A + b/n )
if we expand the term in denominator in Taylor series and dropping the terms of order we get
Now it is possible to approximate P (T < .x·) by using Edgeworth-B expansion in E(|uation (6) replacing c with «3 and d with «4.
P{Tn < x) Ф (,X 4” — ~—7i + 7=:---(-, 7зх + 74^“’ 6s/Ti 72n
) ·
where71 = c — da·, 73 = 9d — Hc^ — 306 -f 24 ac;
72 = — c; 7,1 = 8c^ — 3d.
In a similar way we can get Edgeworth-A expansion.
It is j)ossibhi to generalize the results for the one-dimensional Edgeworth expansion to the iniiltivariat<! cas(!. It is again through tlu; expatision of char acteristic function and Fourier inversion. Barndorff-Nielson and Cox (1979) and Skovgaard (1986), McCullagh (1987) are some of the studies about the multivariate Edgeworth expansion. For the use of Edgeworth expansion lot- different statistics under different condititons see Barndorif-Nielson and Cox (1989).
2.1.5 Saddlepoint Approximation
In general the Edgeworth expansions provides a good approximation in the center of the density but can be inaccurate in the tails. Saddlepoint approxi mation, which is called also as tilted Edgcioorth expansion, gives more accurate
results especially in tails of the distributions. It was developed by Daniels (1954). Daniels (1956) and Phillips (1978) have applied the method to auto correlation statistics. Since we don’t benefit from this tecnique in our analysis, we will not explain it in detail. Field and Ronchetti (1990) explain the saddle- point technique including different applications. Jensen (1995) contains many results, applications and a survey of literature. The general idea can be sum marized as follows. First the distribution is recentered at the point where the distribution is to be approximated. Then the Edgeworth expansion is used locally at that point and then the results are transformed back in terms of the original density. One difficulty about this approximation is it requires knowl edge of the cumulant function and is more complex relative to Edgeworth expansion.
2.2
Literature Survey
Although there is an extensive literature about the higher order approximation theory by mathematical statisticians, the application to the econometrics not have a long history. Since 1970’s then; has been increasing interest about this issue. Today asymptotic expansions are used in different to[)ics of economet rics. Phillips (1980) and Rothenberg (1984a) made a survey of econometric applications. But since that time many new applications take place in the literature. Tlie emphasis in,the present survey will be on the econometric applications of asymptotic expansions for test statistics. But first of all we will investigate the studies about higher order asymptotic expansion of test statistics.
There are some survey papers that evaluate the performance of testing pro cedures through the higher order asymptotic expansions under local alterna tive. Bickel (1971), Pfanzagl (1980), and Rothenberg (1982, 1984a) are some
of these studies. The formal expansions are given for the univariate case in Chibisov (1974) and Pfanzagl (1973). I he main results contained in Pfanzagl and Wefelrneyer (1978). For the multivariate case there are the studies of Peers (1971), llayakiiwa (1975,1977), Harris and P(!(irs (1980), llayakawa and Puri (1985). Cordeiro et.al.(1994) develop formulae for test statistics in generalized linear models, llayakawa (1977) and llayakawa and Puri (1985) present also the asymptotic expansions of some test statistics for testing the hypothesis against fixed alternatives.
While much of the literature examined the case of independent and identi cally distributed random variables, some papers extended the calculations to certain time series settings. Taniguchi (1985) derives the asymptotic expansion of some test statistics for a gaussian autoregressive moving average process.
Cribari-Neto and Zarkos (1995) obtain Bartlett type corrections to Wald, LM, and LR test statistics for the multivariate regression model. They com pare their results with the size corrected critical values through simulation. They found in general their approach more effective.
For the econometric applications of higher order approximations, it is nec essary to know the validity of expansion. Chandra and Ghosh (1979,1980), Sargan (1980) presents the theory of the validity of Edgeworth expansions in the i.i.d case. Sargan(1976), Sargan and Satchell (1986) and Phillips (1977b) make general extension of the validity theory to time series. Magdalinos (1992) develops a method of proving the validity of Edgeworth type approximation in econometrics.
The econometric applications of higher order asymptotic expansions of test statistics are conducted according to the applications of general formulas de
vised by the studies above to econometric problems. Now we will list some of these studies.
Autoregressive Model:
P.C.B. Phillips has been one of the pioneers in applying asymptotic expan sion to the first order autoregressive AR(J) model. Phillips (1977a) obtained the Edgewortli expansion of the least squares estimator and associated t ratio test statistics for the A R (1) model with zero mean for a stationary process. Then comparisons between the exact, first and second order approximations of the lest squares estimators are made for the finite sample sizes. The exact distributions are calcuhvted by numerical intoigration.
danaka (1983) extends the results of Phillips (1977a) through getting higher order expansion for the estimator of A R (1) model with unknown constant mean. He also obtains t ratio tests based on these estimators. The exact dis tributions are calculated through the Monte Carlo simulations and some corn- paiTsons between exact and approximate distributions are made. According to the Phillips’ and Tanaka’s studies the higher order asymptotic approximations are not satisfactory for finite sample distributions (for a sample size of 20-30) of estimators and test statistics. For a less stable model less satisfactory results are obtained.
Roth(inberg (1984a) examines autoregressive models with a stable root in his survey. In this study, the approximations related to the autoregressive models seems to be satisfactory for small values of the estimators. Edgeworth approximations are not .so accurate for small samples and small values of esti mator.
There are also other approaches to approximate sample statistics from au toregressive models. Daniels (1956), Durbin (1980), Phillips (1978) and Wang (1992) derived saddlepoint approximation for the least squares coelTicient. Phillips’s (1978) compares Edgeworth expansions with saddlepoint expansion. Both approximations are found unsatisfactory for small sample sizes and large least squares coefficient. Saddlepoint approximation is not defined in the tails for small sample sizes and Edgeworth approximation distorts substantially in th<‘ tails. Wang (1992) <rxt(;nds bugannarii L· Pice’s (1980) .saddlepoint approx imation method to the problem and shows that his approxiiruition performs better relative to other approximation methods for the distribution including the extreme tail and sample size as small as 10.
The case of unit root attracted most of the researcher and there has been a lot of studies about the asymptotic distribution of the test statistics for the autregressive models having unit root as the null hypothesis. Dickey and Fuller (1979, 1981) and Evans Savin(1981,1984) are some of these researches. Phillips (1987a) generalized these results by generalizing the assumptions on error terms. The major results of these studies is tliat the asymptotic distri bution have a discontinuity around one and therefore the finite sample per formance of the statistics are poor. Therefore Phillips (1987b) develops an asymptotic theory for a first order AR model covering the possibility of a root near unity. Perron (1989), Nabeya and Tanaka (1990) and Perron (1991) tab ulate the limiting distribution of the least squares estimator in a AR(1) model where the true model is near-integrated. Nabeya and Tanaka (1990) and Pc;r- ron (1991) exartnne the limiting power of unit root tests. Abadir (1998) derives the closed forms for the distribution of conventional statistics to derive asymp totic power functions of some unit root tests.
Related to higher order approximation Phillips (1987a) developes asymp totic expansions for the unit root case. But the improvement is not examined. Larsson (1995) derives saddlepoint approximation of some test statistics in near-integrated AR processes. .Some exact formulas for the distribution func tions are also presented. Simulation and numerical calculations show that in most of the cases the approximations work reasonably well.
Simultaneous Equation models:
Rothenberg (1984a) presents some examples of higher order asymptotic dis tribution for simultaneous equation models. Related to the higher order power comparisons of test statistics he suggests that Wald, LR and LM test are asymptotically efficient after size correction. In more complex, full informa tion models the power functions for the three tests cross. Edgeworth expansion to the distribution functions of some test statistics under the null hypothesis ar(! given in Sargan (1975, 1980).
Morimune (1989) examines the properties of the t tests associated with or dinary least squares, two-stage least squares, limited information maximum likelihood estimators in a structural equation. He benefits from asymptotic expansions of t statistics to find out deviations of real sizes from nominal sizes theoretically. The asymptotic expansions confirm the results of Monte Carlo experiments. The limiting t distribution are not found appropriate as null distribution for some cases. Modified t test statistics were proposed as a byproduct from the asymptotic expansion.
Magdalinos (1994) is concerned with the n'lative performance of the sev eral tests for the admissibility of overidentifiying instrumental variables. He
calculates the size corrections to the order where 7’ is the sample size. The local power function of the size corrected tests is found to be same to the order T “ *.
There are different test statistics for testing the overidentifiability condi tions on a structural equation in siniultaneaus equation system. Kunitomo et.al. (1983) and Magdalinos (1988) derives the distribution of test statistics through asymptotic expansions. Magdalinos (1988) compare the performance of the tests using higher order local power of the tests.
Magdalinos and Syrneonides (1996b) reinterpreted the tests of overidenti- fication restrictions as the test of overidentifying orthogonality conditions for the simidtaneous equation models, 'hhe third order local power of various tests under the alternative of false orthogonality conditions is derived and the for mulations found to b<; the same.
Boolslrnp:
It is known that in many econometric problems bootstrapping can give greater accuracy than asymptotic normal distribution. Through Edgeworth expansion it is possible to show the accuracy of the bootstrap estimates and tests (see Zarnan (1996) for details related to the subject). Rayner (1990) de rives estimates of p values and critical values through bootstraping the stan dardized estimator of the coefRcients in the normal linear regression models where the error precision matrix depends on unknown parameters with er ror t»(7’ “ ‘ ). It is also shown that through the bootstrapping of Rothenberg’s (1984b) variance adjusted statistics it is possible to obtain test statistics with errors o{T~^).
Hall and llorowitu (1996) get improved critical values for the test of overi dentifying restrictions and t test based on generalized method of moments through bootstrapping the test statistics. By the use of Edgeworth expansion it is shown that bootstrap provides imjirovement over first order approxima tion of the asymptotic theory. The Monte Carlo experiments also support this result.
McManus et.al (1994) suggest like Hall and Horowitz (1996), to use the bootstrap critical values for a better approximation. They show that the ap proximation of the asymptotic theory is poor for finite sample sizes, when the partial adjustment model with autoregressive errors is nearly nonidentified.
Ileteroskedasticity:
Maekawa (1988) apply general formulas of Ilayakawa (1975) and Harris and Beers (1980) for the LR, LM and Wald tests to detecting heteroscedasticty in regression models. He gets asymi)totic expansion of the non-null distribution of the tliree tests up to 0(T '~ ’ /^). T1 irough powiir comparsion, none of statistic is found uniformly superior to the others. But if the moments of the exj)lana- tory variable are stable over the whole sample period, then the asymptotic power up to 0(T~*/^), is equivalent for the throie tests.
The asymptotic theory provides poor approximation for the null hypoth esis of homoskedasticity. Iri order to imi)rove the approximation, Attfield (1991) made Barlett corrections to the LR test statistic for different types of heteroskedacticity in the linear model.
A similar work is conducted by Honda (1988). By using the general formula for the LM test developed by Harris (1985), he provides the formula for the
size correction to the LM test for heteroskedasticity. Tlirough Monte Carlo experiment, he indicates the improvement in the accuracy of the size of the test. The use of size corrected LM test increases the power of the standard LM test.
Further Applications:
For the statistics where error covariance matrix is nonscalar and depends on a set of unknown parameters, exact analysis is difficult and asymptotic approximations takes place. Rothenberg (1984c) has used Edgeworth expan sions to evaluate different testing procedures for the regression coefficient of the normal linear mod<4 with unknown covariance matrix. General formulae for the multii)arameter Wald, LR and LM tests are derived and the test statis tics are compared. Rothenberg obtained adjusted critical values so that the three tests have the same size. The third order approximate local power func tions indicate that when null hypothesis is one dimensional, cdl three tests are equally powerful. When the hypothesis is multidimensional none of the tests is uniformly powerful than the others.
Magee (1989) has applied Rothenberg’s (1984c) size correction to Ftest of linear hypothesis in the linear regression model witli A R (1) errors. The simu lation results are in favor of these corrections.
Magdalinos and Symeonides (liliKia) derives alternativ(; ciritical values for Rothenberg’s (1984c) testing problem, using lidgeworth expansion based on F and t distributions which are locally exact,i.e. they reduce to the exact critical valiKîs when the error covariance matrix known up to a multiplicative (actor. They also suggest instead of size correction to use Cornish-Fisher corrections.
The simulation results are found in favor of the locally exact Cornish-Fisher corrections.
Similarly ffothenberg (1988) deals with the problem of testing regression coefficients in models with unknown error covariance matrix. He applies the cipproach in Rothenberg (1984c) for one dimensional hypotheses to get more interpretable results through relatively simpler higher order approximations. Approximate local power functions are derived for these tests. He applies the approximations to two examples, one involving heteroscedasticity and the other autocorrelation. He concludes that size and power correction terms can be huge even in very simple models where the first order asymptotic theory might be expected to work well.
Ther<; are a lot (d" estimators and tests in the form of a ratio of (|uadratic forms in normal variabhis and their exact distributions are not known. Marsh (1998) derives saddlepoint approximations for the distributions of a ratio of noncentral cjuadratic forms in normal variables. He also presents an applica tion to a simple case, F tests in the linear regression model to increase the accuracy of the size and power calculations. The calculations demonstrate that approximate size calculations are in fact exact, whereas those for ¡jowers are of high accuracy.
Although the saddlepoint approximation is an extremely accurate method for approximating probability distributions, as presented in Marsh (1998) it is difficult to apply. Lieberman (1994) proposes a theoretically justified ap proximation to the saddlepoint expansion to circumvent these difficulties. He makes an application to the Durbin-Watson test statistic. It is lound that the approximation of saddlepoint expansion is scitisfactory for sample sizes 40 or more.
The diagnostic checks that seek the evidence of rnisspecification is impor tant for parametric models. There are convert ional moment based test statis tics for misspecification. Chesher and Smith (1997) tixamines potential to use likelihood ratio test to detect misspecification of parametric densities. The advantage of the use of LR test is stilted as its suitable structure for Bartlett correction, unlike conventional moment tests. After obtaining Barlett correc tion of test statistics they present the approximate power of the test under the local alternative. Monte Carlo experiments suggest that LR test can perform well relative to conventional moment based tests.
The information matrix test was introduced by White (1982) to detect the misspecification of likiOihood functions. It is suggested that information matrix test have finite sample distribution which is poorly approximated by its asymp totic chi-squared distribution. Chesher and Spady (1991) presents Monte Carlo experiments which confirm this situation and as a remedy ])roposes to use Cornish-Fisher expansion. For application these approximations information matrix test is defined as efficient score test. As the special case of information matrix test the results for the full information matrix, heteroscedasticty and nonnormality tiists |)resented. I'or moderate sample sizes in the range of 100
to 250 th(; 0(7'" ') approximation to the distribution function are found sub stantially better than chi-squared approximation.
Wald statistics which are based on different but algebrically equivalent re strictions have the same asytnptotic distribiitioti iituh'r the nidi. But the stud ies show that these statistics may be divergent in small samples. Phillips cind Park (1988) tries to explain this phenomena by using a general Edgeworth expansion of Wald statistics. By various examples from the literature they show
that the finite sample distribution of the Wald statistics for testing nonlinear restriction can depend sul)stantially on the algebric form of the restriction.
Curmii and Trivedi (1992) is an example related to the application of asymp totic expansions in the analysis of discrete count data. They derive adjustment factors of the overdispersion tests for truncated Poisson regression models. Through Monte Carlo investigation it is shown that asymptotic expansions improve the performance of these tests.
2.3
LR, Wald and LM tests
Phnpirical verification of hypothesis is very important in economics. The hy pothesis testing is an important tool of this kind of analysis. In this section the most commonly used test procedures: the LR, Wald and LM tests will be discussed. But first, some definitions about hypothesis testing will be pre sented.
2.3.1 D efin ition s
Hypothesis testing has only two outcomes. A statement of the hypothesis is defined as null hypothesis (//o)· If the data fall in a particular region of sami)le space called the critical region then the test is said to reject the null hypothesis. Since there are only two possible outcomes, there are two ways such a procedure can be in error:
D efin ition 8 T y p e I e rror occurs when the null hypothesis rejected when it is true. T y p e II e rro r occurs when the null hypothesis incorrectly accepted.
D efin ition 9 For any test the probability o f Type I error is called as the size o f the test, which is denoted as a and also called as sign ifican ce level.
Definition 10 The power
o f a test is the probability o f rejecting null when it is false. So;power = 1 —
where 8 denotes the Type 11 error.
D efin ition 11 Let the data x are generated by a density function f ( x ,0 ) and the null hpoltu sis be //o : 0 C Bo (x r.sus the alt( rnative //| ; 0 G B|. hor any lest T, suppose R(T, 0) be the probability o f rejecting the null when 0 is the true parameter. Let be the set o f all tests o f size a. For any 6i G 0 i , the maximum possible power any test o f size a can attain is given by the p ow er en v elop e defined as follows:
=
supR{TA)·
T€T.
The sh o rtco m in g S o f a test T E Ta at some alternative hypothesis 0\ G 0 i is the gap between the performance o f T and the power envelope;
S(T A ) =
- m rA )·
We can define also the shortcoming o f a test over all 0\ G 0 i as;
6’ ( T ,0i) = sup S {T ,0,)·
S{T, 01) measures the maximum gap between the power envelope and the power o f a given test, and will be referred to as the shortcoming o f the test. A test having the smallest possible shortcoming in the set % o f all tests o f level a, is called a m ost strin gen t test o f level a fo r testing Ho against IR
2.3.2 T h re e Test P ro ce d u r e s
In this section a general formultition of the three tests will be presented.
Let the data x are generated by a joint density function f{x ,0 a ) under the null hypothesis and by f ( x ,0 ) with 0 6 /Í*·' under alternative. Let 0 be the unconstrained maximum likelihood (ML) estimator and let 0 be the ML estimator subject to the constraint imposed by the null hypothesis. The log-likelihood is defined as L {x,0 ) = lo g f(x ,0 ) and the score as S {x ,0 ) — d L (x,0 )jd 0 . The information matrix is defined as,
2 T
Let 0 be ML estimator. Then it is possible to show that, Varió) = I - ' (0).
The Wald stalistic is,
W = { 0 - Ooyi{0){0 - 0o),
was introduced by Wald (1943).
The Lli lest was suggested by Neyinan and Pearson (1928). It is based on the difference between maximum of the likelihood under null and ¿dternative hypothesis. So, the LR statistic is
u t =
Clearly, LR takes values in interval [0,1]. Ecpiivalently, the test may be carried out in terms of statistic
C = -2lo(j{LR).
While the Wald test is based on unconstrained ML estimator, LM test is based on tJie constrained ML estimator. If the constraint is valid, the con strained ML estimator should be close to the point that maximizes loglikeli- hood. Therefore, the slope of the loglikelihood function should be close to zero at the constrained ML estimator. It is first suggested by llao (19''17) and since depend on the score functions called also Rao’s score function. It can be shown that, the score has mean zero and variance I{0 o) under the null. Therefore
L M = S (x,0 oyi(0 o)S {x,0 u ,).
reject the null for high values of the statistic.
T h e o r e m 6 Under general conditions, the statistics W , C, LM, converge in distrihution to distribution with k degrees o f freedom under the Ho.
P r o o f: see Seriling (1980:155).
The LR test is difficult to compute since it uses the ML estimator from both constrained and unconstrained maximization of the loglikelihood. But for Wald test unconstrained ML estimator and for LM test the constrained ML estimator is needed. In complex model LR test may therefore very difficult to corn[)ute i(;lative to the Wald and the LM tests. But the increased use of computers make LR test also applicable.
2.3.3 A p p ro a ch e s to C o m p a re Test S tatistics
There are a lot of procedure to compare the test stiitistics. Serfling (1980) in Chapter 10 discusses six different approaches. These are Pitman, Chernoff, Bahadur, Bodges and Lehmann, HoelTding, Rubin and Sethuraman. There are also other approaches. Local methods compare tests in a shrinking neigh borhood of the null hypothesis. Pitman efficiency is one of them and the most
popular and widely used criterion. The nonlocal methods compare test per- lormanc(i at a fixed (ihirmuit in the null atid the alternativ(“. Mahadur (“ificii'ncy one of the nordocal methods, looks at the rate at which the power goes to one.
I'he concept of stringency is introduced by Wald (1912) to compare the performances of test statistics. The definition of the concept is presented in Section 2.3.1 The comparisons of the test statistics in Section 2.4 will be done according to stringency.
2.3.4 A s y m p t o tic E qu ivalen ce o f th e T est S ta tistics and H ig h er O r d er E fficien cy
Engel (1984) shows that the Wald, Likelihood Ratio and Lagrange multiplier tests stat istics are distributed asymptotically under the null hypothesis and have the same non-central X^ distribution under local alternative for testing multivariate hypothesis. Furthermore it is found that these tests are asymp totically locally most powerful invariant tests. So these statistics are called as as}mi ptot i cal ly eqni valent.
If the three tests are asymptotically equivalent the choice of them be accord ing to ease of computation. But finite sample behavior of the tests especially in small samples are found different in some of thé stiulies (see for example Bcrnt and Savin (1977) and Evans and Savin (1982)).
Since higher order expansions produce better approximation for small sam ple sizes, the validity of the results related to asymptotic equivalence of test statistics may be questioned through higher order approximation methods. Ilothenberg (1984a) uses tliirtl order approximation to the local power func tion to compare the performances of LM, Wald and LR statistics. He benefits
from Edgeworth approximation in his calculations. Ilis results mainly depend on Pfanzagl and Wefelrneyer (1978). First he gets the adjusted critical val ues for the three tests by using Cornish Fisher expansion derived in Section 2.1.4. Then insert them to the third order power function. So it is possible to compare third order power function with the third order power envelope. As a result it is found that, each test are tangent to the power envelope at different points. The LM dominates all others when power is approximately O', the Wald dominates other when power is approximately 1 — a, the LR test dominates at power approximately one-half, but none of the tests dominates each other. Amari et al. (1987) get similar result through the third order approximation of test statistics (see Figure 7 in Amari et.cd (1987:5)).
The analysis done for the multiparameter case have the following result: For tlie normal linear model the power surfaces crosses and no one is uniformly superior. In nonlinear models LR test has optimal power characteristics in central region of the power curve (see Rothenberg (1984a) for details).
Tlie nonlocal approaches also supports the LR test. Hoefftling (1965) and Brown (1975), Bahadur (1966), Kallenberg (1982) establishes the superiority of LR to other tests.
2.4
An Aiiotocorrelation Example
The purpose of this section is to compare the performance of LM, LR and the Wald test for testing autocorrelation by using higher order expansion of the test statistics.
Consider the stationary A R (1) model:
Vt = p Vt - i St
for ¿ = 1,2, ...jTwhere j/o ~ -/V(0,1) and £i ~ N{Q,a'^) and <r^ = 1 — p^.
We test the null hypothesis /? = 0 versus alternative p = pi for some fixed /> > 0.
Let y = (i/o,Z/i, •••,2/r)^The likelihood function can be written as: l(y) = ¡{yo)liyi\yo)-l(yt\ y(t-i),y{t-2)-yo)
So it is equal to
The Neyman-l’ earson (NP) statistic is;
Ky\p = Pi)
NP{0,pi) =
l{y\p = 0)
yVP(0,p ,) = (1 - p i Y '^'^^^exp{-^^^J2L·ıİУt - PiVt-i)^) E L i y'r)
Dropping the constant term and taking logs the Neyman Pearson test takes the following form:
I 1 ,
yVP’ (0,p,) =
-
2 p ii/tj/t-i +plyti) +
7yyh
i=l “ i=l
pi T T
-
/’(
5^!/? +
0-Vl(»o + !'t) ) ■
,=oDropping the constant pi/{l - p\))^ NP stcitistic becomes;
7 V P "(o ,p .) - p , [ Y i A - ^ . ^ { y l + y l ) ] . <=i . <=0
In order to get higher order approximation of the NP statistics we not'd to standardize it. Using the following Lemma’s it is possible to get the formula of the first and second cumulants of NP.
L em m a 5 Let A be a real diagonal malrix, and u ~ A'^(0,/ ) . The cumulants Kk{h = 1 ,2 ,...) o f the distribution u'Au are
Kuiu'Au) = - l)!/rA'*.
P r o o f: see Magnus( 1978:203).
L em m a 6 Let A be a symmetric matrix, and e ~ N{Q, V ), where V is positive definite. The cumulants Kh{h = 1 ,2 ,...) o f the distribution e'V e are
Khie'Ve) =
2<'‘-')(/i - l)!ir(/n /)'‘.P r o o f: Since V is positive definite, there exist a unique, positive definite and symmetric matrix 1/*/^ such that = V . Let T be an orthogonal matrix such that
= A,
where A is a diagonal matrix containing the eigenvalues of on its diagonal. Then
s'Ac
= (e'\/-*/^T )(T Y -'/‘M l /- '/^ ) ( T T '’ /^£) =u\u.
Hence
Ku{uAu) = Ku{e'Ve),
and
/rA^‘ = = tr {A V y
The last eqiuility follows from properties of trace.
N P statistic can be written as follows:
S jj = where S ,j denotes the i j ’ th element of the covariance matrix.
M = —pil
+0.5pi{l'J\ \
-|-E']'+\,T+\)
+ Ü.5J,where I is an (T + 1) x (2’ + 1 ) identity matrix; is an (T + 1 ) x (T d -1 ) matrix which consist ones at and zeros everywhere. J is a (T + 1) x (T + 1) symmetric matrix, which has ones on the first sub and super diagonals and zeros at the rest.
According to Lemma 6, K j{y'M y) — — J)!Lr((EA/)^) The first cumu lant and second cumulant under the null hypothesis can be expressed in simple formulas.
K\(p,pi) = T( p- pi ) ,
(6)«i(0,pi) =
-T pi,
(7)«2(0,^ ,) = 2 i r ( ( E M f ) = T - f - 2 ( r - 0 .5 ) /> î . (8)
But for the higher order cumulants the formulas becomes too comi)lex.
Then the NP statistic is standardized so that; iVP” (0,p i) + 7>x
NP'(0,pi) =
v / T - f 2 (T -0 .5 )/)x 2 (9)
2.4.1 C ritica l V alues
We considered 5% significance level tests. In order to obtain sample value of N P ' statistic, yt for t = 0,1,. ..,T are generated under the null hypothesis;