Emerging Science Journal
Vol. 4, No. 4, August, 2020A Machine Learning Approach to Predict Creatine Kinase Test Results
Zehra Nur Canbolat
a, Gökhan Silahtaroğlu
a,b, Özge Doğuç
a*, Nevin Yılmaztürk
ba Management Information Systems, Istanbul Medipol University, Istanbul, Turkey b Pusula Enterprise Business Solutions - Research and Development Centre, Istanbul, Turkey
Abstract
Most of the research done in the literature are based on statistical approaches and used for deriving reference limits based on lab results. As more data are available to the researchers, ML methods are more effectively used by the clinicians and practitioners to reduce cost and provide more accurate diagnoses. This study aims to contribute to the medical laboratory processes by providing an automated method in order to predict the lab results accurately by machine learning from the previous test results. All patient data obtained have been anonymized, and a total of 449,471 test results have been used to build an integrated dataset. A total of 107,646 unique patients’ data has been used. This study aims to predict the value range of the Creatine Kinase tests, which are taken in separate tubes and usually needs more processing time than the other tests do. Using the lab results and the Random Forest Algorithm, this study reports that the outcome of the Creatine Kinase test can be determined with 97% accuracy by using the AST and ALT test values. This is an important achievement for the practitioners and the patients, as this study submits significant reduction in Creating Kinase test evaluation time.
Keywords: Laboratory Tests; Creatine Kinase; Data Mining; Machine Learning; Decision Tree. Article History: Received: 11 May 2020 Accepted: 22 July 2020 Published: 01 August 2020
1- Introduction
Developments in technology and informatics including predictive methods in the field of machine learning and data science have attracted attention of medical researchers and practitioners in recent years. Machine Learning (ML), or in broader sense data science, has been used in medicine in the service of various objectives like better diagnosis, more effective treatment, reduction in cost and labour; and faster and better quality laboratory analysis [1]. Using ML in laboratory medicine offers significant improvement in laboratory organization and contribute to basic skills of lab experts along with considerable changes and innovation in this domain [2]. First, laboratories play a critical role in today's health systems. In spite of high throughput with low turnaround times, demand and capacity to analyse data in specific areas has decreased [3]. This often results in practitioners ordering more tests to make a diagnosis than it is necessary.
While, more tests can be essential to make better diagnoses, this practice also increases overall cost of treatment for both patients and institutions. On the other hand, most hospitals employ Laboratory Information Systems (LIS) and they are mostly digitalized, thus there is plenty of lab data available for data analysis [4].
Most hospitals have already organized and integrated their databases with personalized lab data in order to provide their patients with test results through web pages [3]. Using LIS and related data, some tests may be predicted based on the other tests done. This will not only reduce time and cost to obtain the test results, but also will give practitioners broader vision at making decisions. Analyses performed in the medical laboratories include measurement of tests, determination of presence or absence of various substances or microorganisms in the sample. Laboratory services required for patient care are expected to meet the patients’ needs while responding to the needs of health care
*CONTACT: [email protected]
DOI: http://dx.doi.org/10.28991/esj-2020-01231
© 2020 by the authors. Licensee ESJ, Italy. This is an open access article under theterms and conditions of the Creative Commons Attribution (CC-BY) license (https://creativecommons.org/licenses/by/4.0/).
personnel. These services include preparation and identification of patients, taking samples from patients, transportation and storage of samples, processing of clinical samples, validation of analyses, interpretation, and finally preparation of detailed reports including recommendations.
Medical diagnosis is the process of explaining the symptoms of any disease to start necessary treatment process [5]. A diagnosis has a direct effect over treatment, and lab results often play key role in medical diagnosis. By definition, laboratory tests are used to confirm, reject, classify, monitor, direct and conduct treatment procedure [6]. However, strength and importance of laboratory test results are often underestimated. This is because clinical laboratories tend to report test results as in plain numerical or categorical values, and physicians concentrate mainly on values that fall outside a certain reference range given usually in bold [7]. Nevertheless, a machine can learn and assess test results considering values altogether and separately without focusing on the out of range values only. Verification of test reports is the backbone of the test process. The ability of services that require expert knowledge to respond to difficulties such as reducing the dependence on manpower, improving service quality and simplifying processes are also considered as another quality indicator of the medical laboratory [8]. Suffice it to say, security and compliance with ethical values are among the important issues to be considered during these services, too. Factors such as health reforms all over the world, cost control strategies, laboratory consolidation, and the impact of new technologies on existing medical laboratory processes will be key issues in the near future [9].
This study aims to contribute to the field of medical diagnosis by providing an automated method to predict the lab results accurately based on the previous test results. This method can be applied by the medical laboratories to reduce the number of required tests, the wait time and paperwork; while increasing accuracy in results and patient satisfaction. This study focuses on a specific laboratory test, called creatine kinase; which will be explained later in detail.
1-1- Literature Survey
Major applications of knowledge discovery and data mining in healthcare are studied in four categories: 1- Modern hospitals and clinical centres have become great sources of vast clinical, laboratory, equipment use, and drug data management that can be analysed for diagnosis and decision making; 2- Public health departments focus on early pandemic and epidemic outbreak detection, besides healthcare and syndromic surveillance; 3- Healthcare data analysis including mining medical literature, as well as mining clinical data such as patients’ clinical records; 4- Healthcare insurance companies are working on detecting patients profiles among in terms of a specific chronic illness that has a high-cost diseases such as diabetes [10].
Similarly, this study uses the lab test results with data mining algorithms for knowledge discovery. In the literature, intelligent algorithms are widely used in data-driven methods to analyse and provide individualized medical aid; and an ever-increasing number of health care companies are applying these techniques [11]. Improved intelligent algorithms that are capable of processing huge amounts of data in reasonable time led to new application areas for ML in medicine. For example, the concept of diabetes management has been transformed due to the integration of new technologies such as Continuous Glucose Monitoring (CGM) devices and the development of the Artificial Pancreas (AP), along with the exploitation of data acquired by applying these complex tools. Data mining is attracting increased attention in this field because the amount of data acquired electronically from patients suffering from diabetes has grown exponentially. By means of complex and refined methods, data mining has been shown to provide useful management tools to deal with these incremental repositories of data. Thus, data mining has played a key role in the recognition of these systems as routine therapeutic aids for patients with diabetes [12].
In addition, Kang et al. proposed a symbolic information extraction system to extract laboratory test information from the text corpus created by the U.S. Food and Drug Administration [13]. The study extracted the device and test information from four types of laboratory tests: specimens, analytes, units of measures and detection limits. The performance was compared with three existing supervised machine learning algorithms: Hidden Markov Model, Support Vector Machine and Conditional Random Field. The study proposed a symbolic information extraction system that provides better results with the machine learning methods discussed in the study. Valx is an open source tool developed in Python providing automatic lab test value extraction for clinical researches from eligibility criteria text [14]. It utilizes both domain knowledge obtained from the Internet, Unified Medical Language System (UMLS) Metathesaurus and the n-gram statistics for lab test variable identification. When applied to parse clinical notes, the domain knowledge obtained from clinical trial texts are extended, since the lexicon in clinical notes is more diverse than criteria text sentences. Besides numeric value extraction in clinical and biomedical domain, there are some other studies in unsupervised or semi-supervised extraction methods on product attribute extraction [15, 16]. These studies mainly focus on information extraction of product attributes from product description on electronic commercial websites. The main advantage of unsupervised or semi-supervised methods is that these methods do not require manually labelled data as training data and avoid model overfitting and bias. However, the symbolic based systems are sensitive to the characteristics of the application.
diseases in the field of health for the last few years [17]. These models have some advantages, such as rapid processing and generating results with minimum human intervention. Actually, most modern medical laboratory equipment is based on such machine learning models to effectively capture relevant information [7]. In recent years, scholars and practitioners achieved accurate and concrete examples of applying machine learning for laboratory analyses and test results. For instance, Yuan et al. [7] used linear regression, Bayesian linear regression, random forest regression (RFR) and lasso regression in their study in which they predicted ferritin test results using clinical laboratory data. Nelson et al. applied an ML model called logistic regression and relevance vector machine and found that creatinine level is a clear predictor of traumatic brain injury [18]. Razavian et al. collected administrative requests, pharmacy records, health care, and laboratory test results from 4.1 million individuals between 2005 and 2009 to develop a predictive ML model for type 2 diabetes. The study showed that high ALT concentrations were associated with type 2 diabetes more than any other parameters used. In addition to the ALT level, Glucose Haemoglobin (HbA1c), glucose, high density lipoprotein cholesterol, carbon dioxide and Glomerular Filtration Rate (GFR) were also some of good predictive lab values to diagnose type 2 diabetes [19]. Yuan et al. exploited three classifiers based on supervised ML methods to distinguish between positive and negative urine samples. Based on a classification and regression tree (CART), the model made predictions about the test results with 95.6% overall sensitivity [20]. The results showed that ML is a valuable method for creating classifiers for urine microscopic examination rules. Goldstein et al. created an ML method for predicting cardiovascular risk with data from 1.944 patients diagnosed with primary acute myocardial infarction. The ML model trained on this data set showed a nonlinear relationship between calcium and haemoglobin and post-infarction mortality [21]. Many ML models and algorithms have been used either support a diagnosis or predict another lab test result [22].
1-2- Laboratory Tests
Blood urea nitrogen, which is a common blood test, is an important criterion showing how well the kidneys and liver function. Urea is a chemical waste product in the body. It passes through the liver to the kidneys through blood circulation. The normal values of the test are measured internationally in millimoles (mmol/L) per litre. Approximately 7 to 20 mg/dL (2.5 to 7.1 mmol/L) is considered normal. In infants, lower values are considered normal compared to adults, while normal values increase with age. In general, a high level of blood urea nitrogen is an indication of kidney malfunction. It may also be indicative of urinary tract obstruction, heart failure, digestive system bleeding, and antibiotic-based diseases [23].
ALT stands for alanine transaminase. It is an enzyme found mostly in the liver, and its level is measured for early detection of liver disease. Liver cells release ALT enzyme into the bloodstream, when they are damaged. High levels of ALT in the blood are indicative of a possible liver problem. Normal levels of ALT are between about 7 and 56 units/litre of blood.
AST (Aspartate Aminotransferase) is another enzyme that is found mostly in the liver, but also in muscles as well. When liver is damaged, it releases AST into the bloodstream. Normal levels of AST are between 10-40 units/litres of blood.
Creatine is an amino acid which is naturally produced in the body. The human body uses it for energy and creatinine is left behind as waste. Serum creatinine is one of the most commonly measured products in clinical chemistry laboratories worldwide, because it is not expensive and also important in order to diagnose diseases. Low levels of creatinine are usually indicatives of muscle diseases, liver disorders and excessive water loss.
A High level of lactate in blood is an indication of lack of oxygen. Symptoms like rapid breathing, nausea, and sweating also indicate a lack of oxygen in blood cells. It is used to diagnose diseases like septic shock, heart attack, severe congestive heart failure, and kidney failure [23-25].
AST, ALT, Urea, Creatine and Lactate tests are often ordered by the practitioners for one sample tube of blood.
2- Data Set and Method
2-1- Data Collection
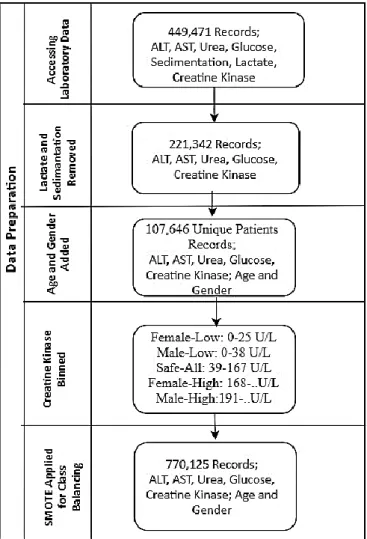
This study uses the results of laboratory tests performed in a private hospital in Istanbul, Turkey throughout 2017, 2018 and 2019. The data set includes the laboratory results of ALT, AST, Urea, Glucose, Lactate, Sedimentation and Creatine Kinase tests. All patient data obtained through 3 years were first anonymized; and a total of 449.471 test findings have been used to build an integrated dataset.
This study aims to predict or estimate the value range of the Creatine Kinase tests, which are evaluated in separate tubes and usually take longer than the other tests do. Thus, creatine kinase test results, which are used for the diagnosis of some diseases for physicians, can be predicted earlier, and treatment of the patient can be started sooner.
2-2- Data Preparation
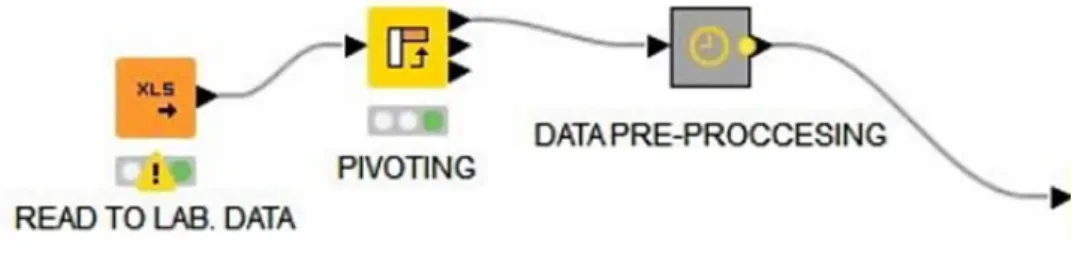
In order to prepare the dataset for the machine learning algorithm, the pivoting operation was applied. That means test names are placed in the columns for each patient carrying the final test result. After the pivoting it was seen that some patients had missing records. However, the number of incomplete patient data was too small to affect the study, so those records were removed from the dataset. In rare cases, where many results were reported for the same test for one patient at the same date and time, values were not used in the analysis, since it was not known which value is the correct one. In many cases above mentioned seven tests were not done for the same sample tube taken from a single patient. Since the dataset should include all tests for each record, incomplete records had to be removed from the dataset. In addition, we had to remove Lactate and Sedimentation from analysis because there were only a few cases including seven laboratory tests. Thus, after cleaning up the dataset, we ended up with 221,342 records out of 449,471. Patients’ age and gender are also added to the dataset and were correlated with the tests and the date/time.
The final dataset included the following variables: - Patient’s Age, - Gender, - ALT, - AST, - Urea, - Creatine Kinase (Class variable); 221,342 records of 107,646 unique patients.
Figure 1. Data Pre-Processing.
56% of patients are male and 44% are female patients. Patients belong to different age groups like infants, children, teenagers, adults and seniors. The age distribution of the patients is shown in Figure 2.
Figure 2. Age range of patients.
Since the aim of the study is to predict Creatine Kinase (CK), a separate and special data transformation was needed for the class variable. Table 1 shows the acceptable ranges for creatine kinase values in males and females [26, 27]. These ranges are commonly used in many hospitals although some health care centres adapt slightly different ranges.
Table 1.Acceptable ranges for creatine kinase values in males and females.
Low End High End
Females 26 167
Males 39 190
Using the ranges given in Table 1, for a better categorization of CK test results, this study analyses the CK data in 5 categories: Female-Low, Male-Low, Safe-All, Female-High, Male-High. The value ranges for these categories are given in Table 2. Values that are lower than 26 and higher than 190 are Unsafe for both genders. Thus, our class variable (CK) is discretized into five as it is shown in Table 2.
Table 2. Categorization of data.
Low End High End
Female-Low 0 25
Male-Low 0 38
Safe-All 39 167
Female-High 168 -
Male-High 191 -
After this conversion, the dataset has become unbalanced in terms of the class variable. It is well-known that having minority classes in classification results overfitting [44]. To go around a possible overfitting due to unbalanced class variable, Synthetic Minority Over-Sampling technique (SMOTE) has been used.
After the SMOTE process the dataset size was extended to 770,125 records, where each class had 154,025 records. Next, stratified random sampling was used to create two subsets from data; 70% for training and 30% for validation of the results. A summary of data preparation is depicted in Figure 3.
3- Comparison of Techniques
This section discusses several techniques that have been used in the data mining and machine learning literature for data classification. Many ideas have emerged over the years on obtaining accurate results from classification methods, and some of them became popular among researchers such as, Native Bayes (NB) and Bayesian Networks, Neural Networks (NN), Decision Trees (DT). This section discusses a comparison of NB, DTs and NNs techniques, as well as some of the related research works in the field.
Methods for analysing and modelling data can be considered into two groups: “supervised learning” and “unsupervised learning.” Supervised learning requires that the input data would contain a class variable. In supervised learning, the process predicts the value of class variable based on the other input variables. Decision trees, regression analysis and neural networks are several examples of supervised learning. On the other hand, unsupervised learning does not need a class variable, but it uses all available variables together instead. In this case, the goal is to look for patterns, clusters or other ways to categorize the data that can help understanding the correlations between variables. Cluster analysis and Principle Components Analysis (PCA) are examples of unsupervised learning.
3-1- Linear Regression
One of the simplest and most popular data modelling methods is linear regression. Linear regression fits a straight line (linear function) to a set of data values. The function fitted by linear regression looks like:
𝑦 = 𝑎0+ 𝑎1∗ 𝑥1+ 𝑎2∗ 𝑥2+ ⋯ (1)
Where a0 and a1 are parameters whose values are determined so the function best fits the data. Linear regression is a
popular modelling technique, and there is many software available to perform linear regression. However, linear regression is appropriate only if the data can be modelled by a straight-line function, which is often not the case. Also, linear regression cannot easily handle complex variables nor is it easy to look for interactions between variables. 3-2- Nonlinear Regression
Nonlinear regression extends linear regression to fit nonlinear functions of the form:
𝑦 = 𝑓(𝑥
1, 𝑥
2… … , 𝑎
1, 𝑎
2… . . )
(2)As with linear regression, nonlinear regression is not well-suited for complex variables or variables with dependencies. The other challenge involved in using nonlinear regression analysis is that the form of the function should be known ahead of time. However, for marketing, behavioural and medical problems, it can be very difficult to make predictions from data.
3-3- Neural Networks
An Artificial Neural Network (ANN) consists of neurons and interconnections among them. Each neuron performs a very simple computation, such as calculating a weighted sum of its input connections and computing an output that is sent to the other neurons. The training phase of an ANN consists of adjusting the weights of the interconnections to produce the desired output [28].
ANN is a technique that is commonly applied to solve data mining applications. The structure of ANN provides an opportunity to the user to implement parallelism at each level. Another significant characteristic of ANN is fault tolerance. ANNs are well suited in situations where information is noisy and uncertain, such as health data. They differ drastically from conventional methodologies in that they employ training by examples to solve problem rather than a fixed algorithm [29].
A key feature of ANNs is an iterative learning process in which cases are presented to the network one at a time, and the weights associated with the input values are adjusted each time [30]. After all cases are presented, the process starts over. During this learning phase, the network learns by adjusting the weights to be able to predict the correct classes of input samples. To start this process the initial weights are chosen randomly and then the training phase begins. Training inputs are applied to the input layer of the network, and anticipated outputs are compared at the output layer. The difference between the output of the final layer and the output is back-propagated to the previous layers, and the weights are adjusted. This process proceeds through the previous layers until the input layer is reached. [31]. ANNs are powerful techniques for representing complex relationships between inputs and outputs. In summary, ANN has the following advantages over other ML techniques:
The use of ANNs can be parallelized for better performance.
There is a high degree of accuracy once the appropriate model is reached.
ANNs are more robust than the similar techniques in noisy environments.
As more medical data are available to the researchers, data mining techniques have been used widely for extracting information to provide better patient care and effective diagnostic competences. For example, ANNs can be used to extract rules from a patient and lab records. ANNs produce very accurate results in practical applications; and they have been successfully used in a variety of real-world classification tasks in industry, business and science [32]. They are used in the analysis of medical images from a variety of imaging procedures. Specifically, ANNs have been used in tumour detection in ultra-sonograms, detection and classification of micro calcifications in mammograms, and tissue and vessel classification in MRIs [33].
3-4- Naïve Bayes
Naïve Bayesian (NB) classifiers assume that there are no dependencies between the attributes. This assumption is called as class-conditional independence. It is made to simplify the computations involved and, hence it is called "naive" [34].
The advantages of NB are:
Unlike ANN, the Bayes classifiers do not have class variables that must be set beforehand.
Bayes classifiers return probabilities, and thus it is simple to apply their results to a wide variety of tasks.
It does not require large amounts of data before training. Therefore, NB classifiers are computationally fast when making decisions.
NB models are popular in machine learning applications, due to their simplicity in allowing each variable to contribute towards the final decision equally and independently from the other attributes. This simplicity results to computational efficiency. When NB is used in appropriate domains, it offers quick training, fast data analysis and decision making, as well as easy interpretation of test results.
Enhancing the standard NB or using it in collaboration with other techniques has been attempted by other researchers; such as coupling a NB classifier with k-means. Some research work has modified their NB classifiers to learn from positive and unlabelled examples. Their assumption is that finding negative examples is very difficult for certain domains, particularly in the medical industry.
3-5- Decision Trees
A decision tree is a decision support tool that denotes attributes in a tree-like structure, where each branch represents an outcome of the test, and leaf nodes represent classes [34]. The popular decision tree algorithms are ID3, C4.5, CART. The ID3 algorithm is a relatively simple algorithm; as it uses information gain as splitting criteria and C4.5 is a derivative of ID3. On the other hand, CART algorithm picks the attributes with smallest Gini coefficients as selection criterion [29]. The advantage of using DTs in classifying the data is that they are simple to understand and interpret results [35]. However, DTs have such disadvantages as:
Most of the algorithms (like ID3 and C4.5) require that the target attribute will have only discrete values.
As decision trees use the “divide and conquer” method, they tend to perform well if a few highly relevant attributes exist, but less so if many complex interactions are present.
Unlike NB classifiers, DT classifiers can cope with combinations of terms and can produce impressive results for some domains. However, training a DT classifier is quite complex with the number of nodes created in some cases. For example, with only six Boolean attributes there would be need for more than 18 x 1018 distinct nodes. Decision trees may be computationally expensive for certain domains; however, they offer simplicity in interpreting models, and help to consider the most important factors in a dataset first by placing them at the top of the tree.
Since, DT classifiers are considered to be weak learners and tend to overfit, boosting and random forest algorithms have been developed in order to overcome those handicaps. Random forest algorithms employ one or more DT classifier on the same dataset by picking different records and removing one or more input variables each time. In this case, a random forest consists of multiple trees which are trained with randomly selected sub-data using, different DT classifiers. A boosting algorithm is similar with Random Forest as it performs raw sampling (row bagging) and attributes sampling (attribute bagging). A boosting algorithm generates ensemble trees using various DT classifiers.
3-6- k-Nearest Neighbour
The K-Nearest Neighbour Algorithm (KNN) is a classification method where an object is assigned to the class most common among its k-nearest neighbours. It is widely disposable in real-life scenarios since it is non-parametric, meaning, it does not make any underlying assumptions about the distribution of data [36].
4- Analysis and Findings
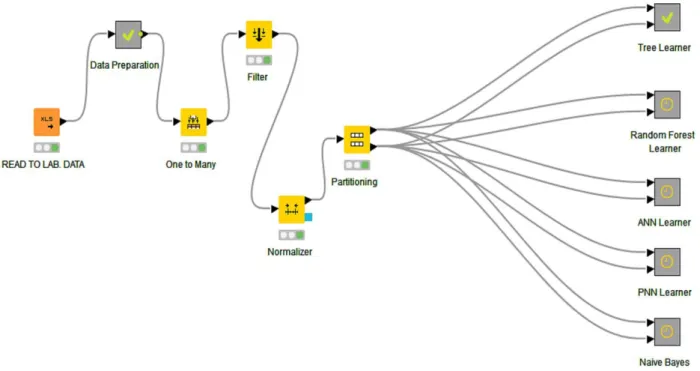
In this study, four popular data mining methods are picked for generating predictions, and their accuracies are analysed. These are: Random Forest, Single Decision Tree, ANN and Naïve Bayes. The data set mentioned in the ‘Data Collection’ section was used with each method to generate predictions and measure accuracies. Figure 4 shows the workflow that was created for that purpose.
Figure 2. Knime workflow for generating predictions and calculate accuracies. Next, data was analysed through the 4 methods that were mentioned earlier in this section. 4-1- Hyper-Parameters Selection
It is known that there is not a well-proved theory that suggests the best tuning parameters for classifications especially with ANN, Random Forest and Naïve Bayes. This is often carried out in a trial and error way. This study also employed the same trial and error method and concluded with the following tuning hyper-parameters for each model.
For ANN, sigmoid activation function is preferred, and z-score normalization has been applied to the dataset. The training has been done best with 4 hidden layers each has got 6 neurons. 70% of the data has been used for training and the remaining 30% for validation.
In the decision tree algorithm, the quality measure has been chosen as Gini index and reduced error pruning has been preferred while selecting the minimum number of records per node as three. In random forest decision tree algorithm, the number of levels is set as 10 and the minimum node size which is minimum number of data points placed in a node before the node is split has been set as nine and minimum number of data points allowed in a leaf node is 3. The static random seed has been applied to come up with 100 models (n-estimator). 5-fold sampling (without replacement) has been done along with stratified sampling. Max number of features is attained as 3.
Synthetic Minority Over-Sampling Technique (SMOTE) algorithm has been used to overcome class imbalance problems and biases towards certain categories with relatively large observations. Data have been oversampled 4 times for Decision Tree, ANN and Random Forest algorithms.
The Random Forest method has provided the most accurate predictions among all methods with 97% accuracy. Table 3 shows the accuracy results for each method.
Table 3. Accuracy results from different methods.
Method Accuracy
Random Forest 96.9%
Decision Tree 96%
ANN 91.8%
Naïve Bayes 60.5%
In addition, each machine learning model’s sensitivity (otherwise known as recall), specificity, and precision values have been calculated. Sensitivity indicates the ability of a model to label positive cases as positive, whereas specificity marks the ability of a model to identify negative cases as negative. High values for these variables indicate that a model predicts well. Precision indicates the likelihood that the model predicts positive cases appropriately.
Using the actual test labels and these binary test predictions, we have calculated the number of true positive, true negative, false positive, and false negative cases for each machine learning algorithm. Error rate and F- values have also been calculated to evaluate results and learning quality. Tables 4-6 show the detailed results from random forest, ANN and naïve Bayes methods.
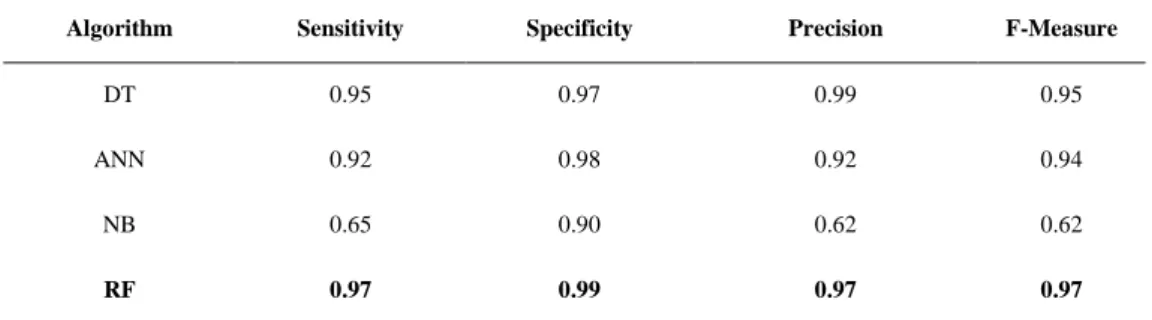
Table 4.Statistics of four ML algorithms.
Algorithm Sensitivity Specificity Precision F-Measure
DT 0.95 0.97 0.99 0.95
ANN 0.92 0.98 0.92 0.94
NB 0.65 0.90 0.62 0.62
RF 0.97 0.99 0.97 0.97
Table 4 shows the statistics of all machine learning algorithms which are used for prediction of creatine kinase. The Random Forest (RF) method has performed significantly better than the other methods have. It can be observed that the RF method ranked at the top for sensitivity and specificity; which makes it the best among other methods to predict both positive and negative cases. The decision tree (DT) method has also performed well, with best precision results. Both methods are based on creating probabilistic rules based on the available attributes. High scores indicate that the creatine kinase test results can be estimated or determined (e.g. deterministic rules can be created) by using the results of other tests.
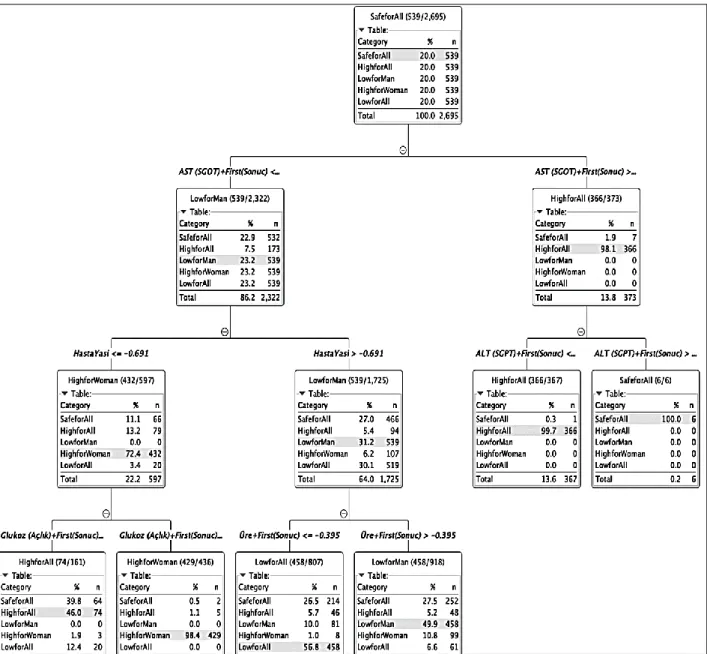
For further analysis of data and its attributes, random forest method has been used in this study. In the 100 runs, the random forest method has highlighted the AST attribute as the most effective on predicting kinase test results. The results show that in 45 of the runs AST have had a direct impact on the final estimation. Figure 5 shows the decision tree that is generated by the method. Please note that KNIME Analytics program displays some portion of the data set for the sake of space complexity although it has used much more data for training.
Figure 3. One of the decision tree generated by the random forest method (displays 2,695 records only). The first rule that is generated by the method is as follows:
If AST value is greater than 65, then the creatine kinase test result will be positive with 97.9% certainty, regardless of gender.
Figure 4.First rule generated by the random tree method.
This rule can help the practitioners and the decision support systems to predict creatine kinase by checking the AST value only, as the prediction is 98% accurate. By the way, the next level in the decision tree improves the accuracy even further by suggesting checking the ALT values as well.
If AST value is greater than 65 AND ALT value is less than 8,64, then the creatine kinase test result will be positive with 99.5% certainty, regardless of gender.
Figure 5. Second rule generated by the random tree method.
The decision tree also provides an even more accurate prediction based on the ALT values as seen in Figure 7. This prediction seems to contradict with the first rule shown in Figure 4. Actually, it is proving the accuracy of the rule: For 2% of the results that don’t agree with the first rule, the chances of a negative test result are 100% (Figure 8).
If AST value is greater than 65 AND ALT value is greater than 8.64, then the creatine kinase test result will be negative with 100% certainty, regardless of gender.
Figure 6. Rule for a negative test result with 100% accuracy.
The rule shown in Figure 8 has significant impact on the creatine kinase test results: It shows that the test results can be predicted solely on AST and ALT tests, without any personal information (e.g. age and gender) about the patient. As majority of the creatine kinase test results are negative, these results will help reduce the unnecessary wait for healthy patients.
An even distribution of test results can be observed on the other side of the tree, where the AST value is less than 65. However, the second level of the tree provides the conclusion shown in Figure 8 below.
If AST value is less than 65 for women younger than 73 years old, the creatine kinase test result will be negative with 74% certainty.
Figure 7. Rule for women younger than 73 years.
In summary, the random forest method has provided 97% accurate results based on the 450K data that have been collected and used for this study. The method showed that AST and ALT are the two most important tests to decide the creatine kinase results. Practitioners can estimate creatine kinase by checking those two tests only with close to 100% accuracy.
5- Discussion
There are few articles in the literature on application of Machine Learning (ML) algorithms to laboratory test parameters [1, 38], although laboratory data supply quantitative, structured and coded data in the field of clinical medicine. Therefore, more studies on machine learning are expected in this field. Application of ML to laboratory medicine should be supported for an extensive process of change and innovation (e.g. [35, 36]). In some studies, it has been stated that ML-based clinical decision support can help reduce unnecessary laboratory tests by estimating associated test results [37] and thus will result in lower healthcare costs. In the literature, studies have been conducted to reduce the number of laboratory tests, to reduce costs [38] or to predict late laboratory tests [1], with machine learning algorithms. In cases where rapid diagnosis is required, late laboratory test results may also slow down the rate of doctors making diagnosis and intervention. Besides, rapid diagnostic methods can control and prevent the spread of pandemic diseases such as coronavirus disease of 2019 (COVID-19), and help doctors better manage patients under high workload conditions [39]. Although laboratory tests are the routine diagnostic tools available, they are time-consuming and costly.
To determine the Creatine Kinase (CK) value discussed in this study, blood is collected from a different tube from the patient, and the result of this tube takes more time than the other tests do. In the present time, the rapid diagnosis is so important, and physicians are expected to diagnose and intervene the patient faster. Researchers working on the estimation of different laboratory tests in this field also benefited from the power of machine learning and artificial intelligence algorithms. For example, in their study (2016), Luo et al. applied various machine learning algorithms to estimate ferritin test results. It was expressed in the study that the results of patient demographics and other laboratory tests can be distinguished from typical, abnormal ferritin results with a high degree of accuracy [40]. In the study by Cismondi et al. (2012), artificial intelligence tool and fuzzy modelling were used to define laboratory tests that did not contribute to knowledge acquisition, data pre-processing, feature selection and classification. The study aimed to reduce unnecessary laboratory tests by predicting when a laboratory test would add to the purchase of knowledge. At the end of the study, an average of 50% reduction in laboratory tests was achieved [38]. It was also stated that an improvement of 37% [41-42] more successful performance was achieved on average in the study than similar studies previously reported. Recent studies conducted in this study determined that many laboratory tests were not associated with better results. In the studies conducted, it has been stated that a significant percentage of the desired criteria are medically unnecessary [43].
Increasing the potential clinical benefits and reducing the costs of laboratory tests are among the most critical issues in the field of health. As it is inferred from the studies in the literature, we strongly believe that it is necessary to employ more artificial intelligence and machine learning algorithms to reduce costs, support clinical decision making and improve the results.
6- Conclusion
Most of the research done in the literature are based on statistical approaches and used for deriving reference limits based on lab results. This approach can produce accurate results when outpatient data is available and prevalence rate is low. While ML methods can be applied to the lab results, this has not been done extensively in the literature. As more data are available to the researchers, ML methods will be more effectively used by the clinicians and practitioners to reduce cost and provide more accurate diagnoses for the patients.
This study compares four popular ML algorithms to generate predictions for the creatine kinase test, using data from 450,000 laboratory test results collected over 3 years. Random Forest Decision tree method provided the most accurate predictions for the creatine kinase test with 97% accuracy rate. The method also created a decision tree that compares the impact of each test attribute on the overall creatine kinase test results. This study reports that AST and ALT values have the highest impact on the CK test results; and the practitioners can accurately predict the test results by using these two values only. This is significant, as the results show that negative creatine kinase results can be predicted with 100% accuracy through other tests; regardless of patients’ age and gender.
The creatine kinase test requires a separate blood sample, which is not possible in some cases such as babies younger than three months or patients with underlying health conditions. This is the first study in the literature that provides a solution to this problem: A very accurate and powerful method for the practitioners to predict the creatine kinase test results based on AST and ALT parameters. If the machine indicates a value which is out of reference range, a new blood sample may be taken from the patient to test creatine kinase. This study is also important from another perspective: Outcomes may be used as an early warning system for practitioners about any abnormal test results.
7- Acknowledgments
This study has been conducted as a part of research and development project which is undertaken and being executed by Pusula Enterprise Business Solutions Research and Development Center.
8- Conflict of Interest
The author declares that there is no conflict of interests regarding the publication of this manuscript. In addition, the ethical issues, including plagiarism, informed consent, misconduct, data fabrication and/or falsification, double publication and/or submission, and redundancies have been completely observed by the authors.
9- References
[1] Cabitza, Federico, and Giuseppe Banfi. “Machine Learning in Laboratory Medicine: Waiting for the Flood?” Clinical Chemistry and Laboratory Medicine (CCLM) 56, no. 4 (March 28, 2018): 516–524. doi:10.1515/cclm-2017-0287.
[2] Jones, Richard G., Owen A. Johnson, and Gifford Batstone. "Informatics and the clinical laboratory." The Clinical Biochemist Reviews 35, no. 3 (2014): 177.
[3] Horowitz, Gary L. “The Power of Asterisks.” Clinical Chemistry 61, no. 8 (August 1, 2015): 1009–1011. doi:10.1373/clinchem.2015.243048.
[4] Connelly, D. P. "Embedding expert systems in laboratory information systems." American journal of clinical pathology 94, no. 4 Suppl 1 (1990): S7-14.
[5] Yamamoto, Yoichiro, Akira Saito, Ayako Tateishi, Hisashi Shimojo, Hiroyuki Kanno, Shinichi Tsuchiya, Ken-ichi Ito, et al. “Quantitative Diagnosis of Breast Tumors by Morphometric Classification of Microenvironmental Myoepithelial Cells Using a Machine Learning Approach.” Scientific Reports 7, no. 1 (April 25, 2017). doi:10.1038/srep46732.
[6] Badrick, Tony. "Evidence-based laboratory medicine." The Clinical Biochemist Reviews 34, no. 2 (2013): 43.
[7] Luo, Yuan, Peter Szolovits, Anand S. Dighe, and Jason M. Baron. “Using Machine Learning to Predict Laboratory Test Results.” American Journal of Clinical Pathology 145, no. 6 (June 2016): 778–788. doi:10.1093/ajcp/aqw064.
[8] Shih, Mu-Chin, Huey-Mei Chang, Ni Tien, Chiung-Tzu Hsiao, and Ching-Tien Peng. “Building and Validating an Autoverification System in the Clinical Chemistry Laboratory.” Laboratory Medicine 42, no. 11 (November 2011): 668–673. doi:10.1309/lm5am4iixc4oietd.
[9] Lippi, Giuseppe, Antonella Bassi, and Chiara Bovo. “The Future of Laboratory Medicine in the Era of Precision Medicine.” Journal of Laboratory and Precision Medicine 1 (2016): 7–7. doi:10.21037/jlpm.2016.12.01.
[10] B. Raheemi, ‘Data Mining and Knowledge Discovery in Healthcare and Medicine’, University of Ottawa, 2014.
[11] Silahtaroğlu, Gökhan, and Nevin Yılmaztürk. “Data Analysis in Health and Big Data: A Machine Learning Medical Diagnosis Model Based on Patients’ Complaints.” Communications in Statistics - Theory and Methods (June 3, 2019): 1–10. doi:10.1080/03610926.2019.1622728.
[12] Contreras, Ivan, and Josep Vehi. “Artificial Intelligence for Diabetes Management and Decision Support: Literature Review.” Journal of Medical Internet Research 20, no. 5 (May 30, 2018): e10775. doi:10.2196/10775.
[13] Kang, YannaShen, and Mehmet Kayaalp. “Extracting Laboratory Test Information from Biomedical Text.” Journal of Pathology Informatics 4, no. 1 (2013): 23. doi:10.4103/2153-3539.117450.
[14] Hao, Tianyong, Hongfang Liu, and Chunhua Weng. “Valx: A System for Extracting and Structuring Numeric Lab Test Comparison Statements from Text.” Methods of Information in Medicine 55, no. 03 (2016): 266–275. doi:10.3414/me15-01-0112.
[15] Bing, Lidong, Tak-Lam Wong, and Wai Lam. “Unsupervised Extraction of Popular Product Attributes from E-Commerce Web Sites by Considering Customer Reviews.” ACM Transactions on Internet Technology 16, no. 2 (April 20, 2016): 1–17. doi:10.1145/2857054.
[16] Shinzato, Keiji, and Satoshi Sekine. "Unsupervised extraction of attributes and their values from product description." In Proceedings of the Sixth International Joint Conference on Natural Language Processing, (2013): 1339-1347.
[17] Silahtaroğlu, Gökhan, and Zehra Nur Canbolat. “An Early Prediction And Diagnosis Of Sepsis in Intensive Care Units: An Unsupervised Machine Learning Model.” Mugla Journal of Science and Technology (June 15, 2020). doi:10.22531/muglajsci.643554.
[18] Nelson, David W., Anders Rudehill, Robert M. MacCallum, Anders Holst, Michael Wanecek, Eddie Weitzberg, and Bo-Michael Bellander. “Multivariate Outcome Prediction in Traumatic Brain Injury with Focus on Laboratory Values.” Journal of Neurotrauma 29, no. 17 (November 20, 2012): 2613–2624. doi:10.1089/neu.2012.2468.
[19] Razavian, Narges, Saul Blecker, Ann Marie Schmidt, Aaron Smith-McLallen, Somesh Nigam, and David Sontag. “Population-Level Prediction of Type 2 Diabetes From Claims Data and Analysis of Risk Factors.” Big Data 3, no. 4 (December 2015): 277–287. doi:10.1089/big.2015.0020.
[20] Yuan, Cao, Cheng Ming, and Hu Chengjin. “UrineCART, a Machine Learning Method for Establishment of Review Rules Based on UF-1000i Flow Cytometry and Dipstick or Reflectance Photometer.” Clinical Chemistry and Laboratory Medicine 50, no. 12 (January 1, 2012). doi:10.1515/cclm-2012-0272.
[21] Goldstein, Benjamin A., Ann Marie Navar, and Rickey E. Carter. “Moving Beyond Regression Techniques in Cardiovascular Risk Prediction: Applying Machine Learning to Address Analytic Challenges.” European Heart Journal (July 19, 2016): ehw302. doi:10.1093/eurheartj/ehw302.
[22] Doguc Özge, Canbolat Z.N. and Yilmazturk N. '"Intelligent Lab Test Approval Support System". In Proceeding of International Aegean Symposiums on Social Sciences & Humanities, Izmir Turkey 2020.
[23] Delanaye, Pierre, Etienne Cavalier, and Hans Pottel. “Serum Creatinine: Not So Simple!” Nephron 136, no. 4 (2017): 302–308. doi:10.1159/000469669.
[24] Bloom, B., J. Pott, Y. Freund, J. Grundlingh, and T. Harris. “The Agreement Between Abnormal Venous Lactate and Arterial Lactate in the ED: a Retrospective Chart Review.” The American Journal of Emergency Medicine 32, no. 6 (June 2014): 596– 600. doi:10.1016/j.ajem.2014.03.007.
[25] Brancaccio, P., N. Maffulli, and F. M. Limongelli. “Creatine Kinase Monitoring in Sport Medicine.” British Medical Bulletin 81–82, no. 1 (February 6, 2007): 209–230. doi:10.1093/bmb/ldm014.
[26]"Creatine Kinase: Reference Range, Interpretation, Collection and Panels". Available online: https://emedicine.medscape.com/article/2074023-overview (accessed on 16 January 2020).
[27] Denis, Francois, Anne Laurent, Rémi Gilleron, and Marc Tommasi. "Text classification and co-training from positive and unlabeled examples." In Proceedings of the ICML 2003 workshop: the continuum from labeled to unlabeled data, pp. 80-87. 2003.
[28] Agatonovic-Kustrin, S, and R Beresford. “Basic Concepts of Artificial Neural Network (ANN) Modeling and Its Application in Pharmaceutical Research.” Journal of Pharmaceutical and Biomedical Analysis 22, no. 5 (June 2000): 717–727. doi:10.1016/s0731-7085(99)00272-1.
[29] Estruch, V., C. Ferri, J. Hernández-Orallo, and M.J. Ramírez-Quintana. “Web Categorisation Using Distance-Based Decision Trees.” Electronic Notes in Theoretical Computer Science 157, no. 2 (May 2006): 35–40. doi:10.1016/j.entcs.2005.12.043. [30] Fletcher, G.P., and C.J. Hinde. “Interpretation of Neural Networks as Boolean Transfer Functions.” Knowledge-Based Systems
7, no. 3 (September 1994): 207–214. doi:10.1016/0950-7051(94)90007-8.
[31] Xhemali, D., J HINDE, C., & G STONE, R. (2009). Naïve bayes vs. decision trees vs. neural networks in the classification of training web pages. D. XHEMALI, CJ HINDE and Roger G. STONE," Naive Bayes vs. Decision Trees vs. Neural Networks in the Classification of Training Web Pages", International Journal of Computer Science Issues, IJCSI, Volume 4, Issue 1, pp16-23, September 2009, 4(1).
[32] Zou, Jinming, Yi Han, and Sung-Sau So. “Overview of Artificial Neural Networks.” Artificial Neural Networks (2008): 14–22. doi:10.1007/978-1-60327-101-1_2.
[33] Chen, Enhong, Zhengya Zhang, Xufa Wang, and Jie Yang. “Index Based Document Classification with CC4 Neural Networks.” Intelligent Agent Technology (September 2001). doi:10.1142/9789812811042_0039.
[34] Fletcher, G.P., and C.J. Hinde. “Using Neural Networks as a Tool for Constructing Rule Based Systems.” Knowledge-Based Systems 8, no. 4 (August 1995): 183–189. doi:10.1016/0950-7051(95)96215-d.
[35] Obermeyer, Ziad, and Ezekiel J. Emanuel. “Predicting the Future — Big Data, Machine Learning, and Clinical Medicine.” New England Journal of Medicine 375, no. 13 (September 29, 2016): 1216–1219. doi:10.1056/nejmp1606181.
[36] Forsting, Michael. “Machine Learning Will Change Medicine.” Journal of Nuclear Medicine 58, no. 3 (February 2, 2017): 357–358. doi:10.2967/jnumed.117.190397.
[37] Lidbury, Brett A., Alice M. Richardson, and Tony Badrick. “Assessment of Machine-Learning Techniques on Large Pathology Data Sets to Address Assay Redundancy in Routine Liver Function Test Profiles.” Diagnosis 2, no. 1 (February 1, 2015): 41– 51. doi:10.1515/dx-2014-0063.
[38] Cismondi, F., L.A. Celi, A.S. Fialho, S.M. Vieira, S.R. Reti, J.M.C. Sousa, and S.N. Finkelstein. “Reducing Unnecessary Lab Testing in the ICU with Artificial Intelligence.” International Journal of Medical Informatics 82, no. 5 (May 2013): 345–358. doi:10.1016/j.ijmedinf.2012.11.017.
[39] Ardakani, Ali Abbasian, Alireza Rajabzadeh Kanafi, U. Rajendra Acharya, Nazanin Khadem, and Afshin Mohammadi. “Application of Deep Learning Technique to Manage COVID-19 in Routine Clinical Practice Using CT Images: Results of 10 Convolutional Neural Networks.” Computers in Biology and Medicine 121 (June 2020): 103795. doi:10.1016/j.compbiomed.2020.103795.
[40] Luo, Yuan, Peter Szolovits, Anand S. Dighe, and Jason M. Baron. “Using Machine Learning to Predict Laboratory Test Results.” American Journal of Clinical Pathology 145, no. 6 (June 2016): 778–788. doi:10.1093/ajcp/aqw064.
[41] Kumwilaisak, Kanya, Alberto Noto, Ulrich H. Schmidt, Clare I. Beck, Claudia Crimi, Kent Lewandrowski, and Luca M. Bigatello. “Effect of Laboratory Testing Guidelines on the Utilization of Tests and Order Entries in a Surgical Intensive Care Unit*.” Critical Care Medicine 36, no. 11 (November 2008): 2993–2999. doi:10.1097/ccm.0b013e31818b3a9d.
[42] Gortmaker, Steven L., Arthur F. Bickford, Herbert O. Mathewson, Karin Dumbaugh, and Peter C. Tirrell. “A Successful Experiment to Reduce Unnecessary Laboratory Use in a Community Hospital.” Medical Care 26, no. 6 (June 1988): 631–642. doi:10.1097/00005650-198806000-00011.
[43] Baigelman, W., S. J. Bellin, L. A. Cupples, D. Dombrowski, and J. Coldiron. “Overutilization of Serum Electrolyte Determinations in Critical Care Units.” Intensive Care Medicine 11, no. 6 (December 1985): 304–308. doi:10.1007/bf00273541.
[44] Van der Aalst, W. M. P., V. Rubin, H. M. W. Verbeek, B. F. van Dongen, E. Kindler, and C. W. Günther. “Process Mining: a Two-Step Approach to Balance between Underfitting and Overfitting.” Software & Systems Modeling 9, no. 1 (November 25, 2008): 87–111. doi:10.1007/s10270-008-0106-z.