Full Terms & Conditions of access and use can be found at
http://www.tandfonline.com/action/journalInformation?journalCode=cjas20
Download by: [Bilkent University] Date: 12 November 2017, At: 23:55
Journal of Applied Statistics
ISSN: 0266-4763 (Print) 1360-0532 (Online) Journal homepage: http://www.tandfonline.com/loi/cjas20
A comparison of artificial neural network and
multinomial logit models in predicting mergers
Nilgun Fescioglu-Unver & Başak Tanyeri
To cite this article: Nilgun Fescioglu-Unver & Başak Tanyeri (2013) A comparison of artificial neural network and multinomial logit models in predicting mergers, Journal of Applied Statistics, 40:4, 712-720, DOI: 10.1080/02664763.2012.750717
To link to this article: http://dx.doi.org/10.1080/02664763.2012.750717
Published online: 10 Dec 2012.
Submit your article to this journal
Article views: 277
View related articles
Vol. 40, No. 4, 712–720, http://dx.doi.org/10.1080/02664763.2012.750717
A comparison of artificial neural network
and multinomial logit models in
predicting mergers
Nilgun Fescioglu-Unver
aand Ba¸sak Tanyeri
b∗aDepartment of Industrial Engineering, TOBB University of Economics and Technology, Ankara, Turkey; bDepartment of Business Administration, Bilkent University, Ankara, Turkey
(Received 1 May 2012; final version received 14 November 2012)
A merger proposal discloses a bidder firm’s desire to purchase the control rights in a target firm. Predicting who will propose (bidder candidacy) and who will receive (target candidacy) merger bids is important to investigate why firms merge and to measure the price impact of mergers. This study investigates the performance of artificial neural networks and multinomial logit models in predicting bidder and target candidacy. We use a comprehensive data set that covers the years 1979–2004 and includes all deals with publicly listed bidders and targets. We find that both models perform similarly while predicting target and non-merger firms. The multinomial logit model performs slightly better in predicting bidder firms.
Keywords: mergers; artificial neural network models; multinomial logistic models
1. Introduction
Merger announcements disclose the intent of bidder firms to purchase control rights in a target firm. Models of target and bidder candidacy are important for three reasons. First, these models allow us to test theories of merger motives. Second, if merger candidacy is predictable, bidder and target shares would reflect the impact of mergers prior to merger announcements. As a result, event study methods that calculate returns around merger announcements may incorrectly measure the price impact of mergers [9,20,45]. Event study methods assume that merger announcements are random and measure price impact of mergers in a tight window of time (usually three days) around the announcement. However, mergers are not random. Managers choose to merge. Hence, modeling target and bidder candidacy are important. Third, hedge funds use investment strategies called ‘merger arbitrage’ that rely on the prediction of bidder and target companies. Merger arbitrageurs realize profits conditional on whether deals are successfully completed [35,36]. To understand the possible impact of merger arbitrage strategies, one needs to model and estimate merger choice
∗Corresponding author. Email: [email protected]
© 2013 Taylor & Francis
Journal of Applied Statistics
713
and deal completion. This study investigates the performance of artificial neural network (ANN) and multinomial logistic models in predicting bidder and target candidacy.
Previous merger studies use two approaches to model bidder candidacy. First approach identifies a single firm characteristic that is used for classification of anticipated and unanticipated bidder firms [5,16,24,32,34,42,44]. Second approach develops predictive models of bidder candidacy that use multiple firm characteristics to classify anticipated versus unanticipated bidders [2,3,9,10,12, 13,39,41]. The contribution of this paper is three-fold. First, this study constructs a comprehensive data set of publicly listed bidders and targets. The sample covers the years from 1979 to 2004 with 5207 bidder observations, 2641 target observations and 308,079 non-merger firm observations. Second, we estimate bidder as well as target candidacy (instead of estimating only bidder or only target candidacy). Third, the paper runs a horse-race between two methods,1namely multinomial
logit and ANN models.
We find that ANN and multinomial logistic models perform similarly while predicting target and non-merger firms. The multinomial logistic model performs better in predicting bidder firms. Multinomial logistic models yield coefficient estimates that have economic meaning. ANN models work as a blackbox and do not automatically reveal coefficient estimates. This is why we con-clude that multinomial logit models outperform ANN models both in predictive and interpretative performance.
This paper is organized as follows: Section 2 describes the proxies for merger motives used to model the merger choice, and introduces the multinomial logistic and ANN models used to estimate merger candidacy. Section 3 compares the results obtained with multinomial logistic and ANN models. Section 4 concludes the paper.
2. Research method
This section develops models to predict the merger choice of firms. At any point of time, managers choose between three alternatives: (i) to propose a bid to attain control rights in another company (bidder firm), (ii) to solicit/receive bids for control rights in their company (target firm) and (iii) to neither propose nor solicit bids (non-merger firm). Finance theory proposes several variables that may predict bidder and target candidacy. Section 2.1 explains these variables and Section 2.2 describes how we estimate bidder and target candidacy using ANN models and multinomial logit models.
2.1 Sampling frame and description of variables
We follow the strategy of Cornett et al. [9] and Tanyeri [45] to construct the sample of merging and non-merging firms and to develop predictors of merger candidacy. The sample of merging firms are from the database of Security Data Company and cover the period from 16 November 1977 to 30 December 2004. We restrict the merging sample to include those deals in which bidders must hold less than 50% of outstanding target shares before the merger announcement and must propose to hold more than 50% of target shares after the merger. Sample firms are non-financial US enterprises due to the differences in regulatory environment and the lack of data availability for foreign and financial firms. We also require sample firms to be public companies.
Identical filters are used to construct the non-merging-firms sample as the filters used in com-piling the sample of merging firms. We compile a sample of US, non-financial firms using the CRSP-COMPUSTAT merged database. The sample includes 110 quarters starting from the third quarter of 1977 and ending in the fourth quarter of 2004. We map the merging sample onto the CRSP-COMPUSTAT data for identification of bidder, target and non-merger firms. A firm-quarter is defined as: a bidder-firm-quarter if the firm makes at least one merger bid in the next firm-quarter, a target-quarter if the firm gets at least one bid in the next quarter and a non-merging firm-quarter
if the firm neither makes nor gets any bids in the next quarter. We also require that the firms have non-missing data for variable construction and drop the variables at the 1st and 99th percentiles to reduce the effect of outliers. These filters produce 2530 firms proposing 5400 bids in 5207 firm quarters, 2352 firms receiving 2706 bids in 2641 firm quarters and 11,010 firms neither proposing nor receiving bids in 308,079 firm quarters.
Table 1 summarizes the sample. First rows list the average book values of assets (in million dollars) of bidder, target and non-merger firms in each year. Second rows list the number of bidder, target and non-merger firms in each year. The second half of the sample (covering the years 1991–2004) is richer than the first half (covering the years 1979–1990) in terms of merging firms. There are, on average, 262 bidders and 125 targets per year in the second half and 128 bidders and 74 targets per year in the first half. Bidders prove largest (on average 3538 million dollars) in terms of book value of assets. Non-merging firms (on average 1421 million dollars) are larger than targets (on average, 962 million dollars). The size distribution indicates that the larger sample firms buy the smaller firms.
We review theories on merger motives to develop predictors for merger candidacy. Managers may engage in mergers to create value for shareholders and/or to protect themselves from losing the non-monetary benefits associated with their managerial positions. Managers may create share-holder value by: (i) increasing efficiency of human and financial capitals; (ii) attaining economies of scale and scope; and (iii) increasing market power [15,17,21,28]. Incentive conflicts between managers and shareholders may also lead to mergers when opportunistic managers focus on generating value for themselves at the expense of shareholders [11,19,25–27,40,43].
Eight variables,2 namely sales shock, square of sales shock, asset size, asset growth, sales
growth, concentration ratio, resource-growth mismatch and return on assets (ROA), represent merger motives to generate shareholder value. Sales shock (the absolute value of the two-year median industry3sales growth rate minus the two-year median sales growth rate for all sample
firms) is a measure of economic disturbances which may motivate mergers [4,17,33]. The square of sales shock allows for nonlinearity in the sales shock variable. The asset size (the log of total assets), asset growth (the two-year growth rate of assets) and sales growth (the two-year growth rate in sales) variables affect the willingness to increase the economies of scale and scope through mergers and, therefore, reduce costs [3,17,37,39]. The concentration ratio variable (cumulates the sales of the largest four firms and divides by total industry sales) measures the ease of entry and exit into the industry [13,17]. The resource-growth mismatch indicator compares the capital resources and growth opportunities of a firm with the industry median (the indicator takes on the value one (zero) if the two-year sales growth is larger (smaller) than the industry median and the ratio of long-term debt to total assets is lower (higher) than the industry median) [3,15,39]. If there is a resource-growth mismatch, the firm may engage in mergers. We use ROA (the book value of net income divided by total assets) variable to measure the match quality between bidders and targets [2,3,29,33,39].
Cash ratio, prior mergers and industry mergers variables measure managerial motives to protect opportunistic benefits through mergers. The cash ratio variable measures the ratio of cash reserves (cash and marketable securities divided by total assets). Large cash reserves enable managers to propose empire-building mergers and desist takeovers. The prior mergers variable (defined as the number of merger bids (received or made) in the prior two years excluding the current bid) also proxies for empire-building motives [5,16,21,24,32,34,42]. The desire to avoid risk by joining the herd may also motivate mergers. The industry mergers variable (the number of industry firms that made or received a bid divided by the total number of industry firms; ratio cumulated for the past two years) measures merger clustering in time and industry. Another approach to measure merger clustering in time would be to keep target, bidder and non-merger ratios separately and perform compositional time series analysis [6], however, industry mergers itself (which is a composition of target and bidder ratios) are not suitable for this type of analysis [14].
Journal of Applied Statistics
715
Table 1. Asset size and distribution of bidders, targets and non-merger firms across years.
Year Bidder Target Non-merger
1979 1992 869 806 5 3 3931 1980 2831 573 870 40 24 7553 1981 1510 396 951 105 53 6880 1982 1205 500 1080 176 41 7010 1983 1136 523 1131 261 55 7791 1984 1527 761 804 264 85 11,034 1985 2150 1025 783 83 101 12,196 1986 2446 380 860 116 124 12,430 1987 4294 639 917 112 114 12,045 1988 5052 1179 1023 109 116 12,186 1989 4064 529 1075 155 102 12,702 1990 3518 2342 1173 114 74 12,644 1991 1981 251 1268 180 61 12,440 1992 3060 609 1313 183 57 12,468 1993 2248 453 1393 187 84 12,699 1994 2411 536 1351 234 98 13,433 1995 2248 581 1347 330 143 14,068 1996 4197 1153 1333 343 139 14,864 1997 3084 874 1455 374 216 15,302 1998 3226 1251 1552 361 228 15,488 1999 5558 1431 1714 355 249 15,034 2000 8553 1406 2029 280 157 13,925 2001 5373 1756 2384 218 106 13,114 2002 7712 1456 2443 184 58 12,751 2003 5619 1480 2693 234 91 12,791 2004 4984 2067 3210 204 62 11,300
Mispricing of shares may affect investment decisions; hence merger decisions [38]. Two alter-native hypotheses exist on whether managers use their private information about mispriced shares to act in shareholder interests or to protect non-monetary benefits. Eckbo et al. [13], Hanson [18] and Rhoades-Kropf and Viswanathan [40] agree that managerial beliefs about stock overvaluation may motivate stock-financed mergers. These mergers motivated by overvaluation aim to create value for pre-merger shareholders in the long run while decreasing value for those shareholders who invest in the company after the merger announcement. Jensen [26] argues that managerial beliefs about stock overvaluation may motivate mergers financed with overvalued equity when managers want to generate and/or protect opportunistic benefits. Three variables, share turnover (defined as the number of traded stock shares divided by the total outstanding shares), price run-up (defined as the two-year change in stock price) and information asymmetry (defined as an indicator that is one if the market-to-book value4is higher than the industry median and the
firm’s share turnover is lower than its industry median), are proxies for managerial motives to take advantage of its information advantage.
2.2 ANN and multinomial logistic models
We use the 10-fold cross-validation method to estimate the performance of ANN and the multi-nomial logit models. We randomly separate the data into 10 subsamples and train the models on 9 subsamples and use the results of the model to estimate bidder and target firms on the 10th subsample. We iterate this procedure for the 10 subsamples. We combine the estimation results from the 10 subsamples and arrive at the full sample results [30].
The sample is imbalanced in the target, bidder and merger classes. The number of non-merger quarters is almost 60 times more than the number of bidder quarters and 117 times more than the target quarters. This kind of imbalance adversely affects the performance of learning algorithms which assume a balanced class distribution [31]. To check whether multinomial logistic models predictive performance also suffers when the data are imbalanced, we ran the multinomial logistic model with no under-sampling. Untabulated results indicate that the model failed to predict bidder and target candidacy (the prediction success for bidders is 0.88% and is 0% for targets). As a result, we use the under-sampling method both in the ANN and multinomial logistic models. In the nine training subsamples, we under-sample the classes with the higher number of elements (non-merging firm and bidder firm quarters) to the size of the minimum class (target firm quarters). In the 10th estimation subsample, we do not undertake any under-sampling as this would interfere in measuring how the models really perform out-of-sample.
ANNs are mathematical modeling tools which perform complex function mappings [22]. ANNs successfully represent complicated and nonlinear relationships between several input and output variables [7]. ANNs simulate the working principles of the human brain. An ANN model is composed of three layers of neurons. First layer is the input layer in which number of neurons are equal to the number of input variables (in our case, 13 neurons corresponding to the input variables defined in Section 2 other than the square of sales shock variable which is dependent on the sales shock variable). The third layer is the output layer which has the neurons that represent the output variables (in our case, three variables, one for target, one for bidder and one for non-merger firms). The second layer resides between these two layers and is called as the hidden layer. The hidden layer can be composed of single or multiple layers. In each layer, there are several neurons. The neurons in the input layer are connected to the hidden layer neurons. A network connects hidden layer neurons to the neurons in the output layer. Each of the links in this network has a weight. Training phase determines the weights of the links, using the training data set. We used MATLAB to implement the ANN model. The network is a feed-forward backpropagation network with tan-sigmoid transfer function for hidden layer and linear transfer function for the output layer. We train the network using the Levenberg–Marquardt
Journal of Applied Statistics
717
backpropagation method. Multinomial logistic models examine the influence of various variables on an unordered multinomial outcome. We used STATA to implement the multinomial logistic model.
3. Results
3.1 ANN model results
The predictive power of theANN model is measured by the extent to which it correctly identifies the merger category of an (firm-quarter level) observation. Correct estimation percentage is calculated as 100∗ NumModelDetectedAsClassi/NumTotalClassi, where NumModelDetectedAsClassi is
the number of cases the model correctly detects in merger class i and NumTotalClassiis the total
number of cases in merger class i. We compute the correct estimation percentages of the ANN model for different number of neurons in the hidden layer. Table 2 presents the average results of the 10-fold cross-validation on the test data set. The first column presents the number of nodes in the hidden layer and the following columns present target, bidder, non-merger and overall correct detection accuracies (in percentages). Target detection accuracy varies between 32.46% and 40.25%, bidder detection accuracy varies between 43.76% and 51.83%, and non-merger firm detection accuracy varies between 49.74% and 53.74%. Table 2 shows that the ANN model with 10 nodes in the hidden layer performs better than the other models in terms of overall correct detection percentage.
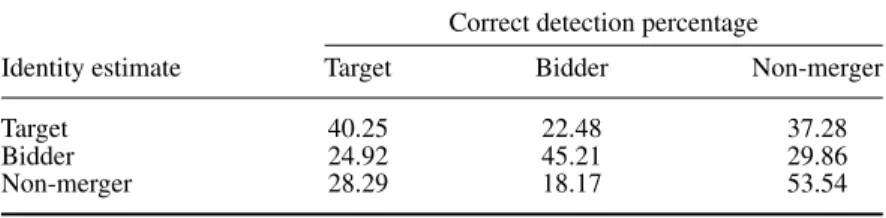
Table 3 shows the classification percentages for the ANN model with 10 nodes in the single hidden layer. The rows of Tables 3 and 4 are the real identities of the observations (bidder, target and non-merger) and the columns are the estimated identities of the observations. The model correctly identifies target, bidder and non-merger firms with 40.25%, 45.21% and 53.24% accuracy, respectively. The highest accuracy is for non-merger firms and the lowest accuracy is for target firms.
Table 2. Classification accuracy for ANN models with different number of nodes in hidden layer.
Correct detection percentage
No. of nodes Target Bidder Non-merger Overall
7 37.78 47.75 52.95 46.16
10 40.25 45.21 53.54 46.33
15 32.46 51.83 53.82 46.03
20 40.17 48.31 49.74 46.07
25 38.61 43.76 53.74 45.37
Table 3. Classification accuracy for ANN model with 10 nodes in hidden layer. Correct detection percentage
Identity estimate Target Bidder Non-merger
Target 40.25 22.48 37.28
Bidder 24.92 45.21 29.86
Non-merger 28.29 18.17 53.54
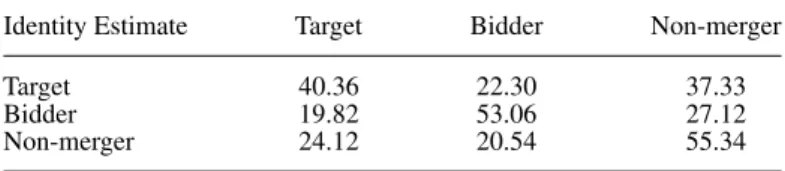
Table 4. Classification accuracy for multinomial logistic regressions. Identity Estimate Target Bidder Non-merger
Target 40.36 22.30 37.33
Bidder 19.82 53.06 27.12
Non-merger 24.12 20.54 55.34
3.2 Multinomial logistic regression results
Table 4 presents the results of multinomial logistic regressions of the 10-fold cross-validation. Multinomial logit regressions estimate the probability of a firm proposing a bid, soliciting a bid and neither proposing nor receiving a bid in the next quarter in the 10% of the data designated as test data in each validation fold. The estimated identity of a firm-quarter is a bidder-quarter if the probability of becoming a bidder firm is larger than the probability of becoming a target firm and non-merger firm. The estimated identity of a firm-quarter is a target-quarter if the probability of becoming a target firm is larger than the probability of becoming a bidder firm and non-merger firm. The model correctly identifies target, bidder and non-merger firms with 40.36%, 53.06% and 55.34% accuracy, respectively. Similar to results of the ANN model, the highest accuracy is for non-merger firms and the lowest accuracy is for target firms.
4. Conclusion
This paper compares the performance of ANN and multinomial logistic models in predicting merger candidacy. Both models perform similarly while predicting target and non-merger firms. The multinomial logit model performs slightly better in predicting bidder firms. Multinomial logit models yield coefficient estimates that have economic meaning. ANN models work as a blackbox and do not automatically reveal coefficient estimates. This is why we conclude that in our sample multinomial logit models outperform ANN models both in predictive and interpretative performance.
Multinomial logit models estimate linear models. ANN model handles nonlinear relationships between the independent and dependent variables. ANN model is also powerful in handling large number of input variables and variables with interactions among each others. This study directly feeds the variables that proxy for merger motives into the multinomial and ANN models. Further research that inputs a wider range of data into the ANN model and allows it to explore linear and nonlinear relationships in the data would prove beneficial.
Acknowledgements
Both authors contributed equally and are listed in alphabetical order. The authors are grateful for feedback provided by participants in EURO 2012 25th European Conference on Operational Research.
Notes
1. Other papers that compare neural network and logistic models include: Adams and Wert [1] who predicts hospital stays, and Cooper [8] who predicts the rescheduling of international debt-service obligations of countries. Hossaina and Nasser [23] compare neural networks and ARMA-GARCH models in forecasting financial returns.
2. Interested readers may refer to [9,45] for the definitions and in-depth discussions about the variables used in this study.
3. Its two-digit SIC code identifies the industry of a firm. The one-digit SIC code is used when less than five firms exist in an industry.
Journal of Applied Statistics
719
4. Market-to-book ratio is the ratio of the closing share price multiplied by the number of outstanding shares to the book value of equity.
References
[1] J.B. Adams and Y. Wert, Logistic and neural network models for predicting a hospital admission, J. Appl. Stat. 32 (2005), pp. 861–869.
[2] A. Akhigbe, J. Madura, and A.M. Whyte, Partial anticipation and gains to bank merger targets, J. Financ. Serv. Res. 25 (2004), pp. 55–71.
[3] B. Ambrose and W. Megginson, The role of asset structure, ownership structure, and takeover defenses in determining
acquisition likelihood, J. Financ. Quant. Anal. 27 (1992), pp. 575–589.
[4] G. Andrade, M. Mitchell, and E. Stafford, New evidence and perspectives on mergers, J. Econ. Perspect. 15 (2001), pp. 103–120.
[5] P. Asquith, R.F. Bruner, and D.V. Mullins, The gains to bidding firms from merger, J. Financ. Econ. 11 (1983), pp. 121–139.
[6] C. Barceló-Vidal, L. Aguilar, and J.A. Martín-Fernández, Compositional VARIMA time series, in Compositional
Data Analysis: Theory and Applications, V. Pawlowsky-Glahn and A. Buccianti, eds., Wiley, New York, 2011, pp.
87–101.
[7] C. Bishop, Neural Networks for Pattern Recognition, Oxford University Press, Oxford, 1996.
[8] J.C. Cooper, Artificial neural networks versus multivariate statistics: An application from economics, J. Appl. Stat. 26 (1999), pp. 909–921.
[9] M.M. Cornett, B. Tanyeri, and H. Tehranian, The effect of merger anticipation on bidder and target firm announcement
period returns, J. Corp. Finance 17(3) (2011), pp. 595–611.
[10] K. Cremers, V. Nair, and K. John, Takeovers and cross-section of returns, Rev. Financ. Stud. 22 (2009), pp. 1409–1445. [11] S. Datta, M. Iskandar-Datta, and K. Raman, Executive compensation and corporate acquisition decisions, J. Finance
56 (2001), pp. 2299–2333.
[12] J. Dietrich and E. Sorenson, An application of logit analysis to prediction of merger targets, J. Bus. Res. 12 (1984), pp. 393–412.
[13] E.B. Eckbo, V. Maksimovic, and J. Williams, Consistent estimation of cross-sectional models in event studies, Rev. Financ. Stud. 3 (1990), pp. 343–365.
[14] J.J. Egozcue and V. Pawlowsky-Glahn, Groups of parts and their balances in compositional data analysis, Math. Geol. 37(7) (2005), pp. 795–828.
[15] Z. Fluck and A. Lynch, Why do firms merge and then divest? A theory of financial synergy, J. Bus. 72 (1999), pp. 319–346.
[16] K. Fuller, J. Netter, and M. Stagemoller, What do returns to acquiring firms tell us? Evidence from firms that make
many acquisitions? J. Finance 57 (2002), pp. 1763–1793.
[17] M. Gort, An economic disturbance theory of mergers, Q. J. Econ. 83 (1969), pp. 624–642.
[18] R. Hansen, A theory for the exchange medium in mergers and acquisitions, J. Bus. 60 (1987), pp. 75–95. [19] J. Hartzell, E. Ofek, and D. Yermack, What’s in it for me? CEOs whose firms are acquired, Rev. Financ. Stud. 17
(2004), pp. 37–61.
[20] M.H. Hekimoglu and B. Tanyeri, Turk sirket birlesmelerinin satin alinan sirketlerin hisse senedi fiyatlari uzerindeki
etkileri, Iktisat, Isletme, ve Finans 26(308) (2011), pp. 53–70.
[21] T. Holmes and J. Schmitz, On the turnover of business firms and business managers, J. Political Econ. 103 (1995), pp. 1005–1038.
[22] K. Hornik, M. Stinchcombe, and H. White, Multilayer feedforward networks are universal approximators, Neural Netw. 2(5) (1989), pp. 359–366.
[23] A. Hossaina and M. Nasser, Comparison of the finite mixture of ARMA-GARCH, back propagation neural networks
and support-vector machines in forecasting financial returns, J. Appl. Stat. 38 (2011), pp. 533–551.
[24] A. Ismail, Which acquirers gain more, single or multiple? Recent evidence from the US market, Global Finance J. 19 (2008), pp. 72–84.
[25] M.C. Jensen, Costs of free cash flow, corporate finance, and takeovers, Am. Econ. Rev. 76 (1986), pp. 323–329. [26] M.C. Jensen, Agency costs of overvalued equity, Financ. Manag. 34 (2005), pp. 5–15.
[27] M. Jensen and W. Meckling, Theory of the firm: Managerial behavior, agency costs, and ownership structure, J. Financ. Econ. 3 (1976), pp. 305–360.
[28] B. Jovanovic and P. Rousseau, The Q-theory of mergers, Am. Econ. Rev. 92 (2002), pp. 198–204.
[29] L. Lang, R. Stulz, and R. Walkling, Managerial performance, Tobin’s q and the gains from successful tender offers, J. Financ. Econ. 24 (1989), pp. 137–154.
[30] Y. Liu, Create Stable Neural Networks by Cross-Validation, International Joint Conference on Neural Networks, IEEE, Vancouver, BC, 2006, pp. 3925–3928.
[31] J. Liu, Q. Hu, and D. Yu, A comparative study on rough set based class imbalance learning, Knowl.-Based Syst. 21 (2008), pp. 753–763.
[32] C. Loderer and K. Martin, Corporate acquisitions by listed firms, Financ. Manag. 19 (1990), pp. 17–33.
[33] V. Maksimovic and G. Phillips, The market for corporate assets: Who engages in mergers and asset sales and are
there efficiency gains? J. Finance 56 (2001), pp. 2019–2065.
[34] P. Malatesta and R.A. Thompson, Partially anticipated events, J. Financ. Econ. 14 (1985), pp. 237–250.
[35] M. Mitchell and T. Pulvino, Characteristics of risk and return in risk arbitrage, J. Finance 56 (2001), pp. 2135–2175. [36] M. Mitchell, L.H. Pedersen, and T. Pulvino, Slow moving capital, Am. Econ. Rev. 97 (2007), pp. 215–220. [37] S. Moeller, F. Schlingenmann, and R. Stulz, Wealth destruction on a massive scale: A study of acquiring-firm returns
in the recent merger wave, J. Finance 60 (2005), pp. 757–782.
[38] S. Myers and N. Majluf, Corporate financing and investment decisions when firms have information that investors
do not have, J. Financ. Econ. (1984), pp. 187–221.
[39] K.G. Palepu, Predicting takeover targets, J. Account. Econ. 8 (1986), pp. 3–35.
[40] M. Rhoades-Kropf and S. Viswanathan, Market valuation and merger waves, J. Finance 59 (2004), pp. 2685–2718. [41] T.K. Sen and A.M. Gibbs, An evaluation of the corporate takeover model using neural networks, Intell. Syst. Account.
Financ. Manage. 3 (1994), pp. 279–292.
[42] K. Shipper and R.A. Thompson, Evidence on the capitalized value of merger activity for acquiring firms, J. Financ. Econ. 11 (1983), pp. 85–119.
[43] A. Shleifer and R.W. Vishny, Stock market driven acquisitions, J. Financ. Econ. 70 (2003), pp. 295–311. [44] M.H. Song and R.A. Walkling, Abnormal returns to rivals of acquisition targets: A test of the ‘acquisition probability
hypothesis’, J. Financ. Econ. 55 (2000), pp. 143–171.
[45] B. Tanyeri, Unpleasant shocks or welcome surprises? What information is conveyed in merger announcements, PhD Thesis, Boston College, 2006.