T.C.
ISTANBUL BILGI UNIVERSITY
Institute of Social Sciences
Msc in Financial Economics
THE EFFECTS of COLLATERAL AMOUNTS on STOCK MARKET
RETURN
Master Thesis
Cansu TAN
Thesis supervisor: Asst. Prof. Dr. Serda Selin Öztürk
THE EFFECTS of COLLATERAL AMOUNTS on STOCK MARKET
RETURN
Rehin Hesapların Hisse Senedi Getirisi Üzerindeki Etkisi/ The Effects
of Collateral Amounts on Stock Market Return
Cansu TAN
114620004
Thesis Supervisor: Asst. Prof. Dr. Serda Selin Öztürk
Jüri Üyesi: Assoc. Prof. Dr. Ender Demir –İstanbul Medeniyet Üniversitesi
Jüri Üyesi: Asst. Prof. Dr. Yelda Yücel
Tezin Onaylandığı Tarih : 20.12.2016
Toplam Sayfa Sayısı: 44
Anahtar Kelimeler (Türkçe) Anahtar Kelimeler (İngilizce)
1) Rehin Miktarı 1) Collateral Amount
2) Hisse Senedi Getirisi 2) Stock Market Return
3) Rehin Etkisi 3) Effect of Collateral
4) Anlamlı/Anlamsız 4) Significant/Insignificant
5) Logaritmik Değişim 5) Logarithmic Change
ii
ABSTRACT
In this thesis, I estimate a comprehensive model for effects of collateral
amounts on stock market return. The data set contains monthly collateral
amounts of firms and their stock market returns from November 2005 until
December 2014. Consistent with my theories the results show that there is an
effect of total collateral amount on stock market return.
iii
ÖZET
Bu tezde 37 firma için rehin miktarlarının hisse senedi getirisine olan etkilerini
içeren kapsamlı bir model tahminliyorum. Kullandığım veri serisi Kasım 2005
yılından Aralık 2014 yılına kadar olan aylık toplam rehin miktarlarını ve hisse
senedi getirilerini içermektedir. Sonuçlarım beklentilerimle tutarlı olarak rehin
miktarlarının hisse senedi getirisi üzerinde etkisi olduğunu göstermektedir.
iv
PREFACE
This thesis has been written to fulfill the graduation requirements of the M.Sc.
program in Financial Economics at the Istanbul Bilgi University.
My original data was obtained with the help of Özgür Uysal and Setenay Batur
from MKK (CSD of Turkey). My research question was formulated together
with my supervisor, Asst. Prof. Dr. Serda Selin Öztürk.
I would like to thank my supervisor Asst. Prof. Dr. Serda Selin Öztürk for her
excellent guidance and support during this process. I would not have been able
to conduct this analysis without her cooperation.
Also, I would like to thank to my loving family who encouraged me to
finish my work, always offering support.
My friends deserve a particular note of thanks: your kind words have, as
always, served me well and kept me motivated.
v
TABLE OF CONTENTS
1. INTRODUCTION ... 1
1.1
W
HAT IS COLLATERAL? ... 2
2. LITERATURE REVIEW ... 4
3. DATA AND METHODOLOGY ... 9
3.1
D
ATA... 9
3.2
M
ETHODOLOGY... 12
4. RESULTS ... 14
4.1
T-
TESTR
ESULTS... 15
4.2
F-
TESTR
ESULTS... 18
4.3
I
NSIGNIFICANT FIRMS... 20
5. CONCLUSION ... 21
6. REFERENCES ... 24
7. APPENDIX ... 26
1
1. INTRODUCTION
This study aims to emphasize the importance of collateral amounts on firms,
how collateral amounts influences on stock market returns.There are not many
studies on the effects of collateral on stock market return in the literature. The
data set I use in this thesis is a private data set which can be gathered together
upon special request. Therefore the effects of collateral amounts on stock
market return is not yet explored for Turkey. Increasing number of studies
which show the importance of collateral amounts and insufficient number of
studies on the effect of collateral amounts on stock market are the main
motivations for this paper.
In the first part, I will review the main theoretical approaches regarding the
collateral amounts and its importance for stock market returns.
In the second part, I will emphasize the importance of collateral giving to the
relationship with theoretical methods. I will detail the results ten-year-period
starting from November 2005 until December 2014 and show that there is an
effect of collateral amounts on stock market returns and it is related with the
quantity of collateral amount.
Finally, I summarize the results of the tests I used and the consequences of
collateral amounts.
2
1.1 What is collateral?
A collateral value is the estimated fair market value of an asset that is being
used as loan collateral. If we are talking about publicly traded securities, then
the current price of the securities would be the collateral value. Collateral as a
term is extensively used in credit contracts because there is a reality that the
asymmetric information, adverse selection and moral hazard have existed
between lenders and borrowers.
[1]Collateral is therefore an important
contractual device that affects the behavior of borrowers and lenders and also
the design of debt contracts.
[2]Most of researches show us the collateral plays an important role in the
financial markets. The economic functions of collateral are well understood in
theory but it is really hard to show its direct effect clearly. Because collateral
effects are not the only one used in a financial transaction. There are also other
determinants such as buyer, seller, assets and payment models. On the other
hand collecting correct data to survey its effect is not possible most of times.
3
Global financial crisis have forced authorities to make modification for
regulations especially in banking and financial industries and it has been an
obligatory change for all these institutes. One of the key areas impacted by this
change is the collateral management function. It becomes an important factor
within a financial transaction to make sure that resources are well priced and
used as efficiently as possible.
Market behavior in assessing creditworthiness and pricing, and monitoring risk
has changed significantly, leading to an increase of risk parameters. As a result
of this action financial institutes have to monitor and price overtime,
introducing more complexity to managing available resources. So they require a
new type of capability and framework to assess, quantify, control and optimize
scarce resources.
[3]In brief, it is really important to see how collateral role affects a financial
transaction, not only because of its widespread use in finance world, but also
because of its implications for monetary policy. As an example, under the
financial accelerator view of monetary policy transmission, a tightening of
monetary policy and the associated increase in interest rates impairs collateral
values, making it more difficult for borrowers to obtain funds, which reduces
investment and economic growth.
[4]As you see its effects is big enough to
discuss.
4
2. LITERATURE REVIEW
Although the literature on the effects of collateral amounts on stock market
return is not having a satisfactory survey, I tried to gather some information
what is done generally for the collateral on monetary policy.
According to credit market researches adverse selection causes the use of
collateral (Bester 1985, Chan and Kanatas 1985; Besanko and Thakor 1987)
and moral hazard (Boot, Thakor and Udell 1991), which problems arise in
transactions between borrowers and lenders. Berger and Udell (1990) said that
“most commercial loans are made on a secured basis, yet little is known about
the relationship between collateral and credit risk until 90s.” They presented
that “empirical evidence strongly suggests that collateral is most often
associated with riskier borrowers, riskier loans and riskier banks.”
Several studies have examined the influence of the strength of the borrower–
lender relationship on the use of collateral. An article was published for Global
Capital (2015) predicts that collateral will, in a sense, be the markets' new
currency. It highlighted “both sell-side and buy-side firms will need to make
sure they can mobilize collateral efficiently, while infrastructure providers must
be the conduits of collateral.”
On the other hand unpredictable macroeconomic events in Europe such as the
exit of a country from the Eurozone, has led sell-side firms to increase their on
collateral inventory.
5
The International Securities Derivatives Association (ISDA) calculates that,
“since 2012, the deficit of high quality collateral has risen to US$10trn
(Depending on whether internal models or standardized schedules are used.
See: ISDA „Initial Margin of up to $10.2 Trillion Required for OTC
Derivatives‟).”
According to changing regulations in global finance world, almost every firms
or institutions started to take steps to be up-to-date. There are some firms which
have already founded departments of collateral management. Because they
aware of reviewing process to be sure that it can be handled with unexpected
situations. It is getting more important every year.
Anlin Chen and Lanfeng Kaobshows (2011) claimed that “the risk (value)
attributes of collateralized stocks increase (reduce) bank efficiency yet reduces
(increase) bank profits.” Ted Leveroni (2014) highlighted the importance of
requiring additional collateral to increase margin calls. In recent years some
analyses have been made to point out the effects of collateral for margin calls
but it is not possible to know what the final collateral requirement will be as
estimates are based on existing volumes.
6
Fabrizio Lillo and Davide Pirino (2015) analyzed the impact of systemic,
illiquidity and volatility risk on the margin requirements for risky collateral. In
their study “suggesting the repo volumes agreed by the European Central Bank
reduced accordingly, focusing on to take the point of view of a financier (buyer
of a repo contract) and tried several models with simple assumptions.” As a
consequence they said that “assets that are characterized by a low level of
volatility but are shared among portfolios of highly levered institutions can be
dangerously evaluated as good collaterals and, hence, improperly adopted to
raise capital.”
7
In other respects, since the collateral is important its damages also important
and causes several effects. Bradford Cornell and James C. Rutten (2009)
conclude that “while collateral damage can have a material impact on securities
prices, declines associated with collateral damage are not, and should not be.”
Causation focuses on the stock price decline; damages focus on inflation before
the decline. Once causation is established, the parties and their experts must set
about estimating the amount of the inflation so as to avoid permitting recovery
for collateral damage. Julio Garin (2015) showed the consequences of the
fluctuations in collateral requirements in labor market variables and said that it
generated significant movements. While productivity shocks are important for
generating fluctuations in aggregates such as output and investment, credit
shocks have significant effects on variables such as unemployment, labor
market tightness. Because changes in collateral requirements do not entirely
translate into changes in wages, these disturbances have a large impact on the
ability of firms to create jobs. Contrary to the effects of productivity shocks, the
adjustment that follows from changes in credit conditions is mainly through
quantities and not prices. Fluctuations in collateral requirements are, hence,
promising in explaining business cycle movements in labor market variables.
In sense of the amount of collateral there are not so much satisfied studies.
Rajan and Winton (1995) predict that “the amount of collateral pledged is
directly proportional to the borrower's difficulties with repayment.
8
The collateral as a variable that proxies the risk profile of the borrower as it is
estimated by the lender. “Gabriel Jimenez, Vicente Salas and Jesus Saurina
(2006) searched the determinants of collateral in loans extended to business
firms. They studied the amount of collateral required in loans and their
hypothesis showed that “the amount of collateral pledged in a particular loan
will increase if the loan is granted in a period of higher real interest rates, and
will decrease with the size of the loan.” This finding is consistent with the
theory that I mentioned above which is collateral as a solution to problems of
moral hazard (Boot, Thakor and Udell 1991). According to their theory in
situations in which the risk-free interest rate is high, the additional risk
premium in the interest rate of the loan will aggravate the moral hazard problem
and using collateral instead of charging higher interest rates reduces the moral
hazard problem and thereby increases efficiency.
9
3. DATA and METHODOLOGY
3.1 Data
This study was conducted in order to analyze the effects of collateral amounts
on stock market return. Herein, my original data was collected from MKK
(CSD of Turkey) and used a unique data set containing timely assessments of
collateral values. We try to find whether there is an effect of total collateral
amount of firms on the stock market returns.
The database contains 180 firms which have collateral accounts at a monthly
frequency between 2005:11 and 2014:12. These data are classified into several
broadly defined types of information. It contains for each firm‟s (in a total of
180 firms) ISIN code (it is unique and necessary to trade in the stock
exchange), total nominal amount of the shares are traded in the stock exchange
(public shares), number of investors holding firm's stock market traded shares
(public shares), total collateral amount, number of investors holding firm's
collateral stock market traded shares (public shares), second session closing
price of every month‟s last day for each year (ten year period starting from
November 2005 until December 2014), total nominal amount of both public
and private shares and main industry information. Our analysis focuses on a
particular type of information: logarithmic change.
10
All firms from various sectors which are food and agriculture, stone quarry,
publishing, broadcasting, appliances,manifacture of transport equipment,
retail,packaging and paper, auto and track parts, hospitality, hotels,
transportation, insurance, financial services, tourism, steel manufacturing,
consumer electronics, beverage, oil&gas, pharmaceutical, matal mining,
defence, software electronics, polyester, steel, energy, construction,banking,
conglomerate, investment banking and media.
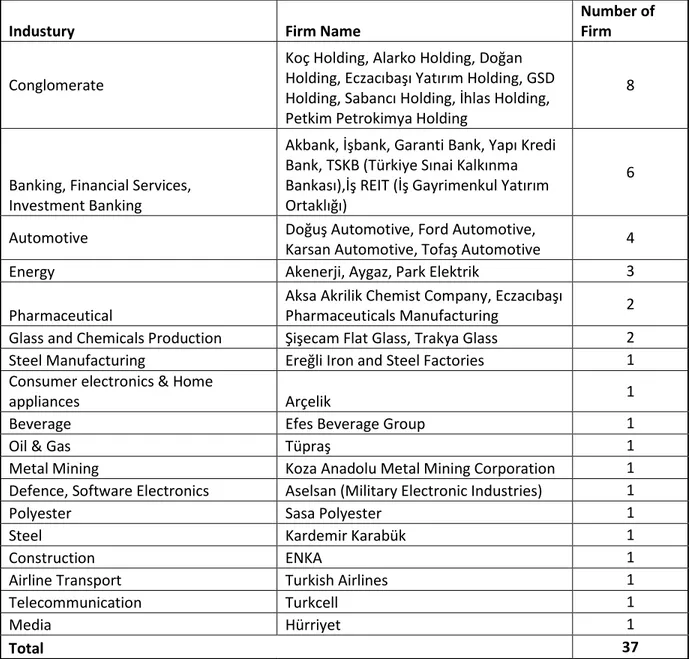
On the other hand as we have main industry information for each firm we can
summarize firms used in this work, here below the table sector based.
11
Table 1: Results from the original data MKK (CSD of Turkey)
Industury
Firm Name
Number of
Firm
Conglomerate
Koç Holding, Alarko Holding, Doğan
Holding, Eczacıbaşı Yatırım Holding, GSD
Holding, Sabancı Holding, İhlas Holding,
Petkim Petrokimya Holding
8
Banking, Financial Services,
Investment Banking
Akbank, İşbank, Garanti Bank, Yapı Kredi
Bank, TSKB (Türkiye Sınai Kalkınma
Bankası),İş REIT (İş Gayrimenkul Yatırım
Ortaklığı)
6
Automotive
Doğuş Automotive, Ford Automotive,
Karsan Automotive, Tofaş Automotive
4
Energy
Akenerji, Aygaz, Park Elektrik
3
Pharmaceutical
Aksa Akrilik Chemist Company, Eczacıbaşı
Pharmaceuticals Manufacturing
2
Glass and Chemicals Production
Şişecam Flat Glass, Trakya Glass
2
Steel Manufacturing
Ereğli Iron and Steel Factories
1
Consumer electronics & Home
appliances
Arçelik
1
Beverage
Efes Beverage Group
1
Oil & Gas
Tüpraş
1
Metal Mining
Koza Anadolu Metal Mining Corporation
1
Defence, Software Electronics
Aselsan (Military Electronic Industries)
1
Polyester
Sasa Polyester
1
Steel
Kardemir Karabük
1
Construction
ENKA
1
Airline Transport
Turkish Airlines
1
Telecommunication
Turkcell
1
Media
Hürriyet
1
Total
37
This table may provide us to say that firms with the most collateral accounts are in
conglomerate, banking and financial services, automotive and energy industry.
12
3.2 Methodology
To be able to gather the necessary data, i utilized different kind of methods
using both qualitative and quantitative approaches. I started my analysis by
selecting the firms having with most data which means having the closing price
for each month‟s last day overall. This process resulted in a total of 56 firms at
first. The last step was to choose the firms having with data for each month‟s
last day of every year starting from November 2005 until December 2014. This
means that I have to work total 110 data for each firm. I calculated monthly
returns by using second session closing price for the last day of each month.
Finally 37 of them were suitable for starting to make analysis. It gives us a rate
of 20.56% and this rate can say us some results to determine of collateral
accounts.
After lowering to 37 the number of firms having collateral accounts, I started to
construct formulas to gather meaningful results. As the data includes total
collateral amount I used them to see the effects on the stock market return.
Under various assumptions, the model had to be fit with the goodness of
fit model
.
The main method of the work was the least-squares estimation. I
worked both
t
1
and
t
2
lag numbers but the results were not significant at
lag
t
2
so I continued with lag
t
1
. I also tried to add exchange rates and
industrial production rates for consumer nondurables for each month‟s last day
of the same ten-year-period as control variables to the model.
13
Unit root test results showed that industrial production is nonstationary
therefore I used logarithmic return of the industrial production as an
explanatory variable. Individual estimation results showed that these variables
are insignificant therefore I excluded them from the final estimation. This result
is consistent with the literature since studies in the literature show that stock
market returns are mostly driven by the volatility. This work uses t-test to see
whether if there is sign effect at logarithmic change of total collateral amount
on stock market return of our firms. I have both at time t at time t-1, we test two
different hypothesis related to significance of these variables.
I briefly named the main formula as below;
t t t t
x
x
u
r
1
2
3 1
Where
tr
Logarithmic return of stock market return (by using closing price for each
month‟s last day)
tx
Logarithmic change of total collateral amount
2
= Coefficient of logarithmic change of total collateral amount at time t
3
14
Since we are interested in testing whether if collateral amount has any effects
on stock return, the hypotheses that we are testing:
1) T-test hypothesis:
0
:
0
:
2 1 2 0
H
H
:
0
0
:
3 1 3 0
H
H
2) F-test hypothesis:
0
:
2 3 0
H
:
1H
At least one of them is not equal to zero
4. RESULTS
I will summarize the results in three sections based on the test statistics I used. I
will show the t-test and F-test results and say that amount of collateral have
effects on the stock market returns by explaining significant levels.
Finally I try to make common explanation for the insignificance firms and I will
show where the tests failed for insignificant firms.
15
4.1 T-test Results
The t-test results which can be found in the table 2 can be summarized as
follows;
28 of them for
2we reject the null hypothesis for at least one of the
significance levels. Therefore it is significant. If I examine the results sectorel
based; 6 of them are in Banking and Financial Services, 5 of them are in
Conglomerate, 4 of them are in Automovie industry and the rest of them are in
others. 23 of them for
2we reject the null hypothesis for 1%. So it is
significant 62.16% (23 out of 37). If we say that it is significant at 1% , we can
easily say that it is significant for each levels that we tested for 1% , 5% and
10%. 2 of them for
2we reject the null hypothesis for 5% and 3 of them for
2we reject the null hypothesis for 10%. Our test results
2is consistent with our
theory.
29 of them for
3we reject the null hypothesis for at least one of the
significance levels. Therefore it is significant. If I examine the results sectorel
based; 6 of them are in Banking and Financial Services, 5 of them are in
Conglomerate, 3 of them are in Automovie industry and the others. 23 of them
for
3we reject the null hypothesis for %1. So it is significant 62.16% (23 out
16
If we say that it is significant at 1%, we can easily say that it is significant for
each levels that we tested 1%, 5% and 10%. 4 of them for
3we reject the null
hypothesis for 5% and 2 of them for
3we reject the null hypothesis for 10%.
Our test results
3is consistent with our theory.
For 30 put of 37 we reject both hypothesis at least for one of the significance
levels. Even if
2is not significance for at least one of the significance levels
3is significante or contrary. This give us highly significancy percentage 81.08%.
Their sectorel based results as follows; 5 of them are in Banking and Financial
Services, 5 of them are in Conglomerate, 4 of them are in Automovie industry
and rest of them are in others. These results show us there is highly correlation
between total collateral amounts and stock market returns. This correlation is
especially in conglomerate and banking & financial services.
17
Table 2: T-test results
Firm Name
2
3Efes Beverage Group
-4.074***
4.051***
Akbank
-4.258***
4.363***
Akenerji
-1.814*
1.668*
Aksa Akrilik Chemist Company
-3.853***
4.617***
Alarko Holding
-9.521***
10.101***
Arçelik
-3.318***
3.935***
Aselsan (Military Electronic Industries)
-6.210***
6.350***
Aygaz
-2.586**
2.633***
Doğuş Automotive
-3.822***
4.135***
Doğan Holding
-5.045***
5.172***
Eczacıbaşı Pharmaceuticals Manufacturing
-1.509
1.922*
Eczacıbaşı Yatırım Holding
0.084
-0.334
ENKA
-5.756***
5.772***
Ereğli Iron and Steel Factories
0.198
-0.178
Ford Automotive
-3.159***
3.640***
Garanti Bank
-3.029***
2.406**
GSD Holding
-0.936
0.318
Hürriyet
-3.358***
3.585***
İhlas Holding
-0.101
-0.180
İşbank
-6.491***
6689***
İş REIT (İş Gayrimenkul Yatırım Ortaklığı)
-2.494**
2.335**
Karsan Automotive
1.810*
-1.120
Koç Holding
-4.663***
4.108***
Koza Anadolu Metal Mining Corporation
-3.457***
3.604***
Kardemir Karabük
-1.447
1.530
Petkim Petrokimya Holding
-8.327***
8.289***
Park Elektrik
-0.432
0.636
Sabancı Holding
-5.322***
5.353***
Sasa Polyester
-0.337
0.663
Şişecam Flat Glass
-2.910***
2.616***
Turkcell
-1.940*
2.083**
Turkish Airlines
-5.982***
6.311***
Tofaş Automotive
-4.748***
4.929***
Trakya Glass
-2.022**
3.308***
TSKB (Türkiye Sınai Kalkınma Bankası)
-4.421***
4.195***
Tüpraş
-2.962***
2.492**
Yapı Kredi Bank
-3.977***
3.605***
Note: t-test results for parametrics “***” ,”**” , “*” indicate significance at
1%, 5% and 10%.
18
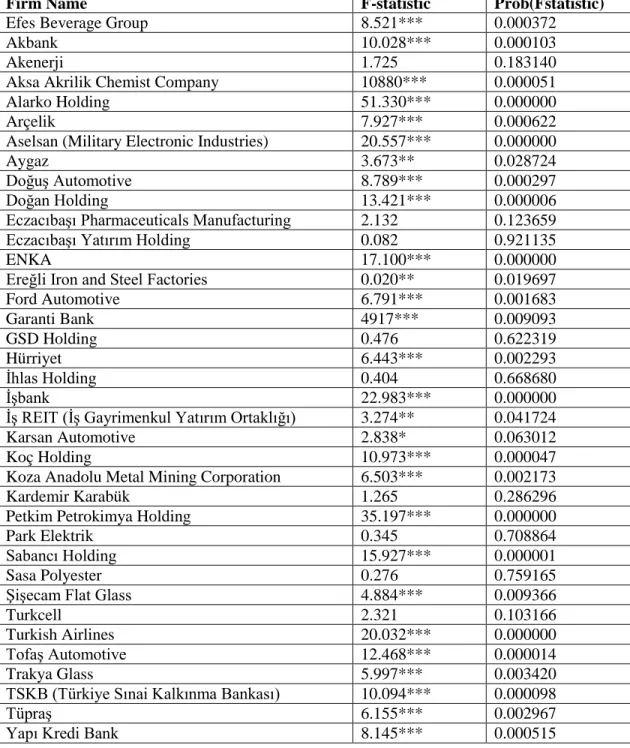
4.2 F-test Results
This work uses also F-test to support the results based on t-test hypothesis for
F-test are given below. I expect accordance with the results of t-tests. If there is
a logical correlation between the F-test and t-test it will be a verification for our
theory.
The hypothesis that we are testing;
0
:
2 3 0
H
:
1H
At least one of them is not equal to zero
For 28 out of 37 we reject the null hypothesis at one of the significance levels.
24 of them we reject the null hypothesis for 1%. So it is significant 64.86% (24
out of 37) If we say that it is significant at %1 we can easily say that it is
significant for each levels we tested 1%, 5% and 10%. 3 of them we reject the
null hypothesis for 5% and 1 of them
we reject the null hypothesis for 10%.
19
Table 3: F-test results
Firm Name
F-statistic
Prob(Fstatistic)
Efes Beverage Group
8.521***
0.000372
Akbank
10.028***
0.000103
Akenerji
1.725
0.183140
Aksa Akrilik Chemist Company
10880***
0.000051
Alarko Holding
51.330***
0.000000
Arçelik
7.927***
0.000622
Aselsan (Military Electronic Industries)
20.557***
0.000000
Aygaz
3.673**
0.028724
Doğuş Automotive
8.789***
0.000297
Doğan Holding
13.421***
0.000006
Eczacıbaşı Pharmaceuticals Manufacturing
2.132
0.123659
Eczacıbaşı Yatırım Holding
0.082
0.921135
ENKA
17.100***
0.000000
Ereğli Iron and Steel Factories
0.020**
0.019697
Ford Automotive
6.791***
0.001683
Garanti Bank
4917***
0.009093
GSD Holding
0.476
0.622319
Hürriyet
6.443***
0.002293
İhlas Holding
0.404
0.668680
İşbank
22.983***
0.000000
İş REIT (İş Gayrimenkul Yatırım Ortaklığı)
3.274**
0.041724
Karsan Automotive
2.838*
0.063012
Koç Holding
10.973***
0.000047
Koza Anadolu Metal Mining Corporation
6.503***
0.002173
Kardemir Karabük
1.265
0.286296
Petkim Petrokimya Holding
35.197***
0.000000
Park Elektrik
0.345
0.708864
Sabancı Holding
15.927***
0.000001
Sasa Polyester
0.276
0.759165
Şişecam Flat Glass
4.884***
0.009366
Turkcell
2.321
0.103166
Turkish Airlines
20.032***
0.000000
Tofaş Automotive
12.468***
0.000014
Trakya Glass
5.997***
0.003420
TSKB (Türkiye Sınai Kalkınma Bankası)
10.094***
0.000098
Tüpraş
6.155***
0.002967
Yapı Kredi Bank
8.145***
0.000515
Note: F-test results for parametrics “***” ,”**” , “*” indicate significance at
1%, 5% and 10%.
20
4.3 Insignificant firms
T-test and F-test results show us there is an effect of total collateral amount on
stock market returns of our firms. But among these 37 firms some of them are
not consistent with our theory.
If we take a look what is common between these 9 insignificant firms, we can
start by sector based analysis. 3 of them are in conglomerate, 2 of them are in
energy, 1 is in pharmaceutical, 1 is in steel, 1 is in polyester and 1 is in
telecommunication. As we see that they are mostly common in conglomerate
and energy.
Total collateral value percentage among these 37 firms is 2.70% in average
(maximum 19.56% and minimum 0.05%) . 6 out of 9 firms below average
(maximum 1.59% minimum 0.31%) and 3 out of 9 firms are above average. If
we numerate total collateral value percentages starting from 1 to 37 and say that
1 symbolize the highest level, 37 is the lowest level ; below average 6 firms
have numbers: 11, 18 ,19, 20, 23, 27 and above average firms have numbers:
2,5,7. Therefore the less collateral value means less effect on the stock return.
This supports our theory.
21
If we construct a ratio which is total collateral amount / total nominal amount of
the shares are traded in the stock exchange (public shares) ,it gives us 0.13% in
avarege. According to this ratio 6 out of 9 insignificant firms are below
average. If the ratio is low this means collateral is low relative to the traded
shares therefore does not affect stock returns significantly. This supports our
theory not only the collateral amount but its ratio to total nominal amount of the
shares traded in the stock exchange matter.
5. CONCLUSION
In this work I present a comprehensive empirical analysis of the effect of
collateral amount on stock market returns to 37 firms traded in the stock
market. I conduct my analysis under two main hypothesis: t-test and F-test. To
perform my analyses I use a unique database run by MKK (CSD of Turkey)
which contains for every month of each year between 2005 and 2014 for total
collateral amounts.
By using the selected sample, I was able to test theories that explain the amount
of collateral. I control both t-1 lag and t-2 lag numbers to test hypothesis which
will be answer for the significancy. Since t-2 wasn‟t give me significant results
I continued with t-1 lag numbers.
22
I started to conduct my analyses firstly using t-test and then continued with
F-test to support my results. T-F-test results showed that for the coefficient of
logarithmic change of total collateral amount at time t among 37 firms, 23 of
them are significant at 1%, 2 of them are significant at 5%, 3 of them are
significant at10%. If we take a general look these statistic results, we can say
that 62.16% are significant since it is significant at 1% it is also significant 5%
and 10%. In total 28 out of 37 firms are significant so this gives us highly
correlated percentage (75.67%) with our theory.
T-test results showed that for the coefficient of logarithmic change of total
collateral amount at time t-1 among 37 firms, 23 of them are significant at 1%,
4 of them are significant at 5%, 2 of them are significant at10%. If we take a
general look these statistic results, we can say that 62.16% are significant since
it is significant at 1% it is also significant 5% and 10%. In total 29 out of 37
firms are significant so this gives us highly correlated percentage (78.37%) with
our theory.
T-test results showed that for both the coefficient of logarithmic change of total
collateral amount at time t and t-1 among 37 firms, 30 of them are significant at
least for one of the significance levels. This gives us highly correlated
percentage (81.08%) with our theory.
23
As a verification the test results, our f-test results showed that among 37 firms,
24 of them are significant at 1%, 3 of them are significant at 5%, 1 of them are
significant at10%. If we take a general look these statistic results, we can say
that 64.86% are significant since it is significant at 1% it is also significant 5%
and 10%. In total 28 out of 37 firms are significant so this gives us highly
correlated percentage (75.67%) with our theory.
As a consequence I showed that the effect of total collateral amount on stock
market return is clear and highly efficient according to statistics results.
Nevertheless, the database has some inconsistent firms with my theory.
However I believe that it does not effect the results since percentage of
insignificant firms is not high. ( 24.32%) and this ratio is equal to 9 out of 37
firms.
The results in my work confirms that the amount of total collateral value effects
the stock market return. I reach this conclusion by analyzing the results of
hypothesis tests.
Since the use of collateral is important in financial transactions, my conclusions
also support the amount of collateral is important as well as the use of
collateral.
24
6. REFERENCES
[2]
Asset market fluctuations, particularly real estate prices, influence the debt
capacities, and investments of firms through the so-called collateral channel
(Gan (2007), Chaney, Sraer, and Thesmar (2012)). Collateral can also generate
business cycles (Bernanke and Gertler (1989)), and can become critical during a
crisis. “Collateral is the grease that oils the lending system. *…+ If the grease
starts to freeze or run out, the loan cogs won't run as well” (Financial Times,
November 28, 2011, “Financial System Creaks as Loan Lubricant Dries Up”)
[3]
Aydin, B. (2016). Evolution of collateral ‘management’into collateral
‘optimisation’. Journal of Securities Operations & Custody, 8(3), 259-271.
Berger, A. N., & Udell, G. F. (1990). Collateral, loan quality and bank risk. Journal of
Monetary Economics, 25(1), 21-42.
Besanko, D., & Thakor, A. V. (1987). Collateral and rationing: sorting equilibria in
monopolistic and competitive credit markets. International economic review,
671-689.
Bester, H. (1985) Screening vs. rationing in credit markets with imperfect
information. The American Economic Review, 75(4), 850-855.
Chan, Y. S., & Kanatas , G. (1985). Asymmetric valuations and the role of collateral in
loan agreements. Journal of money, credit and banking, 17(1), 84-95.
Chen, A., & Kao, L. (2011). Effect of collateral characteristics on bank performance:
Evidence from collateralized stocks in Taiwan. Journal of Banking &
Finance, 35(2), 300-309.
Cornell, B., & Rutten, J. C. (2009). Collateral Damage and Securities Litigation. Utah
L. Rev., 717.
Garin, J. (2015). Borrowing constraints, collateral fluctuations, and the labor
market. Journal of Economic Dynamics and Control, 57, 112-130.
[1]
Geraldo Cerqueiro, Steven Ongena, Kasper Roszbach, Collateralization, Bank Loan
Rates, and Monitoring, Jun2016, the Journal of Finance, ISSN: 0022-1082, Vol:
71, Issue: 3, Page: 1295-1322
Harrison, A. E., Love, I., & McMillan, M. S. (2004). Global capital flows and financing
constraints. Journal of development Economics, 75(1), 269-301.
25
[4]Inderst, R., & Mueller, H. M. (2007). A lender-based theory of collateral. Journal of
Financial Economics, 84(3), 826-859
.Jimenez, G., Salas, V. , & Saurina, J. (2006). Determinants of collateral. Journal of
financial economics, 81(2), 255-281.
Leveroni, T. (2014). Collateral management: Factors affecting the supply and
demand for collateral and emerging trends and developments in the
market. Journal of Securities Operations & Custody, 6(4), 334-341.
Lillo, F., & Pirino, D. (2015). The impact of systemic and illiquidity risk on financing
with risky collateral. Journal of Economic Dynamics and Control, 50, 180-202.
Rajan , R., & Winton, A. (1995). Covenants and collateral as incentives to
monitor. The Journal of Finance, 50(4), 1113-1146.
Thakor, A. V., & Udell, G. F. (1991). Secured lending and default risk: equilibrium
analysis, policy implications and empirical results. The Economic Journal, 101(406),
458-472.
26
7. APPENDIX
Dependent Variable: AEFES_R Method: Least Squares Date: 10/17/16 Time: 21:12
Sample (adjusted): 2006M01 2014M12 Included observations: 108 after adjustments
Variable Coefficient Std. Error t-Statistic Prob.
C -0.040615 0.151584 -0.267935 0.7893
AEFES_LGR -0.135107 0.033159 -4.074461 0.0001
AEFES_LGR(-1) 0.138311 0.034136 4.051746 0.0001
R-squared 0.139639 Mean dependent var -0.004709
Adjusted R-squared 0.123251 S.D. dependent var 0.150990
S.E. of regression 0.141379 Akaike info criterion -1.047360
Sum squared resid 2.098744 Schwarz criterion -0.972856
Log likelihood 59.55742 Hannan-Quinn criter. -1.017151
F-statistic 8.520877 Durbin-Watson stat 2.159698
Prob(F-statistic) 0.000372
Dependent Variable: AKBNK_R Method: Least Squares
Date: 10/17/16 Time: 21:18
Sample (adjusted): 2006M01 2014M12 Included observations: 108 after adjustments
Variable Coefficient Std. Error t-Statistic Prob.
C 0.031651 0.235018 0.134675 0.8931
AKBNK_LGR -0.119908 0.028155 -4.258917 0.0000
AKBNK_LGR(-1) 0.117978 0.027036 4.363693 0.0000
R-squared 0.160373 Mean dependent var -0.002215
Adjusted R-squared 0.144380 S.D. dependent var 0.121876
S.E. of regression 0.112735 Akaike info criterion -1.500171
Sum squared resid 1.334461 Schwarz criterion -1.425667
Log likelihood 84.00923 Hannan-Quinn criter. -1.469962
F-statistic 10.02773 Durbin-Watson stat 2.338376
27
Dependent Variable: AKENR_RMethod: Least Squares Date: 10/17/16 Time: 21:19
Sample (adjusted): 2006M01 2014M12 Included observations: 108 after adjustments
Variable Coefficient Std. Error t-Statistic Prob.
C 0.115249 0.216650 0.531959 0.5959
AKENR_LGR -0.109851 0.060534 -1.814704 0.0724
AKENR_LGR(-1) 0.101341 0.060730 1.668716 0.0982
R-squared 0.031816 Mean dependent var -0.014458
Adjusted R-squared 0.013375 S.D. dependent var 0.187163
S.E. of regression 0.185907 Akaike info criterion -0.499759
Sum squared resid 3.628938 Schwarz criterion -0.425255
Log likelihood 29.98696 Hannan-Quinn criter. -0.469550
F-statistic 1.725243 Durbin-Watson stat 1.878009
Prob(F-statistic) 0.183140
Dependent Variable: AKSA_R Method: Least Squares Date: 11/13/16 Time: 13:06
Sample (adjusted): 2006M01 2014M12 Included observations: 108 after adjustments
Variable Coefficient Std. Error t-Statistic Prob.
C -0.596327 0.450765 -1.322923 0.1887
AKSA_LGR -0.264689 0.068693 -3.853219 0.0002
AKSA_LGR(-1) 0.305042 0.066067 4.617166 0.0000
R-squared 0.171666 Mean dependent var -0.004964
Adjusted R-squared 0.155888 S.D. dependent var 0.187089
S.E. of regression 0.171889 Akaike info criterion -0.656554
Sum squared resid 3.102303 Schwarz criterion -0.582050
Log likelihood 38.45391 Hannan-Quinn criter. -0.626345
F-statistic 10.88021 Durbin-Watson stat 2.447509
28
Dependent Variable: ALARK_RMethod: Least Squares Date: 10/17/16 Time: 21:21
Sample (adjusted): 2006M01 2014M12 Included observations: 108 after adjustments
Variable Coefficient Std. Error t-Statistic Prob.
C 0.068321 0.299129 0.228400 0.8198
ALARK_LGR -0.487545 0.051204 -9.521681 0.0000
ALARK_LGR(-1) 0.482363 0.047753 10.10126 0.0000
R-squared 0.494364 Mean dependent var -0.023592
Adjusted R-squared 0.484733 S.D. dependent var 0.264122
S.E. of regression 0.189592 Akaike info criterion -0.460500
Sum squared resid 3.774240 Schwarz criterion -0.385996
Log likelihood 27.86698 Hannan-Quinn criter. -0.430291
F-statistic 51.32964 Durbin-Watson stat 1.973705
Prob(F-statistic) 0.000000
Dependent Variable: ARCLK_R Method: Least Squares Date: 10/23/16 Time: 14:20
Sample (adjusted): 2006M01 2014M12 Included observations: 108 after adjustments
Variable Coefficient Std. Error t-Statistic Prob.
C -0.126859 0.152563 -0.831519 0.4076
ARCLK_LGR -0.051219 0.015436 -3.318096 0.0012
ARCLK_LGR(-1) 0.060826 0.015455 3.935764 0.0001
R-squared 0.131194 Mean dependent var 0.004327
Adjusted R-squared 0.114645 S.D. dependent var 0.132563
S.E. of regression 0.124733 Akaike info criterion -1.297897
Sum squared resid 1.633626 Schwarz criterion -1.223393
Log likelihood 73.08642 Hannan-Quinn criter. -1.267688
F-statistic 7.927745 Durbin-Watson stat 1.883742
29
Dependent Variable: ASELS_RMethod: Least Squares Date: 10/17/16 Time: 21:22
Sample (adjusted): 2006M01 2014M12 Included observations: 108 after adjustments
Variable Coefficient Std. Error t-Statistic Prob.
C -0.106556 0.367545 -0.289912 0.7725
ASELS_LGR -0.417003 0.067149 -6.210125 0.0000
ASELS_LGR(-1) 0.424182 0.066798 6.350200 0.0000
R-squared 0.281382 Mean dependent var -0.008862
Adjusted R-squared 0.267694 S.D. dependent var 0.212544
S.E. of regression 0.181885 Akaike info criterion -0.543504
Sum squared resid 3.473611 Schwarz criterion -0.469000
Log likelihood 32.34921 Hannan-Quinn criter. -0.513295
F-statistic 20.55690 Durbin-Watson stat 1.976953
Prob(F-statistic) 0.000000
Dependent Variable: AYGAZ_R Method: Least Squares
Date: 10/17/16 Time: 21:25
Sample (adjusted): 2006M01 2014M12 Included observations: 108 after adjustments
Variable Coefficient Std. Error t-Statistic Prob.
C -0.029724 0.269840 -0.110154 0.9125
AYGAZ_LGR -0.091495 0.035378 -2.586178 0.0111
AYGAZ_LGR(-1) 0.093887 0.035650 2.633533 0.0097
R-squared 0.065384 Mean dependent var 0.004494
Adjusted R-squared 0.047582 S.D. dependent var 0.113018
S.E. of regression 0.110296 Akaike info criterion -1.543911
Sum squared resid 1.277350 Schwarz criterion -1.469407
Log likelihood 86.37118 Hannan-Quinn criter. -1.513702
F-statistic 3.672791 Durbin-Watson stat 1.804424
30
Dependent Variable: DOAS_RMethod: Least Squares Date: 10/17/16 Time: 21:29
Sample (adjusted): 2006M01 2014M12 Included observations: 108 after adjustments
Variable Coefficient Std. Error t-Statistic Prob.
C -0.220935 0.377921 -0.584607 0.5601
DOAS_LGR -0.176670 0.046224 -3.822036 0.0002
DOAS_LGR(-1) 0.192725 0.046607 4.135082 0.0001
R-squared 0.143348 Mean dependent var 0.005153
Adjusted R-squared 0.127031 S.D. dependent var 0.165310
S.E. of regression 0.154454 Akaike info criterion -0.870462
Sum squared resid 2.504870 Schwarz criterion -0.795958
Log likelihood 50.00493 Hannan-Quinn criter. -0.840253
F-statistic 8.785102 Durbin-Watson stat 2.035001
Prob(F-statistic) 0.000297
Dependent Variable: DOHOL_R Method: Least Squares
Date: 10/17/16 Time: 21:29
Sample (adjusted): 2006M01 2014M12 Included observations: 108 after adjustments
Variable Coefficient Std. Error t-Statistic Prob.
C -0.103906 0.250521 -0.414761 0.6792
DOHOL_LGR -0.246862 0.048923 -5.045923 0.0000
DOHOL_LGR(-1) 0.252038 0.048727 5.172491 0.0000
R-squared 0.203599 Mean dependent var -0.016260
Adjusted R-squared 0.188429 S.D. dependent var 0.153688
S.E. of regression 0.138453 Akaike info criterion -1.089185
Sum squared resid 2.012774 Schwarz criterion -1.014681
Log likelihood 61.81599 Hannan-Quinn criter. -1.058976
F-statistic 13.42157 Durbin-Watson stat 1.732376
31
Dependent Variable: ECILC_RMethod: Least Squares Date: 10/17/16 Time: 21:31
Sample (adjusted): 2006M01 2014M12 Included observations: 108 after adjustments
Variable Coefficient Std. Error t-Statistic Prob.
C -0.399952 0.388432 -1.029658 0.3055
ECILC_LGR -0.101426 0.067180 -1.509781 0.1341
ECILC_LGR(-1) 0.126829 0.065976 1.922361 0.0573
R-squared 0.039032 Mean dependent var -0.005799
Adjusted R-squared 0.020728 S.D. dependent var 0.147421
S.E. of regression 0.145885 Akaike info criterion -0.984612
Sum squared resid 2.234653 Schwarz criterion -0.910109
Log likelihood 56.16907 Hannan-Quinn criter. -0.954404
F-statistic 2.132394 Durbin-Watson stat 1.908228
Prob(F-statistic) 0.123659
Dependent Variable: ECZYT_R Method: Least Squares Date: 10/17/16 Time: 21:31
Sample (adjusted): 2006M01 2014M12 Included observations: 108 after adjustments
Variable Coefficient Std. Error t-Statistic Prob.
C 0.207010 0.609073 0.339877 0.7346
ECZYT_LGR 0.004723 0.056047 0.084266 0.9330
ECZYT_LGR(-1) -0.018799 0.056157 -0.334761 0.7385
R-squared 0.001564 Mean dependent var 0.001515
Adjusted R-squared -0.017454 S.D. dependent var 0.105855
S.E. of regression 0.106775 Akaike info criterion -1.608798
Sum squared resid 1.197099 Schwarz criterion -1.534294
Log likelihood 89.87508 Hannan-Quinn criter. -1.578589
F-statistic 0.082213 Durbin-Watson stat 2.145019
32
Dependent Variable: ENKAI_RMethod: Least Squares Date: 10/17/16 Time: 21:32
Sample (adjusted): 2006M01 2014M12 Included observations: 108 after adjustments
Variable Coefficient Std. Error t-Statistic Prob.
C -0.019577 0.145787 -0.134286 0.8934
ENKAI_LGR -0.181522 0.031532 -5.756653 0.0000
ENKAI_LGR(-1) 0.182491 0.031615 5.772305 0.0000
R-squared 0.245698 Mean dependent var -0.010717
Adjusted R-squared 0.231330 S.D. dependent var 0.148119
S.E. of regression 0.129862 Akaike info criterion -1.217310
Sum squared resid 1.770725 Schwarz criterion -1.142806
Log likelihood 68.73472 Hannan-Quinn criter. -1.187101
F-statistic 17.10075 Durbin-Watson stat 2.238445
Prob(F-statistic) 0.000000
Dependent Variable: EREGL_R Method: Least Squares
Date: 10/17/16 Time: 21:33
Sample (adjusted): 2006M01 2014M12 Included observations: 108 after adjustments
Variable Coefficient Std. Error t-Statistic Prob.
C -0.021467 0.279662 -0.076761 0.9390
EREGL_LGR 0.006669 0.033611 0.198434 0.8431
EREGL_LGR(-1) -0.005836 0.032744 -0.178228 0.8589
R-squared 0.000375 Mean dependent var -0.006449
Adjusted R-squared -0.018665 S.D. dependent var 0.146551
S.E. of regression 0.147913 Akaike info criterion -0.957006
Sum squared resid 2.297203 Schwarz criterion -0.882503
Log likelihood 54.67834 Hannan-Quinn criter. -0.926798
F-statistic 0.019697 Durbin-Watson stat 1.946245
33
Dependent Variable: FROTO_RMethod: Least Squares Date: 10/17/16 Time: 21:33
Sample (adjusted): 2006M01 2014M12 Included observations: 108 after adjustments
Variable Coefficient Std. Error t-Statistic Prob.
C -0.116001 0.169380 -0.684854 0.4949
FROTO_LGR -0.062124 0.019663 -3.159462 0.0021
FROTO_LGR(-1) 0.072089 0.019803 3.640212 0.0004
R-squared 0.114546 Mean dependent var 0.009395
Adjusted R-squared 0.097681 S.D. dependent var 0.100088
S.E. of regression 0.095074 Akaike info criterion -1.840935
Sum squared resid 0.949105 Schwarz criterion -1.766431
Log likelihood 102.4105 Hannan-Quinn criter. -1.810726
F-statistic 6.791647 Durbin-Watson stat 1.750212
Prob(F-statistic) 0.001683
Dependent Variable: GARAN_R Method: Least Squares
Date: 10/17/16 Time: 21:34
Sample (adjusted): 2006M01 2014M12 Included observations: 108 after adjustments
Variable Coefficient Std. Error t-Statistic Prob.
C 0.215050 0.144870 1.484431 0.1407
GARAN_LGR -0.047665 0.015412 -3.092752 0.0025
GARAN_LGR(-1) 0.036196 0.015043 2.406121 0.0179
R-squared 0.085638 Mean dependent var 0.006052
Adjusted R-squared 0.068221 S.D. dependent var 0.136613
S.E. of regression 0.131870 Akaike info criterion -1.186608
Sum squared resid 1.825932 Schwarz criterion -1.112105
Log likelihood 67.07684 Hannan-Quinn criter. -1.156400
F-statistic 4.917073 Durbin-Watson stat 2.121667
34
Dependent Variable: GSDHO_RMethod: Least Squares Date: 10/17/16 Time: 21:34
Sample (adjusted): 2006M01 2014M12 Included observations: 108 after adjustments
Variable Coefficient Std. Error t-Statistic Prob.
C 0.631047 0.936311 0.673972 0.5018
GSDHO_LGR -0.056122 0.059937 -0.936352 0.3512
GSDHO_LGR(-1) 0.018968 0.059622 0.318139 0.7510
R-squared 0.008994 Mean dependent var -0.003944
Adjusted R-squared -0.009883 S.D. dependent var 0.166041
S.E. of regression 0.166860 Akaike info criterion -0.715941
Sum squared resid 2.923431 Schwarz criterion -0.641437
Log likelihood 41.66080 Hannan-Quinn criter. -0.685732
F-statistic 0.476452 Durbin-Watson stat 1.703862
Prob(F-statistic) 0.622318
Dependent Variable: HURGZ_R Method: Least Squares
Date: 10/17/16 Time: 21:35
Sample (adjusted): 2006M01 2014M12 Included observations: 108 after adjustments
Variable Coefficient Std. Error t-Statistic Prob.
C -0.108307 0.220015 -0.492270 0.6236
HURGZ_LGR -0.114944 0.034220 -3.358977 0.0011
HURGZ_LGR(-1) 0.120941 0.033730 3.585562 0.0005
R-squared 0.109322 Mean dependent var -0.016838
Adjusted R-squared 0.092357 S.D. dependent var 0.147365
S.E. of regression 0.140395 Akaike info criterion -1.061330
Sum squared resid 2.069628 Schwarz criterion -0.986826
Log likelihood 60.31180 Hannan-Quinn criter. -1.031121
F-statistic 6.443887 Durbin-Watson stat 1.943145
35
Dependent Variable: IHLAS_RMethod: Least Squares Date: 10/17/16 Time: 21:35
Sample (adjusted): 2006M01 2014M12 Included observations: 108 after adjustments
Variable Coefficient Std. Error t-Statistic Prob.
C 0.265993 0.307857 0.864016 0.3895
IHLAS_LGR -0.005441 0.053863 -0.101017 0.9197
IHLAS_LGR(-1) -0.009699 0.053642 -0.180816 0.8569
R-squared 0.007636 Mean dependent var -0.009869
Adjusted R-squared -0.011266 S.D. dependent var 0.168070
S.E. of regression 0.169014 Akaike info criterion -0.690285
Sum squared resid 2.999403 Schwarz criterion -0.615782
Log likelihood 40.27540 Hannan-Quinn criter. -0.660077
F-statistic 0.403996 Durbin-Watson stat 1.731554
Prob(F-statistic) 0.668680
Dependent Variable: ISCTR_R Method: Least Squares Date: 10/17/16 Time: 21:36
Sample (adjusted): 2006M01 2014M12 Included observations: 108 after adjustments
Variable Coefficient Std. Error t-Statistic Prob.
C 0.031075 0.235431 0.131992 0.8952
ISCTR_LGR -0.207466 0.031959 -6.491634 0.0000
ISCTR_LGR(-1) 0.205491 0.030717 6.689880 0.0000
R-squared 0.304484 Mean dependent var -0.005107
Adjusted R-squared 0.291236 S.D. dependent var 0.122922
S.E. of regression 0.103486 Akaike info criterion -1.671374
Sum squared resid 1.124485 Schwarz criterion -1.596870
Log likelihood 93.25417 Hannan-Quinn criter. -1.641165
F-statistic 22.98350 Durbin-Watson stat 2.113307
36
Dependent Variable: ISGYO_RMethod: Least Squares Date: 10/17/16 Time: 21:36
Sample (adjusted): 2006M01 2014M12 Included observations: 108 after adjustments
Variable Coefficient Std. Error t-Statistic Prob.
C 0.062948 0.287848 0.218684 0.8273
ISGYO_LGR -0.072195 0.028941 -2.494562 0.0142
ISGYO_LGR(-1) 0.067720 0.029002 2.335009 0.0214
R-squared 0.058714 Mean dependent var -0.006801
Adjusted R-squared 0.040785 S.D. dependent var 0.116125
S.E. of regression 0.113733 Akaike info criterion -1.482549
Sum squared resid 1.358185 Schwarz criterion -1.408045
Log likelihood 83.05765 Hannan-Quinn criter. -1.452341
F-statistic 3.274757 Durbin-Watson stat 2.105886
Prob(F-statistic) 0.041724
Dependent Variable: KARSN_R Method: Least Squares
Date: 10/17/16 Time: 21:37
Sample (adjusted): 2006M01 2014M12 Included observations: 108 after adjustments
Variable Coefficient Std. Error t-Statistic Prob.
C -0.503991 0.254655 -1.979118 0.0504
KARSN_LGR 0.080021 0.044194 1.810694 0.0730
KARSN_LGR(-1) -0.048715 0.043470 -1.120656 0.2650
R-squared 0.051294 Mean dependent var -0.013227
Adjusted R-squared 0.033223 S.D. dependent var 0.166421
S.E. of regression 0.163634 Akaike info criterion -0.754989
Sum squared resid 2.811476 Schwarz criterion -0.680485
Log likelihood 43.76940 Hannan-Quinn criter. -0.724780
F-statistic 2.838507 Durbin-Watson stat 1.661658
37
Dependent Variable: KCHOL_RMethod: Least Squares Date: 10/17/16 Time: 21:38
Sample (adjusted): 2006M01 2014M12 Included observations: 108 after adjustments
Variable Coefficient Std. Error t-Statistic Prob.
C 0.249298 0.293551 0.849250 0.3977
KCHOL_LGR -0.151698 0.032528 -4.663617 0.0000
KCHOL_LGR(-1) 0.135656 0.033015 4.108880 0.0001
R-squared 0.172881 Mean dependent var 0.006197
Adjusted R-squared 0.157126 S.D. dependent var 0.124028
S.E. of regression 0.113868 Akaike info criterion -1.480169
Sum squared resid 1.361422 Schwarz criterion -1.405665
Log likelihood 82.92912 Hannan-Quinn criter. -1.449960
F-statistic 10.97334 Durbin-Watson stat 2.181363
Prob(F-statistic) 0.000047
Dependent Variable: KOZAA_R Method: Least Squares
Date: 10/17/16 Time: 21:38
Sample (adjusted): 2006M01 2014M12 Included observations: 108 after adjustments
Variable Coefficient Std. Error t-Statistic Prob.
C -0.134092 0.333781 -0.401735 0.6887
KOZAA_LGR -0.233287 0.067479 -3.457173 0.0008
KOZAA_LGR(-1) 0.241539 0.067009 3.604580 0.0005
R-squared 0.110229 Mean dependent var -0.009985
Adjusted R-squared 0.093281 S.D. dependent var 0.217408
S.E. of regression 0.207020 Akaike info criterion -0.284617
Sum squared resid 4.500019 Schwarz criterion -0.210113
Log likelihood 18.36932 Hannan-Quinn criter. -0.254408
F-statistic 6.503929 Durbin-Watson stat 1.645798
38
Dependent Variable: KRDMD_RMethod: Least Squares Date: 10/17/16 Time: 21:39
Sample (adjusted): 2006M01 2014M12 Included observations: 108 after adjustments
Variable Coefficient Std. Error t-Statistic Prob.
C -0.074143 0.725410 -0.102208 0.9188
KRDMD_LGR -0.085539 0.059103 -1.447297 0.1508
KRDMD_LGR(-1) 0.090397 0.059081 1.530043 0.1290
R-squared 0.023542 Mean dependent var 0.012015
Adjusted R-squared 0.004943 S.D. dependent var 0.137607
S.E. of regression 0.137266 Akaike info criterion -1.106402
Sum squared resid 1.978417 Schwarz criterion -1.031898
Log likelihood 62.74569 Hannan-Quinn criter. -1.076193
F-statistic 1.265745 Durbin-Watson stat 1.896537
Prob(F-statistic) 0.286296
Dependent Variable: PETKM_R Method: Least Squares
Date: 10/17/16 Time: 21:39
Sample (adjusted): 2006M01 2014M12 Included observations: 108 after adjustments
Variable Coefficient Std. Error t-Statistic Prob.
C 0.081629 0.223679 0.364937 0.7159
PETKM_LGR -0.401221 0.048180 -8.327625 0.0000
PETKM_LGR(-1) 0.396602 0.047842 8.289890 0.0000
R-squared 0.401353 Mean dependent var -0.006359
Adjusted R-squared 0.389950 S.D. dependent var 0.182783
S.E. of regression 0.142764 Akaike info criterion -1.027868
Sum squared resid 2.140052 Schwarz criterion -0.953365
Log likelihood 58.50489 Hannan-Quinn criter. -0.997660
F-statistic 35.19777 Durbin-Watson stat 1.802548
39
Dependent Variable: PRKME_RMethod: Least Squares Date: 10/17/16 Time: 21:40
Sample (adjusted): 2006M01 2014M12 Included observations: 108 after adjustments
Variable Coefficient Std. Error t-Statistic Prob.
C -0.305963 0.492437 -0.621324 0.5357
PRKME_LGR -0.042513 0.098201 -0.432920 0.6660
PRKME_LGR(-1) 0.061877 0.097196 0.636623 0.5258
R-squared 0.006533 Mean dependent var -0.005198
Adjusted R-squared -0.012390 S.D. dependent var 0.177029
S.E. of regression 0.178123 Akaike info criterion -0.585303
Sum squared resid 3.331410 Schwarz criterion -0.510799
Log likelihood 34.60636 Hannan-Quinn criter. -0.555094
F-statistic 0.345222 Durbin-Watson stat 2.002591
Prob(F-statistic) 0.708864
Dependent Variable: SAHOL_R Method: Least Squares
Date: 10/17/16 Time: 21:41
Sample (adjusted): 2006M01 2014M12 Included observations: 108 after adjustments
Variable Coefficient Std. Error t-Statistic Prob.
C -0.012587 0.302407 -0.041621 0.9669
SAHOL_LGR -0.167457 0.031464 -5.322167 0.0000
SAHOL_LGR(-1) 0.168534 0.031479 5.353920 0.0000
R-squared 0.232759 Mean dependent var 0.002618
Adjusted R-squared 0.218145 S.D. dependent var 0.124759
S.E. of regression 0.110315 Akaike info criterion -1.543569
Sum squared resid 1.277787 Schwarz criterion -1.469065
Log likelihood 86.35271 Hannan-Quinn criter. -1.513360
F-statistic 15.92700 Durbin-Watson stat 1.958779
40
Dependent Variable: SASA_RMethod: Least Squares Date: 10/17/16 Time: 21:42
Sample (adjusted): 2006M01 2014M12 Included observations: 108 after adjustments
Variable Coefficient Std. Error t-Statistic Prob.
C -0.246471 0.505870 -0.487223 0.6271
SASA_LGR -0.017248 0.051143 -0.337247 0.7366
SASA_LGR(-1) 0.032756 0.049391 0.663202 0.5087
R-squared 0.005235 Mean dependent var 0.004044
Adjusted R-squared -0.013713 S.D. dependent var 0.130335
S.E. of regression 0.131225 Akaike info criterion -1.196417
Sum squared resid 1.808108 Schwarz criterion -1.121914
Log likelihood 67.60654 Hannan-Quinn criter. -1.166209
F-statistic 0.276261 Durbin-Watson stat 1.888689
Prob(F-statistic) 0.759165
Dependent Variable: SISE_R Method: Least Squares Date: 10/17/16 Time: 21:43
Sample (adjusted): 2006M01 2014M12 Included observations: 108 after adjustments
Variable Coefficient Std. Error t-Statistic Prob.
C 0.126848 0.399172 0.317778 0.7513
SISE_LGR -0.083503 0.028686 -2.910917 0.0044
SISE_LGR(-1) 0.074998 0.028661 2.616708 0.0102
R-squared 0.085123 Mean dependent var -0.002366
Adjusted R-squared 0.067696 S.D. dependent var 0.140995
S.E. of regression 0.136139 Akaike info criterion -1.122899
Sum squared resid 1.946047 Schwarz criterion -1.048395
Log likelihood 63.63652 Hannan-Quinn criter. -1.092690
F-statistic 4.884736 Durbin-Watson stat 2.179940
41
Dependent Variable: TCELL_RMethod: Least Squares Date: 10/17/16 Time: 21:44
Sample (adjusted): 2006M01 2014M12 Included observations: 108 after adjustments
Variable Coefficient Std. Error t-Statistic Prob.
C -0.040712 0.216702 -0.187871 0.8513
TCELL_LGR -0.040620 0.020937 -1.940123 0.0550
TCELL_LGR(-1) 0.043704 0.020973 2.083778 0.0396
R-squared 0.042343 Mean dependent var 0.005149
Adjusted R-squared 0.024101 S.D. dependent var 0.085272
S.E. of regression 0.084238 Akaike info criterion -2.082949
Sum squared resid 0.745090 Schwarz criterion -2.008445
Log likelihood 115.4792 Hannan-Quinn criter. -2.052740
F-statistic 2.321273 Durbin-Watson stat 2.307428
Prob(F-statistic) 0.103166
Dependent Variable: THYAO_R Method: Least Squares
Date: 10/17/16 Time: 21:44
Sample (adjusted): 2006M01 2014M12 Included observations: 108 after adjustments
Variable Coefficient Std. Error t-Statistic Prob.
C 0.063574 0.340060 0.186950 0.8521
THYAO_LGR -0.309546 0.051745 -5.982112 0.0000
THYAO_LGR(-1) 0.306380 0.048546 6.311186 0.0000
R-squared 0.276185 Mean dependent var 0.001210
Adjusted R-squared 0.262398 S.D. dependent var 0.179945
S.E. of regression 0.154543 Akaike info criterion -0.869302
Sum squared resid 2.507776 Schwarz criterion -0.794799
Log likelihood 49.94232 Hannan-Quinn criter. -0.839094
F-statistic 20.03234 Durbin-Watson stat 2.028040