IMPACT OF EU ACCESSION PROCESS ON TURKEY’S FDI PERFORMANCE:
A COMPARATIVE ANALYSIS OF TURKEY AND CEE COUNTRIES
DENİZ UYAN 103608004
İSTANBUL BİLGİ ÜNİVERSİTESİ SOSYAL BİLİMLER ENSTİTÜSÜ
AVRUPA ETÜDLERİ YÜKSEK LİSANS PROGRAMI
DOÇ. DR. DURMUŞ ÖZDEMİR 2006
Impact Of EU Accession Process On Turkey’s FDI Performance: A Comparative Analysis Of Turkey and CEE Countries
AB’ye Katılım Sürecinin Türkiye’nin Doğrudan Yabancı Yatırım Performansı Üzerine Etkisi: Türkiye ve Orta Doğu Avrupa Ülkeleri Karşılaştırmalı Analizi
Deniz Uyan 103608004
Doç. Dr. Durmuş ÖZDEMİR :... Doç. Dr. Çiğdem ÇELİK :... Yrd. Doç. Dr. Aylin Seçkin :...
Tezin Onaylandığı Tarih
: ...
Toplam Sayfa Sayısı: 70
Anahtar Kelimeler (Türkçe) Anahtar Kelimeler (İngilizce) 1) Doğrudan Yabancı Yatırım 1) Foreign Direct Investment
2) Avrupa Birliği 2) European Union
3) Türkiye 3) Turkey
4) Orta Doğu Avrupa Ülkeleri 4) Central East European Countries
ABSTRACT
Foreign Direct Investment (FDI) is a particularly important element for accelerated growth, technical innovation and enterprise restructuring of countries, as well as capital account relief. The determinants of FDI are thought to be macroeconomic conditions, political climate, institutional factors, labor costs, location, human capital, infrastructure, host country’s trade openness and the prospect of European Union (EU) membership for the countries in the EU accession process. Since the beginning of their transition, Central East European Countries have attracted a considerable amount of FDI.
Turkey, on the other hand, has performed quite poor in attracting FDI, despite her renowned economic potential and geographic advantages. However, in late 2005 and 2006 first half, we have seen that the FDI inflow into the country has increased significantly. There is no doubt that, opening of negotiations on October 3rd 2005 has a crucial role in this increase. It is very likely that this latest surge in FDI will proceed hand in hand with the progress of EU accession process.
ÖZET
Doğrudan yabancı yatırımlar, ülkelerin büyümelerini hızlandırmaları, teknolojik yenilikleri ve girişimleri şekillendirmeleri ve sermaye girişi sağlamaları açısından önemlidir. Doğrudan yabancı yatırımı davet eden unsurların (determinantlar); makroekonomik koşullar, politik ortam, kurumsal faktörler, iş gücü maliyeti, yatırım yeri, beşeri sermaye, altyapı, ticaret açıklığı ve AB’ye giriş sürecinde olan ülkeler için beklenen AB üyeliği olduğu düşünülmektedir. Orta ve Doğu Avrupa ülkeleri AB’ye giriş sürecinde kayda değer oranlarda doğrudan yabancı yatırım çekmişlerdir.
Öte yandan Türkiye; ekonomik potansiyeli ve coğrafi avantajlarına rağmen doğrudan yabancı yatırım çekme konusunda zayıf bir performans sergilemiştir. Ancak 2005 yılının sonu ve 2006 yılının ilk yarısında, ülkeye doğrudan yabancı yatırım girişi artmıştır. Hiç şüphesiz ki, bu artışta 3 Ekim 2005 tarihinde AB ile başlayan müzakerelerin etkisi önemli olmuştur. Bu son dalga, çok muhtemeldir ki, AB’ye giriş sürecinde artarak devam edecektir.
ACKNOWLEDGMENTS
I would like to express my sincere gratitude to my thesis supervisor Associate Professor Dr. Durmuş Özdemir, for all his guidance and help.
I would like to thank Associate Professor Dr. Çiğdem Çelik and Assistant Professor Dr. Aylin Seçkin for their invaluable comments and evaluations on my thesis.
I would also like to thank my friends Bengi Yanık, Eren Ocakverdi and Onur Varol for their contribution and advise especially on my econometric studies.
I am grateful to my best friends Özlem Badak, Dilek Tepetam, Başak Efe for their encouragement, friendship and trust during my thesis and ever.
I am thankful to Onur Topal for his support, valuable criticism and being with me at every stage of my thesis.
Thanks to my sister, Derya Uyan, for her support, love and forever friendship. I would like to thank my parents, Durdane and A.Mazhar Uyan, for their lifetime efforts on my education and for their unconditional love.
TABLE OF CONTENTS
Title Page………... i Abstract……….. iii Özet……… iv Acknowledgments………. v Table of Contents………... vi Tables……….…… vii Figures……… viiList of Abbreviations……….…… viii
INTRODUCTION……… 1
Discussion of the problem………... 6
Statement of the Problem………. 7
1) LITERATURE REVIEW ON FOREIGN DIRECT INVESTMENT………. 8
1.1. Definition of FDI……….. 8
1.2. Determinants of FDI……….…… 8
1.3. The Impact of FDI on the Host Economy……… 12
2) IMPACT OF EU ACCESSION PROCESS ON FDI PERFORMANCE…... 17
2.1. The Relation Between EU Accession and FDI Flow……… 17
2.2. European Union Accession Process, FDI and Turkey……….. 24
2.2.1 Turkey’s FDI Performance Over Time……….…… 24
2.2.2. Competitor FDI Locations………... 28
2.2.3. FDI Flows and Trends to Turkey……….…… 31
2.2.3. Reasons Behind Turkey’s Underperformance……….…… 33
2.2.4. Opportunities for Foreign Investors in the Turkish Market………….…… 36
3) ECONOMETRIC STUDY………. 44
3.1.CEE Effect on Turkey’s FDI Attractiveness……….…… 44
3.2. Impact of Economic Determinants on Turkey’s FDI Performance……….. 47
4) CONCLUSION……… 52
5) BIBLIOGRAPHY……… 56
TABLES
Table 1: FDI inflows to CEE countries, and its share of total world inflow Table 2: FDI inflows as percentage of Gross Fixed Capital
Table 3: Stock of FDI Table 4: FDI Matrix
Table 5: FDI Inflows as Percentage of GDP Table 6: FDI Instock as Percentage of GDP
Table 7: Breakdown of FDI Capital Inflow to Turkey by Countries Table 8: Breakdown of FDI by Sectors (1954-2005)
Table 9: Key Economic Indicators, 2003 Table 10: Key Economic Indicators, 2004 Table 11: Privatization and FDI in Turkey
FIGURES
Figure 1: Total FDI Inflows to CEE countries between 1995-2004 Figure 2: FDI Inflows to Czech Republic, Hungary and Poland Figure 3: FDI in Turkey
Figure 4: Turkey’s key competitors for FDI
Figure 5:Mode of Establishment (Number of Companies), 1954-2006 Figure 6:Mode of Establishment
Figure 7: Major obstacles of FDI in Turkey Figure 8: FDI Net Inflows to Turkey Figure 9: Privatization in Turkey
LIST OF ABBREVIATIONS
CEE Central Eastern Europe
CEEC Central Eastern European Countries
CU Customs Union
EU European Union
FDI Foreign Direct Investment
GDFI General Directorate of Foreign Investment GDP Gross Domestic Product
IMF International Monetary Fund M&A Merger and Acquisition MNC Multinational Corporations MNE Multinational Entreprises
OECD Organization for Economic Cooperation and Development
UN United Nations
INTRODUCTION
Globalization, the growing integration of economies and societies around the world (World Bank, 2005), is not a new phenomenon. The economic activity between people on different geographic locations has existed for centuries. The unique side of today’s globalization is the rapid pace at which it is accelerating. This is also why globalization today not only includes the exchange of goods and services, but also can be specified as the integration of trade, capital flows, labor or technological transfers between nations (Dutt, 2001). Siphambe (2003) states the dimensions of globalization as economic, political and cultural; all of which have a social impact. In this study, the economic side is analyzed in better detail and it is mentioned that on the economic side, there are five key features of globalization:
(i) Rapidly expanding international trade, facilitated by newer technologies among others. A growth in foreign trade as a share of Gross Domestic Product (GDP) is commonly used as an indicator of globalization.
(ii) Increase in foreign direct investment (FDI) and capital flows.
(iii) Increasing internationalization of production, distribution and marketing of goods and services as a result of the adoption of new organizational forms of production by multinational enterprises and growth in capital markets and FDIs.
(iv) Growing global competition among producers and suppliers of goods and services.
(v) Adoption of economic reforms and liberalization of trade and investment policies undertaken by developing countries
As an economic outcome of globalization; FDI plays an extraordinary and growing role in global business. One of the most obvious consequences of globalization is the fact that it accelerates and intensifies competition. This leads to adopt and develop new strategic approaches not only for multinational enterprises (MNEs), which are doing business abroad, but also local enterprises in order to survive. In European Union Foreign Direct Investment Year Book (2005), it is mentioned that FDI plays a key role in the globalization process as an important element of international relations and their development. While supplementing trade, FDI creates more direct and deeper links between economies. It is a source of extra capital, encourages efficient production, stimulates technology transfer and fosters the exchange of managerial know-how. It is thus believed to improve the productivity of business and make economies more competitive. In this study, FDI data was used as a tool for measuring the evolution of the globalization phenomenon. With the trends of globalization, liberalization in foreign currency and trade regimes, the volume of FDI increased throughout the world. Since the early 1980s, world FDI flows have grown rapidly -faster than both world trade and world output. (OECD, 2001).
FDI has also been a widely discussed topic in the context of European Union (EU). In various researches, the correlation between the FDI attractiveness and EU membership process has been analyzed and most of the studies have come to a consensus that one of the key benefits of the EU enlargement process is the boost it gives to foreign direct investment.
Although the EU-15 is still far from a consensus on the need for ongoing enlargement, the accession countries themselves have been enthusiastic with the
EU integration process. Of the many discussion bases, economic improvement and growth prospects have been the main motives to make the EU membership attractive for these countries. Membership criteria require that an accession country improve and maintain economic soundness, harmonize the legal infrastructure with the Union’s Acquis and remove trade barriers. These criteria are also taken as positive economic targets by these countries and appear as benefits to stem from integration with the EU.
Of course, these prospects are also closely watched by the interests of global investors, since the establishment or relocation of facilities to these promising economies are getting more and more feasible and profitable during the course of integration. Therefore, it is generally acknowledged that the FDI stocks in these countries have increased towards and upon accession to the EU. Inflows of investment to CEE countries have increased sharply since 1994, when the EU committed itself to enlarging.
Turkey’s being an emerging market and an EU candidate state as well as a growing export partner for foreign companies have been the key motives for developing the purpose of this study. Current EU negotiations added on to the interest and importance to study the background to and the impact of EU accession of Turkey on MNEs’ choices to engage themselves in FDI in Turkey.
Turkey is situated on the crossroads between Europe and Asia with a population of 70 millions. Its strategic geographical location is significant as it adds value to the country’s economic potential and creates market opportunities for foreign investors. Along with China, India, Russia and Brazil, Turkey has been named to be one of the ten emerging markets in the world by the World Bank as
well as the US Department of Commerce (The World Bank, Erdal & Tatoğlu, 2002). During 2004, Turkey’s economic growth rate was 8.9%, which was mainly triggered by exports. Moreover, Turkey is a quarter of the size of the EU in terms of geographical area and has a population that is one-fifth of that of the EU-25. This fact puts the country among the top 25 economies in the world in terms of GDP. (FDI Magazine, 2004). On January 1st 1996, a Customs Union (CU) between Turkey and the EU came into effect. Turkey is the only country to have a CU agreement with the EU without being a member state. The CU allows the free circulation of industrial goods and processed agricultural products and has resulted in a closer economic and political relationship between the EU and Turkey. Customs duties and charges have been abolished and quantitative restrictions such as quotas are prohibited. The CU transferred most of the EU's trade and competition rules to Turkey and made the Turkish economy even more open to FDI.
Although Turkey should be an interesting market for foreign investors both because of the increasing growth rate and its geographical location, she lagged behind other emerging economies as well as 10 new EU member states. FDI inflows into CEE countries increased sharply since 1994, after the public commitment made by EU about Eastern enlargement in Essen European Council. The fact that the total FDI stock has risen by 7-fold between 1994 and 2005 in CEE-Countries recurs to the mind that there could even be a correlation between Turkey’s performance, which is far below its potential, and CEE countries’ successful FDI attracting performance.
In this context, this study is analyzing the case of FDI inflows into the new member states of the EU, in comparison to and with a special emphasis on Turkey’s FDI experience. The study initially examines the definition and determinants of FDI and its effects on the host economy; then discusses the impact of EU accession process on FDI performance of both Turkey and CEE countries. Finally by presenting econometric models, the study investigates if Turkey’s FDI attraction performance was affected by the performance of CEE countries between the years 1994 and 2005 and also the impact of major economic determinants on Turkey’s FDI performance.
Discussion of the problem
Despite the presence of economic prerequisites and a diminishing number of barriers to entry, FDI in Turkey has remained quite low (FDI Magazine, 2004), especially when compared to other emerging markets such as the CEE countries, Far Eastern and Latin American countries (Erdal &Tatoğlu, 2002). However, it should be emphasized that FDI in Turkey is increasing, even though the progress is relatively slow (Turkish Treasury Department statistics, 2005).
The aim of this study is to identify the impact of EU accession process on the FDI performance of Turkey. Moreover, it also tries to discuss the main reasons and factors that are supposed to be behind the investment decisions of the companies that have engaged in FDI in Turkey and in CEE countries during the EU accession process. Finally, it tries to make an analysis about the effect of CEE accession process on Turkey’s FDI performance and the impact of major economic determinants on Turkey’s FDI performance.
Statement of the Problem
1. What is the impact of EU accession process on candidate countries’ FDI performance?
2. Did CEE Countries’ FDI performance in the EU Accession period affect Turkey’s FDI Performance in any way?
3. What are the impacts of economic determinants on Turkey’s FDI Performance?
1) LITERATURE REVIEW ON FOREIGN DIRECT
INVESTMENT
1.1. Definition of FDI
There are several descriptions of FDI in literature. According to IMF and OECD recommendations; “Direct investment is the category of international investment that reflects the objective of a resident entity in one economy (direct investor) of establishing a lasting interest in an enterprise (the direct investment enterprise) resident in another economy.” (Falzoni, 2000). In another expression by IMF and OECD, Foreign Direct Investment is defined as “an incorporated or unincorporated enterprise in which a foreign investor owns 10% or more of the ordinary shares or voting power of an incorporated enterprise or the equivalent of an unincorporated enterprise. Direct investment enterprises may be subsidiaries, associates or branches”. (Duce, 2003)
1.2. Determinants of FDI
FDI is a particularly important element of economic integration, because it opens possibilities for accelerated growth, technical innovation and enterprise restructuring, as well as capital account relief (Garibaldi et al (1999); Holland and Pain (1998)). In literature, there are numerous studies why foreign firms choose to invest abroad. The determinants of FDI are thought to be macroeconomic conditions, political climate, institutional factors, labor costs, location, human capital, infrastructure, trade openness of the host country, and the prospect of EU membership for the countries in the EU accession process.
One of the major determinants of FDI is reasoned by the motives for investing abroad instead of investing at home. Dunning (1977; 1988) represented OLI (Ownership, Location, Internalization) paradigm in order to explain the motivation driving firms to invest overseas and the reason why one location is selected in preference to another. At this point, Dunning has identified four generic types of strategic motives for international investment:
- Market seeking - Efficiency seeking - Resource seeking - Asset seeking
Market seeking or horizontal FDI motives are the correlation between the host economy’s market size and FDI flows. In resource-seeking FDI, investors would like to invest in the countries where they can acquire resources such as raw materials, labor and natural resources at a lower real cost. Efficiency-seeking or vertical FDI is undertaken when a firm benefits from setting up different plants at different locations for the sake of economies of scale in order to minimize factor costs. According to Dunning (2002), FDI in developing countries has shifted from market-seeking and resource-seeking to (vertical) efficiency-seeking, as firms are expected to relocate some of their production facilities to low cost developing countries as a consequence of globalization effect on prices.
Loewendahl (2001) reveals that asset-seeking FDI is the most recent motive for FDI to be identified. The major aim in the asset-seeking FDI is to access and exploit technological assets in overseas countries especially in the form of mergers & acquisitions and technology agreements. In this sense,
although the developed countries are considered as the main recipients, there are also developing countries such as Hungary, India and Brazil attracting research & development projects. According to Loewendahl, cost differences are only likely to play a critical role in determining investment location when the investor needs to choose between short-listed countries, which are likely to be part of the same, sub-regional market.
There are many reasons why foreign firms consider macroeconomic stability as necessity to invest. It is widely accepted that macroeconomic conditions play a significant role in attracting FDI. Low inflation rates and stable exchange rates are used as the key factors in verifying the stability and the strength of the economy and provide a degree of certainty to the future of the economy and the projections of the firms in profit considerations. Moreover, a stable macro-economic environment usually implies a stable political environment. (Balasubramanyam, 2001)
According to Michalet (1997): “an indispensable precondition for encouraging foreign investment is to have a stable political and economic climate, and a transparent and nondiscretionary legal and regulatory framework.” Institutional factors such as corruption and political instability are key negative determinants of FDI as corruption can discourage FDI by inducing higher costs of doing business. (Wei 1997, Makusen 1998)
Domestic market size and differences in factor costs are highlighted as determinants for the location of FDI by Markusen and Maskus (1999), Lim (2001) and Moosa (2002). Foreign firms seeking a market to invest are more attracted to the country with higher growth rate of GDP as it indicates a larger potential
demand for their product. Market-related factors are more about the traditional determinants of FDI. In an earlier study, Agarwal (1980) argued that the market size of the host country is the most important factor for the attractiveness of FDI. Also in many studies, such as Wheeler and Mody (1992) and Tsai (1994); FDI determinants are revealed as the market- related variables such as GDP, GDP per capita and GDP growth and population.
There are controversial arguments regarding the effect of labor cost on investment incentives. On the one hand, while some authors have claimed that higher wages do not always deter FDI in all industries; on the other hand, it is asserted that a high nominal wage- other things being equal- deters FDI, especially for the firms which engage in labor-intensive production activities.1 While some studies have shown no significant role of labor costs, some others have shown the positive relationship between labor costs and FDI as higher wages indicate higher productivity.2 According to Lucas (1998), the importance of human capital tends to be small, when a host country is more appealing to labor-intensive FDI. Contrarily, according to Fung, Iizaka, and Parker, (2002), labor skill is more significant for a host country where more capital and technology intensive investment projects are concentrated.
Fung, Iizaka, and Parker (2002); also found that better developed regions with superior quality of infrastructure are more attractive to foreign firms. Infrastructure facilities including transportation and communication networks are
1 See studies that find no significant or a negative relationship of wage and FDI are Kravis and Lipsey, 1982; Wheeler and Mody, 1990; Lucas, 1993; Bajo-Rubio and Sosvilla-Rivero, 1994; Wang and Swain, 1995; and Barrell and Pain, 1996.
2 For positive relationship between FDI and wage, see Saunder, 1983; Schneider and Frey, 1985; Moore, 1993; and Love and Lave-Hidalgo, 2000.
also found as important determinants of FDI in the studies of Langhammer (1991).
Trade related FDI is analyzed in depth by more recent studies. Export orientation is found to be the strongest variable for attracting FDI according to Sing and Jun (1995). In Gastanaga, Nugent and Pashamova (1998), tariff-jumping hypothesis is addressed in the context of a panel analysis on the effects of host country reforms on FDI. In their study, as the effects of import tariffs on FDI tend to be negative in a time series context, they come to a conclusion that “over time in countries, trade liberalization has become the more important motive for FDI”.
Another strong determinant is the prospect of EU membership. It is considered to be the major motive driving firms to invest in the accession countries, which will be analyzed in depth in Section 2.
1.3. The Impact of FDI on the Host Economy
FDI has become an important tool for development of many countries. There is general agreement about the positive impacts of FDI on the welfare of receiving countries. The benefits of FDI concerning the capital market, technology transfer, market access, investment opportunities and export promotion are among the factors attracting FDI inflows from a host country perspective. There is broad consensus that foreign direct investment has a favorable effect on the host economy and especially on economic growth. For over two decades now, several international organizations such as the World Bank, International Monetary Fund, World Trade Organization and divisions of United Nations have been promoting FDI as an essential instrument for boosting
economic growth, technology spillovers and other benefits. In accordance with the reports of these organizations, FDI is believed to raise the level of productivity (which in turn is presumed to enhance economic growth) of a host economy in at least three ways:
- Inviting superior productivity of foreign firms
- Creating spillover effects of FDI which are beneficial for domestic competitors
- Increasing competition in the domestic market, at least in highly concentrated industries
Besides, international investment can either bring access to foreign technologies and new working practices or make available new products and process that embody foreign knowledge, helping to close the ‘idea gaps’ as Romer puts it in his renowned 1993 article.
Yet, on the other hand, a study in 2002 by Carkoviz and Levine contradictorily suggests that the exogenous component of FDI does not exert a robust independent influence on growth. The authors discuss that the growth effects of FDI remain unclear and that the empirical evidence in this regard is divided. In a parallel view, a different study states that FDI in manufacturing sector has a significant and positive effect on economic growth in the host economies whereas FDI inflows in non-manufacturing sectors do not play a significant role in enhancing economic growth. (Wang, 2003)
According to Zacharov and Kusic (2003), for the recipient countries it is not the amount of FDI that plays a significant role, but contribution to the economic development. FDI does not only increase production in real sector but
also facilitates economic modernization and transfer of know-how. Furthermore, foreign investment creates additional employment in the host country. FDI flow is one of the major ways of technology transfer. By providing new technology and investment goods, the competitiveness of goods and services in the host country will improve, which will lead to higher sales on international markets. FDI supplies not only new technology but also advanced management techniques. These entire positive spillover effects of FDI inflows are believed to accelerate growth in the recipient country. The authors also pointed out the positive correlation between the amount of FDI and the growth of GDP and work productivity. With FDI inflows, the recipient country also benefits from accessing to new markets that contributes to increase export incomes. New market experience for the recipient country leads to better quality production and this helps to raise competitiveness. Moreover, they emphasize that FDI is a source for financing balance deficits and thus host country improves its credit liability, which in turn facilitates access to other financial sources.
There have been many studies in the last decades that analyze the correlation between trade and FDI. Some of them have investigated if trade creates FDI in the end, or vice versa. Another issue is the substitution effect between these two. This was also debated publicly in Turkey; if the Customs Union and increased trade with EU countries could negatively affect the amount of incoming FDI, since the European companies could choose to easily export instead of investing. In Turkey’s case, we have seen that this has not happened. Between 1994 and 1996, it was believed that the decrease in tariff rates would increase the exports to Turkey and this would reduce FDI inflows. Contrarily, the
performance of Turkey between these years cannot be explained by substitution effect between trade and FDI. While every step of integration with the EU (trade-related, bureaucratic, legal…etc.) has helped increasing FDI inflows, any economic or political instability deteriorates FDI performance of a country.
Theory suggests that the correlation between trade and FDI is complex and involves many parameters. Sakakibara and Yamakawa (2003) state that this correlation may vary by the product, economic sector and across different countries. The type of FDI (whether it is resource-seeking or export oriented…etc.) may affect the import and export patterns of the host country. The authors defend that usually trade comes first, which in turn creates FDI. In the later stages, this FDI causes increased trade. Another important point mentioned by Sakakibara and Yamakawa (2003) is that the debate of trade vs. FDI is changing into the discussion of international production networks. Since the costs of communication and transportation have improved, it is now a question of where to locate the production and export bases for the multinationals. China, for example, is a popular destination of export-oriented FDI, causing increased raw material imports into the country, as well as exports of semi-finished and finished products. Therefore, the important issue to discuss according to Sakakibara and Yamakawa (2003) is not whether FDI and trade are substitutes, but instead, it is how multinationals decide their production and export locations. Aizenman and Noy (2005), on the other hand, discuss in their literature review that the major argument in this field is that increased FDI results in increased trade. The authors refer to an older study of themselves, and state that causality between commercial
openness (trade) and aggregate financial openness (FDI) is strong in both directions.
2) IMPACT OF EU ACCESSION PROCESS ON FDI
PERFORMANCE
2.1. The Relation Between EU Accession and FDI Flow
According to Eurostat (1997: 39) “European companies have a tendency to respond to globalization pressure by enhancing the division of labor through FDI within the EU rather than to third countries.” This means that the EU membership makes a country more attractive for FDI from other EU countries. On the other hand, with the EU membership a country also attains the opportunity to get a share from the FDI inflows to the EU from third countries.
The last European Union enlargement, took place in 2004, introduced eight countries from CEE to the EU. Experience from previous enlargements suggests that joining the EU will increase trade flows between the new member states and other EU countries and will also attract higher levels of FDI to the transition economies (Holland and Pain 2000).
Bevan and Estrin (2000) made an analysis about whether or not EU membership can be viewed as a determining element of the operating business environment, and this may directly influence the rate of FDI flows in transition economies. According to them, the prospect of EU membership might be viewed by potential investors as reducing country risk; for meeting the requirements of EU admission represents an external validation of progress in transition and also because ultimate EU membership implies guarantees in terms of macro economic stability, institutional and legal environment and political stability. They suggest that countries that take part in the EU accession process benefit from increased FDI while the relative position of the delayed entrants could deteriorate and
therefore EU announcements tend to widen divisions in terms of FDI among delayed entrants and candidate countries. They show that key announcements of progress in EU accession have impacted directly upon FDI receipts but have not influenced country credit ratings. The study comes to a conclusion that The Agenda 2000 announcement by the European Commission induced a bifurcation between the ‘first wave’ transition countries and the remainder of their sample. This process triggers FDI, which also improves country credit ratings with a lag, hence increasing future FDI receipts. Consequently the authors suggested that the accession progress has the potential to induce virtuous cycles for the frontrunners but may have serious consequences for the late comers as the expected amount of FDI may not be received.
Since the start of transition period, accession countries have attracted a considerable amount of FDI. FDI inflows into CEE candidate countries increased sharply since 1994, after the public commitment made by EU about Eastern Enlargement in Essen European Council. In 1990, while the accession countries accounted for 2.1 percent of world GDP, they attracted only negligible amounts of FDI, less than 0.1 per cent of the 1990 total. In 2001, the same eight countries accounted for just over 1.75 percent of world GDP, while attracting over 2.2 per cent of 2001 world FDI flows. In 2002 these accession countries attracted 3.2 per cent of total world FDI inflow.
Table 1: FDI inflows to CEE countries, and its share of total world inflow
Source: Own calculations on the basis of data from UNCTAD
mn $ 1994 1995 1996 1997 1998 1999 2000 2001 2002 2003 2004 World 259.469 341.086 392.922 487.878 701.124 1.092.052 1.396.539 825.925 716.128 632.599 648.146 Czech Republic 869 2.562 1.428 1.300 3.718 6.324 4.986 5.641 8.483 2.101 4.463 Estonia 215 202 151 267 581 305 387 542 284 891 926 Hungary 2.286 5.104 3.300 4.167 3.335 3.312 2.764 3.936 2.994 2.162 4.167 Latvia 214 180 382 521 357 347 413 132 254 300 647 Lithuania 31 73 152 355 926 486 379 446 732 179 773 Poland 1.875 3.659 4.498 4.908 6.365 7.270 9.343 5.714 4.131 4.123 6.159 Slovakia 273 258 370 231 707 428 1.925 1.584 4.094 669 1.122 Slovenia 117 151 174 334 216 107 136 370 1.686 337 516 Total 5.879 12.188 10.454 12.083 16.203 18.579 20.333 18.366 22.657 10.762 18.774 % Share 2,3 3,6 2,7 2,5 2,3 1,7 1,5 2,2 3,2 1,7 2,9
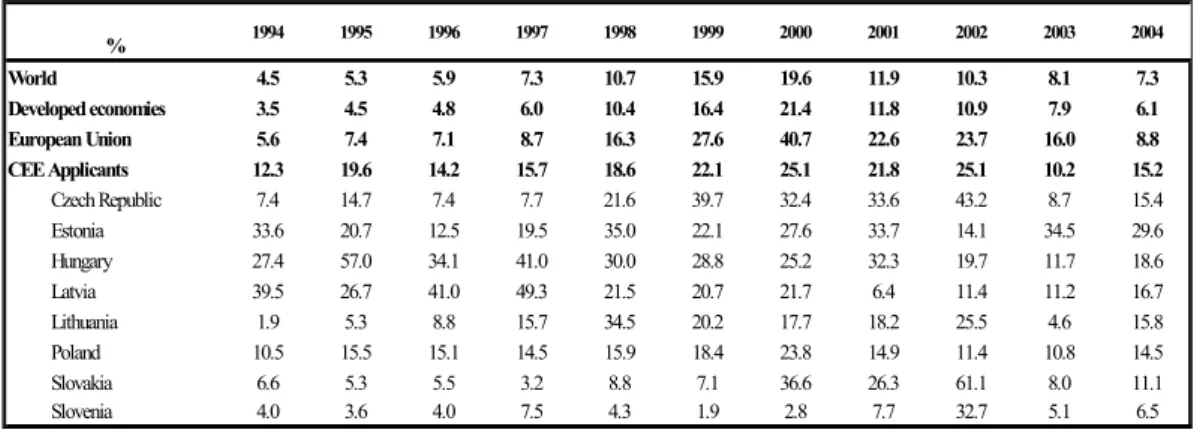
Regarding CEE countries, inflows of foreign capital were vital as they accelerated growth and development. The importance of FDI is obvious considering its proportion to total fixed capital formation. CEE applicants benefited from the impact of enlargement, since the announcement made by EU at Essen European Council in 1994, as this introduced more foreign capital inflow. Comparing with the world and developed economies, FDI comprises larger proportions of total investment for each year since 1994 for CEE accession countries. (Table 2)
Table 2: FDI inflows as percentage of Gross Fixed Capital
Source: UNCTAD % 1994 1995 1996 1997 1998 1999 2000 2001 2002 2003 2004 World 4.5 5.3 5.9 7.3 10.7 15.9 19.6 11.9 10.3 8.1 7.3 Developed economies 3.5 4.5 4.8 6.0 10.4 16.4 21.4 11.8 10.9 7.9 6.1 European Union 5.6 7.4 7.1 8.7 16.3 27.6 40.7 22.6 23.7 16.0 8.8 CEE Applicants 12.3 19.6 14.2 15.7 18.6 22.1 25.1 21.8 25.1 10.2 15.2 Czech Republic 7.4 14.7 7.4 7.7 21.6 39.7 32.4 33.6 43.2 8.7 15.4 Estonia 33.6 20.7 12.5 19.5 35.0 22.1 27.6 33.7 14.1 34.5 29.6 Hungary 27.4 57.0 34.1 41.0 30.0 28.8 25.2 32.3 19.7 11.7 18.6 Latvia 39.5 26.7 41.0 49.3 21.5 20.7 21.7 6.4 11.4 11.2 16.7 Lithuania 1.9 5.3 8.8 15.7 34.5 20.2 17.7 18.2 25.5 4.6 15.8 Poland 10.5 15.5 15.1 14.5 15.9 18.4 23.8 14.9 11.4 10.8 14.5 Slovakia 6.6 5.3 5.5 3.2 8.8 7.1 36.6 26.3 61.1 8.0 11.1 Slovenia 4.0 3.6 4.0 7.5 4.3 1.9 2.8 7.7 32.7 5.1 6.5
Barry (2002) emphasized that, much of the FDI flows into CEE have been “market seeking”, rather than reflecting an attempt to integrate the production of these transition economies into EU production networks. Holland et al (2000) conclude that home-market size and growth potential were driving forces behind CEE-bound FDI in the first decade of transition. According to a study carried out for the European Commission by Boeri and Brücker (2000), previously underdeveloped non-tradable sectors, such as utilities, transport and communications, trade, financial intermediation and other services attracted almost half of FDI flows in the transition economies. The main investment motive here is to supply domestic markets and exploit first-mover advantages in markets with limited or nonexistent competition.
The economic and political system of the CEE countries had been organized according to the system of socialism. From an economic point of view, accession to the EU means a transformation to implement market economy. Studying FDI statistics of CEE countries, it is evident that in the accession period most of the FDI flows were concentrated in Poland, the Czech Republic and Hungary. In Bevan and Estrin (2000), the impact of Essen announcement on FDI inflows to CEE countries is analyzed and they reach the conclusion that a significant increase of FDI was realized by especially Hungary, Czech Republic and Poland. The FDI performance of Hungary, Czech Republic and Poland stand out as they implement a successful privatization strategy and export oriented FDI policies. Holland and Pain (1998) examined in depth why Poland, Hungary and the Czech Republic have been more successful at attracting FDI than other neighboring countries. According to them, they are among the largest regional
economies and were the fastest to recover from the transitional recession. They state that as a result of liberalizing earlier, restructuring and stabilizing their economies and political systems faster, these three countries have afforded investors’ access to relatively large, fast growing and stable markets. Moreover, Holland and Pain (1998) pointed out that these countries were also among the first ones to begin membership negotiations with the EU. In this study they implied that the perception of not-so-distant EU membership helped to reduce the level of risk associated with these countries, relative to other countries in the region and this, too, has encouraged investment. As a conclusion they emphasized that the proximity to the EU membership and also privatization path helped them to draw FDI. Moreover, Zacharov and Kusic (2003) denoted that these countries display high FDI performance due to faster compliance with the two economic criteria -which are establishment of a well functioning market economy and capacity to withstand the competitive pressures and market forces within EU- for EU accession and can start the integration process earlier.
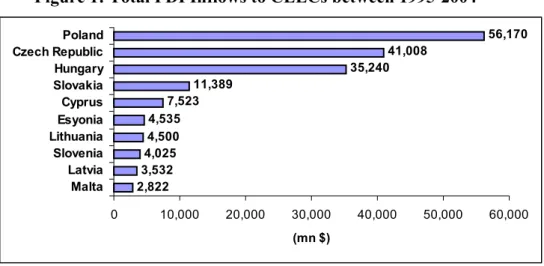
Figure 1: Total FDI Inflows to CEECs between 1995-2004
2,822 3,532 4,025 4,500 4,535 7,523 11,389 35,240 41,008 56,170 0 10,000 20,000 30,000 40,000 50,000 60,000 Malta Latvia Slovenia Lithuania Esyonia Cyprus Slovakia Hungary Czech Republic Poland (mn $) Source: UNCTAD
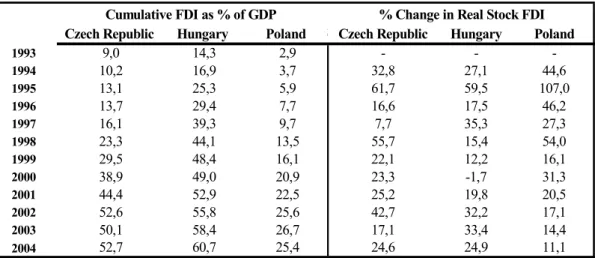
In order to see the real affect of FDI in these countries’ economies, the periods between 1994 and 2004 should be analyzed since the former can be seen as a milestone in the accession process while the latter is the year of accession to the EU. There is a rapid increase in the stock of FDI in Czech Republic, Hungary and Poland in this period of time. As shown in Table 3, in Czech Republic while the stock of FDI accounted for 9% of GDP in 1993, it reached to 52,7% of GDP in 2004. And also in Hungary there is an increase from 14,3% to 25,4%. A similar situation took place for Poland as the ratio raised from 2,9% to 25,4 %. These three countries received about 60 % of annual inflows to the region in 2004.
Table 3: Stock of FDI
Czech Republic Hungary Poland R Czech Republic n Hungary Poland
1993 9,0 14,3 2,9 - - -1994 10,2 16,9 3,7 32,8 27,1 44,6 1995 13,1 25,3 5,9 61,7 59,5 107,0 1996 13,7 29,4 7,7 16,6 17,5 46,2 1997 16,1 39,3 9,7 7,7 35,3 27,3 1998 23,3 44,1 13,5 55,7 15,4 54,0 1999 29,5 48,4 16,1 22,1 12,2 16,1 2000 38,9 49,0 20,9 23,3 -1,7 31,3 2001 44,4 52,9 22,5 25,2 19,8 20,5 2002 52,6 55,8 25,6 42,7 32,2 17,1 2003 50,1 58,4 26,7 17,1 33,4 14,4 2004 52,7 60,7 25,4 24,6 24,9 11,1
Cumulative FDI as % of GDP % Change in Real Stock FDI
Source: World Investment Report 2005,UNCTAD
In this time period, although there had been a significant amount of inward FDI to these countries, the amount of inflow fluctuated during the accession period. In 2002 while the overall FDI inflows to the candidate countries was $22,6 billion; it declined to $10,7 billion in 2003. In UNCTAD’s 2004 report it is implied that this was almost entirely due to the end of privatization in the Czech
Republic and Slovakia. In the rest of the other countries, the decline in FDI inflows was smaller (UNCTAD 2004).
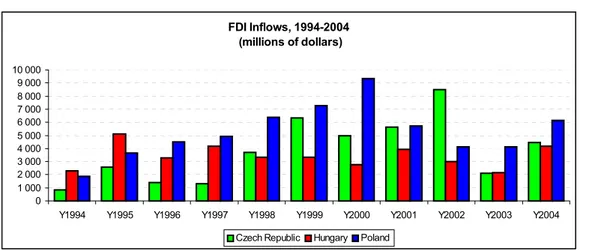
Figure 2: FDI Inflows, to Czech Republic, Hungary and Poland
t of EU-25 had also accelerated FDI inflows FDI Inflows, 1994-2004 (millions of dollars) 0 1 000 2 000 3 000 4 000 5 000 6 000 7 000 8 000 9 000 10 000
Y1994 Y1995 Y1996 Y1997 Y1998 Y1999 Y2000 Y2001 Y2002 Y2003 Y2004 Czech Republic Hungary Poland
Source: UNCTAD, World Investment Report 2005
It can be claimed that the prospec
from member states to candidate countries in the negotiation period. In an article executed by Lovino (2002), FDI transactions to candidate countries from 1996 to 2000 were investigated and it was stated that 87 % of FDI inflows to the candidate countries came from the EU member states in the year 2000. This is an important investigation since it proves that intra-EU FDI transactions had increased within this period. According to the level of concentration, the author implied that Poland, the Czech Republic and Hungary were the destinations for the majority of the total FDI.
2.2. European Union Accession Process, FDI and Turkey
Turkey’s formal relations with the EU date back to the 1963 Association Agreement and the country was the first of the current group of applicants to apply for EU membership back in 1987. For a variety of political and economic reasons, the request made little progress over the years, until the Helsinki Summit in December 1999. At that meeting, EU Governments formally recognized Turkey as a candidate country. On October 3rd 2005, membership negotiations were opened with Turkey. Right after the EU Accession Negotiations have been launched, Screening Process is started, which is expected to finalize within a year.
2.2.1. Turkey’s FDI Performance Over Time
The key objective of this section is to analyze Turkey’s performance in attracting FDI both over time and relative to CEE countries by making implications for EU accession process.
Despite her renowned economic potential and geographic advantages, Turkey has performed quite poor in attracting FDI. There are various reasons such as the domestic and regional unrest in politics, international embargos to potential trading neighbors, reluctance of the bureaucracy for facilitating FDI regulations, domestic and international economic crises, highly volatile currency and the uncertainty related to the fundamental revisions in the banking system. Although Turkey is a high potential country to attract FDI (as the largest economy in the region), it is a striking fact that the country has failed to attract expected levels of FDI.
In its World Investment Report (WIR) for 2004, UNCTAD provides three indicators that measure the performance of a country in attracting FDI. These are the transnationality index - a measure of relative economic importance of foreign affiliates in total economic activity - the FDI performance index and the FDI potential index. In 2001, Turkey ranked seventh from the bottom in the transnationality index of developing countries with Hong Kong having the first position; while in 2002, Turkey ranked sixth from the bottom among developing countries. UNCTAD provides a matrix based on the FDI performance and potential indices. For 1988–90, 1993–95 and 2000–02 periods, Turkey ranked among the under-performers.
Table 4: FDI Matrix
High
High FDI Performance Low FDI performance
FDI potential Front-runners Below potential
Low FDI potential Above potential Under-performers
It will not be an incorrect statement to imply that the history of FDI for Turkey starts in 1980, which is the year of liberalization. Up until 1980, the cumulative level of FDI had amounted to $228 million with an average annual inflow of $90 million (Erdal and Tatoğlu, 2002), which is a negligible amount.
In a study carried by Hadjit and Moxon-Browne (2005), an overview of FDI in Turkey took place. They summarize the FDI performance of Turkey with a special analysis of the economic and political environment. In this study it is stated that by January 1980, Turkish governments started to implement reform programs to open up the Turkish economy in the aim of establishing a free market, and an outward-oriented economy to integrate Turkey with world
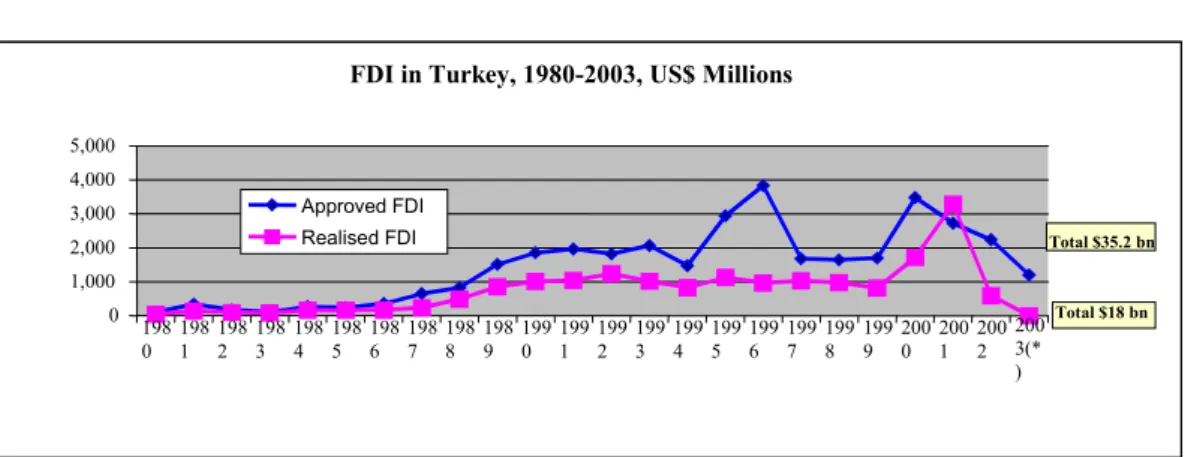
markets. In 1989, Turkey fully liberalized its capital account, which led to a significant increase on FDI flows. Despite this increase, Turkey was still attracting relatively low levels of FDI compared to countries of comparable size such as Argentina and Mexico (Balasubramanyam, 1996). Hadjit and Moxon-Browne (2005), gave some FDI figures for the years between 1980 and 1990. The authorized investment amounted to $6.4 billion in this period while the average value per year was $456.3 million in the same period according to data from General Directorate of Foreign Investment. According to them, the period of 1990s was thought to be crucial for Turkey as Customs Union (CU) with the EU came into force in January 1996. In this period it was a widespread belief that CU would stimulate flows of European FDI into Turkey because of the increased stability and competitiveness of the Turkish economy. However, the realization was totally different than the forecasts as the CU had a significant impact only on authorized investment between 1995 and 1997 whereas the realized FDI did not meet the expectations. Many investments, especially in the manufacturing sector, were announced but did not materialize. This was apparently an outcome of the difference between the optimism due to the CU membership and what happened in reality. It was clearly understood that CU is not enough to secure macro-economic stability and ensure FDI inflows. Moreover, the underdeveloped investment climate could not convert the investors’ positive perceptions into reality. Also, Loewendahl & Ertugal-Loewendahl (2001) analyzed this period in their study and mentioned that, during the 1990s when global FDI flows accelerated, FDI in Turkey remained static. According to them the most interesting finding is the 1995-1997 period that Turkey and EU formed a CU in
which the largest gap between the approved and realized investment occurred. They think that investors’ perceptions of the opportunities afforded by investing in Turkey did not meet the reality of the situation and most of the new investment was not realized which indicates that the government was unable to facilitate the large interest shown by inward investors into real investment. (Loewendahl, Ertugal-Loewendahl, 2001)
Figure 3: FDI in Turkey
December 1999 was another milestone for Turkey since the EU accepted Turkey
* As of June 2003 Source: Turkish Treasury
FDI in Turkey, 1980-2003, US$ Millions
0 1,000 2,000 3,000 4,000 5,000 198 0 1981 1982 1983 1984 51981986 1987 1988 1989 1990 11991992 1993 1994 1995 1996 1997 1998 1999 2000 2001 2002 200 3(* ) Total $18 bn Total $35.2 bn Approved FDI Realised FDI
as candidate member on this date. From then on, the image of Turkey in foreign investors’ mind turned out to be a potential location to invest, as Turkey had to meet economic, political and social criteria on her way to EU. However, this positive understanding changed when an economic crisis occurred in 2001, which caused a sharp downturn of Turkish economy. The country faced a severe banking crisis that led to the elaboration of a stabilization program supported by the International Monetary Fund (IMF). This crisis acted as a brake on FDI. The FDI stock between 1995 and June 2002 was $9 billion, but $3 billion of this amount was due to a large license fee paid by Telecom Italia to operate Aria and
HSBC’s purchase of Demirbank in 2001 (Hadjit and Browne, 2005). During this period Poland attracted $42 billion; Czech Republic attracted $26 billion and Hungary attracted $26 billion of FDI (UNCTAD, 2005).
Since 1990, Turkey has been able to attract one billion dollars of FDI on averag
.2.2 Competitor FDI Locations
Loewendahl and Ertugal-Loewendahl (2001), Turkey
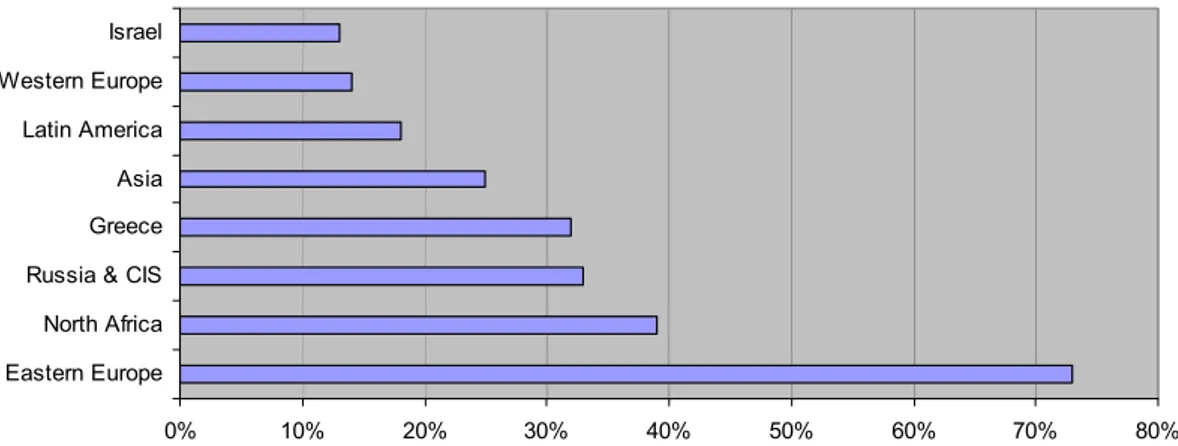
Figure 4: Turkey’s key competitors for FDI (% of respondents citing country)
Source: Loewendahl, H., and E. Loewendahl, 2001, “Turkey’s Performance In Attracting Foreign Direct Investment: Implications of EU Enlargement”
e per year while the estimated minimum annual FDI “attraction potential” according to the world investment report of 2002 is $35 billion.
2
In a research executed by
’s key competitors for FDI were examined. Although they have a different economic background from Turkey, the CEEC constitute fierce competition for Turkey in attracting FDI; the main competitors being Poland, the Czech Republic and Hungary. In this respect, they conducted interviews with 30 senior executives of multinational corporations and directed the question: “Which countries is
Turkey competing with as a location for FDI?” Below is the summary of results:
0% 10% 20% 30% 40% 50% 60% 70% 80%
Eastern Europe North Africa Russia & CIS Greece Asia Latin America Western Europe Israel
The figures show that Eastern Europe countries are by far the most cited competitors of Turkey in FDI attracting. The fact that North Africa and Russia & CIS regions follow as second and third; indicates that geographical location of a country is important for defining its competitors. Another common attribute of these countries is the similarity of their economic development levels. The study further states that Hungary, Poland and Czech Republic were the top countries cited as the main East European competitors to Turkey. It is interesting to note at Latin America and Asia were not considered as key competitors of Turkey. According to the results of the research, Lowendahl and Ertugal-Lowendahl suggested that MNCs actually segment the European market into West and East, most likely due to different levels of economic development (and also into North and South for activities such as call centers and shared service centers, due to geographical and cultural differences). These institutions also tend to adopt a regional division of labor within Europe. This is derived from the fact that CEECs and Turkey are competing for manufacturing activities and West European countries are competing for high tech manufacturing and knowledge intensive activities.
In this study henceforth, Hungary, Czech Republic and Poland together will be considered, admitted and called, as the “main competitors” of Turkey and all the comparisons and analyses will be done between these countries and Turkey.
Compared to its main competitors, Turkey attracted considerably low levels of FDI for the 1994–2004 period. Net FDI inflows to Turkey amounted to less than one percent of GDP except 2001; while within this period, the Czech th
Republ
e of GDP is significant since it represents the share of total FDI operati (%) Chezh 1995 0.5% 4.6% 11.4% 2.8% 1997 0.4% 2.3% 9.1% 3.3% 2000 0.5% 9.0% 5.9% 5.7% 2003 0.7% 2.3% 2.6% 2.0% Source: UNCTAD
ic and Hungary attracted noticeably higher amounts of FDI as percentage of GDP (Table 5). One of the other indicators in explaining FDI and its reflections to the country’s economy is the FDI instock data. To measure FDI instock as percentag
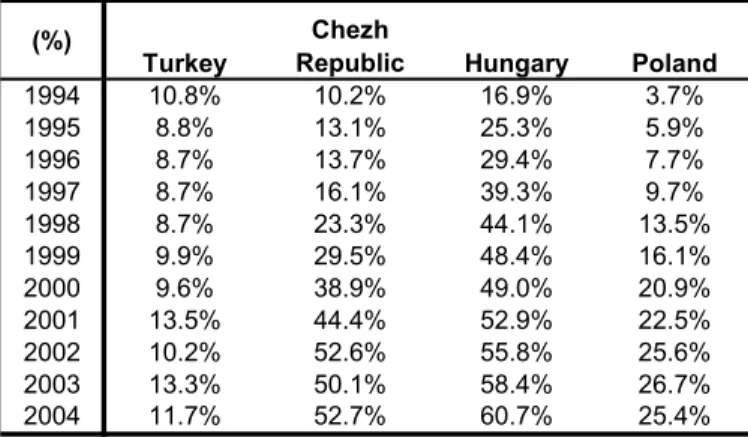
ng in a country’s economy cumulated up to date. In Turkey, inward FDI stock as percentage of GDP did not show significant increases from 1994 to 2004 while it increased from 10,2% to 52,7% in Czech Republic; 16,9% to 60,7% in Hungary and 3,7% to 25,4% in Poland (Table 6). Comparing with its main competitor countries, it can be concluded that Turkey has attracted low amounts of FDI and has not realized a progress during a decade from 1994 (year of the announcement for eastern enlargement), to 2004 (year of entry to EU).
Table 5: FDI Inflows as Percentage of GDP
Turkey Republic Hungary Poland
1994 0.5% 2.0% 5.5% 1.8% 1996 0.4% 2.3% 7.3% 3.0% 1998 0.5% 6.0% 7.1% 3.8% 1999 0.4% 10.6% 6.9% 4.5% 2001 2.2% 9.2% 7.6% 3.1% 2002 0.6% 11.5% 4.6% 2.2% 2004 0.9% 4.2% 4.2% 2.5%
Table 6: FDI Instock as Percentage of GDP
(%)
Turkey
Chezh
Republic Hungary Poland
1994 10.8% 10.2% 16.9% 3.7% 1995 8.8% 13.1% 25.3% 5.9% 1996 8.7% 13.7% 29.4% 7.7% 1997 8.7% 16.1% 39.3% 9.7% 1998 8.7% 23.3% 44.1% 13.5% 1999 9.9% 29.5% 48.4% 16.1% 2000 9.6% 38.9% 49.0% 20.9% 2001 13.5% 44.4% 52.9% 22.5% 2002 10.2% 52.6% 55.8% 25.6% 2003 13.3% 50.1% 58.4% 26.7%
2.2.3. FDI Flows and Trends to Turkey
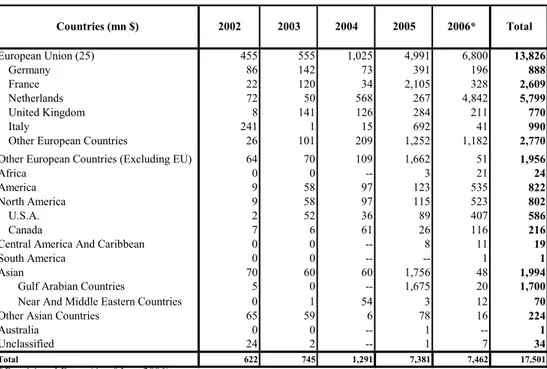
I, it stands out that EU countries stick out in dominating inward FDI to Turkey. For the 2002-2006 period, Netherlands, Germany and France, following USA, ere the major investors in Turkey in terms of approved investment.
Table 7: Breakdown of FDI Capital Inflow to Turkey by Countries Upon analyzing the main sources of FD
w m ch t y ttracted percent), 455 555 1,025 4,991 6,800 13,826 86 142 73 391 196 888 France 22 120 34 2,105 328 2,609 Netherl United K Italy 241 1 15 692 41 990 Other European Countries (Excluding EU) 64 70 109 1,662 51 1,956
North America 9 58 97 115 523 802
52 36 89 407 586
6 61 26 116 216
Central America And Caribbean 0 0 -- 8 11 19
outh America 0 0 -- -- 1 1
sian 70 60 60 1,756 48 1,994
Gulf Arabian Countries 5 0 -- 1,675 20 1,700
70 224 Australia 0 0 -- 1 -- 1 2002 2003 2004 Countries (mn $) ands 72 50 568 267 4,842 5,799 ingdom 8 141 126 284 211 770
Other European Countries 26 101 209 1,252 1,182 2,770
Africa 0 0 -- 3 21 24
America 9 58 97 123 535 822
U.S.A. 2
Canada 7
Source: Turkish Treasury
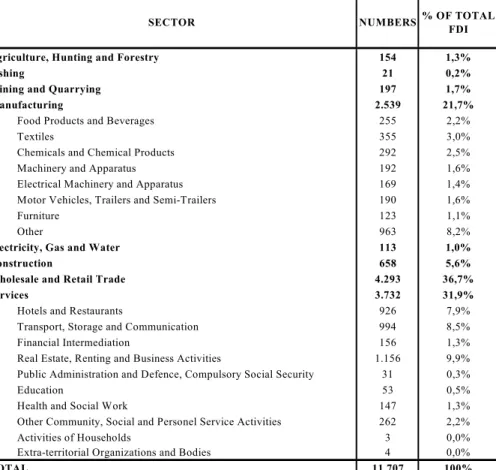
Table 8 shows the breakdown of FDI by sectors and sub-sectors. Manufacturing and services dominate FDI in Turkey and there has not been change in their share of total FDI over time. The distribution of FDI permi sector indicates that between 1954 and 2005, wholesale and retail sector a the biggest share, with 36.7 percent, followed by services (31.9
manufacturing (21.7 percent), mining (1.7 percent) and agriculture (1.3 percent).
Unclassified 24 2 -- 1 7 34
622 745 1,291 7,381 7,462 17,501 *Provisional Data (As of June 2006)
Total European Union (25) Germany 2006* Total 2005 S A
Near And Middle Eastern Countries 0 1 54 3 12
Other Asian Countries 65 59 6 78 16
u s b
Table 8: The Breakdown of FDI by Sectors (1954-2005)
Turkey since who chose he majority between the years does not
lishments during these years.
* As of October 2005, Provisional Data
Source: General Directorate of Foreign Investment
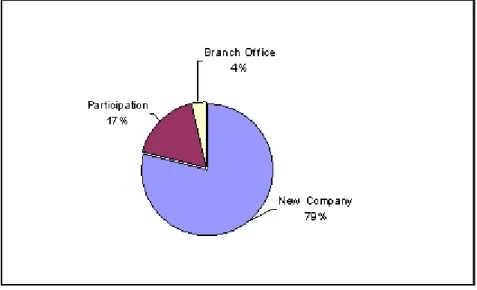
The total number of companies that have realized FDI in 1954 is 13,600. Regarding the forms of FDI, foreign capital companies to undertake greenfield investments in Turkey since 1954 have had t with 79%. In terms of the amount they invested, only the period
2000-2003 can be analyzed due to lack of data. Although this analysis
provide us a perfect benchmark, it is significant as it gives an understanding of the
Transport, Storage and Communication 994 8,5%
Financial Intermediation 156 1,3%
Real Estate, Renting and Business Activities 1.156 9,9% Public Administration and Defence, Compulsory Social Security 31 0,3%
Education 53 0,5%
Health and Social Work 147 1,3%
Other Community, Social and Personel Service Activities 262 2,2%
Activities of Households 3 0,0%
Extra-territorial Organizations and Bodies 4 0,0%
TOTAL 11.707 100%
SECTOR NUMBERS
FDI
Fishing 21 0,2%
Manufacturing 2.539 21,7%
Chemicals and Chemical Products 292 2,5%
Motor Vehicles, Trailers and Semi-Trailers 190 1,6%
Other 963 8,2%
lectricity, Gas and Water 113 1,0%
onstruction 658 5,6%
Wholesale and Retail Trade 4.293 36,7%
31,9% 7,9% % OF TOTAL
Agriculture, Hunting and Forestry 154 1,3%
Mining and Quarrying 197 1,7%
Food Products and Beverages 255 2,2%
Textiles 355 3,0%
Machinery and Apparatus 192 1,6%
Electrical Machinery and Apparatus 169 1,4%
Furniture 123 1,1%
E C
Services 3.732
Hotels and Restaurants 926
2.2.3. Reasons Behind Turkey’s Underperformance
From a historical perspective, Turkish economy has failed economic potential and faced several financial crises. For the last Figure 5: Mode of Establishment (Number of Companies), 1954-2006*
ource: Undersecretariat of Treasury
twenty years, * As of July
Source: Undersecretariat of Treasury
Figure 6: Mode of Establishment (mn $)
0 200 400 600 800 1,000 1,200 1,400 2000 2001 2002 2003 (mn $) New Capital Increse Participation Total S to realize its
the economy has been suffering from a high inflationary environment. (Yilmaz 003). Even though various governments have tried to apply policies to decrease e rate of inflation, it is still higher than all CEE countries and has been covering just since 2004. While it was 25% in 2003, it came down to 10% in 004, when Turkey performed better than Romania (as it was 11,9% in Romania). Table 9, Table 10) Moreover, Turkey’s external debt is mentioned as another Tosunoğlu (2005). They claim that Turkey’s xternal debts prevent a decrease in the real interest rates to the desired levels and etary deficit, which has a irect 2 th re 2 (
crucial problem by Başar and e
increase the country risk. They suggest that the budg
d effect on country risk, stems from inefficient tax collection, deficits in social security systems, insufficient privatization efforts, the problems of the public sector enterprises and undisciplined expenditures.
Table 9: Key Economic Indicators, 2003
(billion US$) Annual(%) Atlas Method* (US$) Total (mn US$) (%)
Check Republic 90,6 3,2 7.160 34.629 -0,1 Hungary 83,1 3,4 6.410 45.794 4,7 Lithunia 18,4 10,5 4.540 8.342 -1,1 Slovakia 32,7 4,5 4.970 18.378 8,4 Slovenia 27,7 2,7 11.870 11.512 5,7 Bulgaria 19,9 4,5 2.120 13.288 2,3 Romania 57,3 5,2 2.260 21.280 15,3
Source: World Development Indicators (2006), Eurostat
Countries
GDP GDP Growth GNI Per Capita, External Debt Inflation
Estonia 9,2 6,7 5.480 6.972 1,4 Latvia 11,1 7,2 4.380 8.802 2,9 Poland 209,8 3,8 5.270 95.219 0,7 Turkey 240,4 5,8 2.800 145.662 25,3 Crotia 28,8 4,3 5.380 23.451 .. 2003
Table 10: Key Economic Indicators, 2004
Turkey’s failure to attract FDI has both economic and non-economic auses (FIAS, 2001a; FIAS, 2001b). ). Erdilek (2003) focuses on these causes and entions: high transactions costs of entry and operation for foreign investors (due excessive bureaucracy and red tape, and widespread corruption), lack of
nfrastructure. t t lead conflicts politica of FD -owned and controlled and closed to foreign takeovers). (Erdilek, 2003)
GDP (billion US$)
GDP Growth Annual(%)
GNI Per Capita, Atlas Method (US$) External Debt Total (mn US$) Inflation (%) Check Republic 107,0 4,7 9.130 45.561 2,6 Estonia 11,2 7,8 7.080 10.008 3 Hungary 100,7 5,2 8.370 63.159 6,8 Latvia 13,6 8,5 5.580 12.661 6,2 Lithunia 22,3 7,0 5.740 9.475 1,2 Poland 242,3 5,3 6.100 99.190 3,6 Slovakia 41,1 5,5 6.480 22.068 7,5 Slovenia 32,2 4,2 14.770 3,7 Turkey 302,8 8,9 3.750 161.595 10,1 Bulgaria 24,1 5,6 2.750 15.661 6,1 Crotia 34,3 3,8 6.820 31.548 .. Romania 73,2 8,4 2.960 30.034 11,9
Source: World Development Indicators (2006), Eurostat
Countries 2004 c m to inward protection of intellectual property rights, failure of privatization,
orientation until 1980, insufficient legal structure and inadequate i According to him there are also non-economic factors peculiar to Turkey to attract low FDI such as chronic political instability for years, internal historical animosity towards foreign economic presence, fear of foreign domination within the civilian and the military bureaucracy, lack promotion, and the structure of Turkish business (mostly family
ha , l I
In 2001, Foreign Investment Agency Service (FIAS) of World Bank carried out a study to present an analysis of the FDI environment in Turkey. They implemented some interviews with potential investors and asked them to grade
major obstacles to FDI in Turkey. In Hadjit and Browne (2005), these results are presented. Those investors declared that, up until early 2000s, they were confronted by economic and political instability, government bureaucracy, a weak judicial system, taxation, corruption, deficient infrastructure and the informal economy while investing. (Figure 7)
Figure 7: Major obstacles of FDI in Turkey
Source: Hadjit, A., E. Mexon-Browne, 2005, “Foreign Direct Investment in Turkey: The dy
the Turkish Market
There are numerous studies about FDI story of Turkey. Although it is a widely discussed topic from different perspectives, almost all studies compromise on the consensus that despite its advantages, Turkey is performing far below its potential in attracting FDI. This statement is more than a hypothesis hence the
Implications of EU Accession” from FIAS stu
potentiality issue can be supported with the realities of Turkey’s economic and social structure.
In a working paper executed by TÜSİAD for the Investors Advisory Council Meeting (2004), Turkey was denoted as a potentially appealing country for foreign investors. As one of the advantages, the study mentions that Turkey has a huge domestic market and is among the biggest emerging markets with a unique location at the crossroads between East and West, overlapping Europe and Asia geographically. Moreover, the importance of the proximity to the new merging markets in Middle East and Central Asia is emphasized in the sense that for foreign investors by providing an pportunity to develop business with these countries as well. Another opportunity rgy sources. Althou
when compared with its competitors. Moreover, “the potential active
e
it creates unique business opportunities o
well worth to mention about Turkey is its location as a gateway of ene
gh it depends on the type of business; production and distribution facilities stand out as main concerns while investing in a region. In this regard the study highlights that Turkey, at the gateway of Middle East and Caspian petroleum and Central Asian natural gas to the west, appears to be a good choice for investing. Besides, communication and transportation infrastructures are considered as highly supportive
labor force” of Turkey is concerned as a demographic opportunity with stabilized population growth, increasing households and labor supply; improving welfare and per capita income.
As already mentioned in the “Determinants of FDI” chapter of this study, economic structure of a country is the most underlying factor that affects FDI. In a study published by Başar and Tosunoğlu (2005), it is stated that Turkey has many
advantages compared to other CEE countries in respect of GDP and GDP growth rates. GDP figures are important, since they are accepted as the indicators of market size. Likewise, they affirm that Turkey has many other advantages, being located in a strategic location, having an educated and qualified work force, communication and other infrastructures that are compulsory to meet the needs of investors and lower cost of labor.
Despite all these advantages, for several years, Turkey has experienced lower levels of FDI in comparison not only to its main competitors but also its potentiality. As already mentioned, one of the major aims of this study is to explain the FDI performance of Turkey in comparison to its main competitors, with a specific focus on 1994-2004 period, as it is the negotiation period with EU. Therefore it becomes significant to understand the economic and social structure and the investment environment of Turkey within this period. There were econom
as come down to historic lows; six zeroes have been d
ic and political challenges that Turkey has undergone such as three economic and financial crises linked to political problems in the recent past. But so far, Turkey has recovered relatively well from the most recent 2001 crisis. In 2002, Turkey recovered quite well with a GDP increase of 7.8%, compared to previous year’s -9.5%. (Huges, 2004) In 2003, growth was 4.8% and it increased to 8.9% in 2004. (Table 9 and Table 10)
In a Deutsche Bank Research (2005), it is discussed that since the 2001 economic crisis, economic reform programs in force have yielded tangible results: conventionally high inflation rate h
ropped from the Turkish Lira; financial sector supervision has been strengthened; more than half of the privatization revenues have been secured in
this period and the FDI stock has increased significantly. All these positive developments contribute to the perception of higher economic stability in the country.
In a working document prepared by Commission of European Communities (2004), it is denoted that the perspective of EU membership triggered substantial FDI from EU companies into the ten new Member States, which joined the EU in May 2004. Therefore, it can be defended that EU prospect for Turkey is set to underwrite substantial increase in terms of FDI. The EU membership will bring Turkey the access to large EU market, increased growth prospects and access to structural funds. Hadjit and Moxon-Brrowne (2005) indicate that the opening up of negotiations might boost investors’ confidence by removi
Figure 8: FDI Net Inflows to Turkey
*As of July 2006
ng uncertainty in political and economic stability. In fact, the EU membership and even the membership process itself produce substantial positive effects for the economies of the member and candidate countries.