Adaptation of Motivation and Self-Regulation Towards
Technology Learning Scale (MSRTL) to Turkish: Validity and
Reliability Study
Ali Rıza Şekerci*
Makale Geliş Tarihi:04/04/2017 Makale Kabul Tarihi:29/11/2017 Abstract
This study was carried out in order to adapt “The Motivation and Self-regulation towards Technology Learning (MSRTL) scale which was developed by Liou and Kuo (2014). One thousand three hundred and ninety-four students including 759 girls and 635 boys participated in the study. Exploratory and confirmatory factor analysis, dependent t-test and Pearson correlation analysis were performed during the data-analysis. As a result, the reliability and validity studies of the Turkish version of MSRTL which was developed by Liou and Kuo (2014) and consisted of seven factors and 39 items were conducted. It was stated that the seven factors, 37 items version of the scale was valid and reliable and it can be used in Turkey in the cultural aspect. The internal consistency coefficient which was calculated for each factor on the scale and varied between .76 and .84 was an important result in terms of the scale’s reliability.
Keywords: Motivation towards technology learning, self-regulation towards technology, 8th grade
Teknoloji Öğrenimine Karşı Motivasyon ve Öz-düzenleme
Ölçeği’nin (TÖMÖD) Türkçe’ye Uyarlanması: Geçerlik ve
Güvenirlik Çalışması
ÖzBu çalışma, Liou ve Kuo (2014) tarafından geliştirilen “Teknoloji Öğrenimine Karşı Motivasyon ve Öz-düzenleme (TÖMÖD)” ölçeği’nin Türkçe’ye uyarlanması amacıyla gerçekleştirilmiştir. Çalışmaya 1394 öğrenci (759 kız ve 635 erkek) katılmıştır. Verilerin analizinde açımlayıcı ve doğrulayıcı faktör analizi, bağımlı t-testi ve pearson korelasyon analizi yapılmıştır. Sonuç olarak Liou ve Kuo (2014) tarafından yedi faktör 39 madde olarak geliştirilen “TÖMÖD” ün Türkçe’ye uyarlanarak geçerlik ve güvenirlik çalışması yapılmış, ölçeğin yedi faktör 37 maddelik halinin kültürel açıdan Türkiye’de kullanılabilecek geçerli ve güvenilir bir ölçek olduğu belirlenmiştir. AFA analizi sonucu ölçeğin toplam varyansın %57.66’sını açıkladığını göstermiştir. Ölçekteki her bir faktör için hesaplanan ve .76 ile.84 aralığında değişen iç tutarlılık katsayıları ölçeğin güvenilir olduğunu göstermesi açısından önemli sonuçlardır.
Bayburt Eğitim Fakültesi Dergisi, Yıl: 2017 Cilt: 12 Sayı: 24 Introduction
Science and technology have vital importance in the development of the society and for the individuals to overcome the difficulties that they may face both today and in the future. For example, technology aims to help the individuals who constitute the society to continue their lives and to become more comfortable throughout their lives (American Association for the Advancement of Science [AAAS], 1993; National Research Council [NRC], 1996). In this respect, most of the countries are engaged in the development of the students’ technology literacy within the curriculum in order to ensure the necessary knowledge and skills to the students (Alamin, Shaoqing, & Le, 2015; CEO Forum on Education and Technology, 2001). The schools and other educational institutes which assumed the responsibility to educate individuals required by the society are expected to raise individuals equipped with knowledge and skills (who can access, use, transmit and produce information) who are able to use technology can learn by itself (has learned to learn). Technology has been started to be used in the conduct of educational activities as an important part of our daily life. At this point, the educational activities which are carried out in schools are expected to motivate the students positively in using and learning technology and to help them to gain self-regulation skills on the subject. If the students do not gain positive motivation and self-regulation skills in relation to technology they will demonstrate less interest in fields like science, technology, engineering and mathematic which are considered as the foundation of economic development (Liou & Kuo, 2014). The conducted studies suggested that the students who had high motivation, self-regulation and self-sufficiency revealed high-level academic success (Chularut & DeBacker, 2004; Liou & Kuo, 2014; Multon, Brown, & Lent, 1991; Schunk, 1989; Schunk & Swartz, 1993; Velayutham, Aldridge, & Fraser, 2012).
Self- Regulation
The concept of self-regulation has begun to be investigated widely in the 1980’s in the United States in social psychology and personality magazines and in the 1990’s throughout Europe in journals related to education, organization and clinical and health psychology (Boekaerts, Pintrich, & Zeidner, 2000). Self-regulation means that the individual is active behaviourally, mentally and motivationally during its own learning process (Bandura, 1991; Zimmerman, 1989). According to Zimmerman (1998), self-regulation is self-generated thoughts, feelings, and actions for reaching academic goals. Schunk and Zimmerman (2008) determined self-regulation as the skill to control the individual’s behavior in order to achieve a specified purpose. According to Pintrich (2000) self-regulation is an effective, constructive process in which first the goals are set in learning then the cognition, behavior and motivation which are guided by these goals should be attempted to control, adjust and monitor. Self-regulation consists of cognitive, affective, motivational and behavioral components (Zeidner, Boekaerts, & Pintrich, 2000). Puustinen and Pulkkinen (2001) emphasized that the behavioral, cognitive and motivational components have an effective role in the learning process of the students. The students self-regulating their
learnings can participate actively in the learning process and as the result of this, the students are able to regulate their own thoughts, emotions and their behaviors which affect both the learning and motivation in a positive way (Boekaerts & Corno, 2005). Also during this process, the differences in the students’ motivations and achievements can be explained (Zimmerman & Pons, 1990).
Motivation
Motivation is defined as a wide structure which contains all the internal and external conditions affecting the control, maintenance and waking up of the behavior (Martin & Briggs, 1986). Keller (1983) defined motivation as the effort or the degree of work made in order to achieve the goals or to avoid something depending on the importance and control of the people’s behavior. Motivation is one of the most important resources determining the direction, severity, and stability of the students’ behavior (Öncü, 2006). Motivation is a multidimensional structure rather than a simple structure. People not only have different amounts of motivation but also they have different types of it (Ryan & Deci, 2000). Motivation remains as the heart of the classroom practice (Pintrich & Schunk, 1996). The self-efficacy, learning value perceptions, learning strategy use, the orientation to the learning objectives and the learning environment perceptions which constitute the students’ motivation are the most important factors motivating their learnings and affecting their learning performances (Pintrich, Marx, & Boyle, 1993; Stolk & Harari, 2014).
Self-efficacy is defined by Bandura (1977, 1982) as personal judgments of her capability to organize and execute actions in specific situations that may contain novel, unforeseeable, and possibly stressful characteristics. Also, it is defined as a “belief in one’s capabilities to organize and execute the courses of action required to manage prospective situations” (Bandura, 1995). Bandura (1997) stated that it is the key to the successful regulation of learning goals and strategies. Self-efficacy is an important variable in understanding the students' achievements, behaviors in educational practices (Schunk, 1984, 1989). According to Al-Alwan (2008), high achieving college students have significantly higher self-efficacy. Self-efficacy bridges between goal orientation, and motivation (Schunk, 1991).
Learning value is dedicated to as task value is defined a belief which refers to learners’ willingness and interest in engaging in learning task (Liou & Kuo, 2014). According to Atkinson (1966), it is one of the principal factors in determining a student’s achievement. Students who task value are encouraged to be engaged in different tasks (Eccles, Wigfield, Harold, & Blumenfeld, 1993; Wigfield & Eccles, 1992; Wigfield et al., 1997). There is a positive correlation between the perceptions of self-efficacy and learning/task value (Bong, 2004).
The learning goal orientation concentrates on developing student’s ability by acquiring new skills, mastering new situations, and learning from experience (VandeWalle, 1997). According to Meece (2003), it is defined as a wish for improving
Bayburt Eğitim Fakültesi Dergisi, Yıl: 2017 Cilt: 12 Sayı: 24
student’s competence, master a skill and understand learning material. In addition to learning goal orientation appraised the process of learning for students’ own virtues (Zimmerman, 2002). Learning goal orientation was positively related to between self-regulated learning and self-efficacy (Malpass, O'Neil, & Hocevar, 1999). The orientation towards the learning objects is a model formed by some behavioral goals which determine the students’ approaches and busyness during the learning activities (Meece, Blumfield, & Hoyle, 1998).
The learning strategy is the approach to overcome a task. More thoroughly, the learning strategy is the individual way to use and organize specific skills in order to learn the content of the concept and to succeed effectively and efficiently not only in the school duties but also in the duties outside the school (Schumaker & Deshler, 1992). The learning strategy is the method preferred individually during the learning process of the individual. In other words, learning strategy is a series of methods used to perform learning literally. (Schmecher,1988). The regulation learning is a self-starting action including cases such as determining the goals, regulating the people’s efforts in order to achieve the goals, self-monitoring, time management and the regulation of the physical and social environment (Zimmerman & Risemberg, 1997). Self-regulation learning strategy is meant to be the acts which are managed in accordance with the acquired knowledge and skills including the student’s aims and perceptions (Zimmerman & Pons, 1986).
In recent years, scales were developed for the students’ motivation towards the science education (Tuan, Chin, & Shieh, 2005) and for the orientation of science education (Velayutham, Aldridge, & Fraser, 2011) and the scales towards the motivation of science education were adapted to Greek (Dermitzaki, Stavroussi, Vavougios, & Kotsis, 2012) and to Turkish (Yılmaz & Huyugüzel-Cavaş, 2007). The scale for the orientation of science education was also adapted to Turkish (Tosun & Şekerci, 2015). When the field literature was examined, it was found out that a scale was developed by Liou and Kuo (2014) in order to measure the students’ motivation and self-regulation towards the technology. However, the adaptation of this scale into a different language and cultural group has not been seen yet. The adaptation of this scale which serves with its every aspect the determination of the student’s motivation and self-regulation into different languages and culture groups especially into Turkish will ensure the scale for motivation and self-regulation towards the technology to be brought to the literature. In this context, the aim of this study was to make the Turkish adaptation of the “Motivation and Self-Regulation Towards Technology Learning” scale which was developed by Liou and Tao (2014).
Method Sample of the Study
The sample of the study consists of seven hundred and fifty-nine girls (54.4%) and six hundred thirty-five (45.6%) boys who were attending 8th-grade classes at a public school in three different provinces of Turkey (Kütahya, Adana, and Trabzon). The age of the students varied between 13 and 16 (M = 14.3, SD = .514).
Instrument
The English form of “The motivation and self-regulation towards technology learning (MSRTL) scale developed by Liou and Tao (2014) was used as instrument which consisted of seven sub-dimensions and 39 items. The sub-dimensions were the followings: technology learning self-efficacy, technology learning value, technology active learning strategies, technology learning environment stimulation, technology learning goal-orientation, technology learning self-regulation-triggering, and technology learning self-regulation-implementing. It was developed by benefitting from the ”Students’ Motivation Toward Science Learning (SMTSL)” scale developed by Tuan, Chin, and Shieh (2005) and from the “Students’ Adaptive Learning Engagement in Science (SALES) developed by Velayutham, Aldridge, and Fraser (2011). The scale’s substances were prepared in five-point Likert-type. The following participating degrees could be given as the answers to the items of the scale: each substance under this sub-dimension was placed on a five-degree scale rating from (1) I fully disagree towards (5) I totally agree. All the substances included in the scale had positive sentence structure. The original scale was applied in Taiwan to one thousand eight hundred and twenty-two (802 girls, 1020 boys) students attending 10th grade at three different high schools. The Cronbach’s alpha coefficient calculated for ‘technology learning self-efficacy’ is. 91, for ‘technology learning value’ it is. 88, for ‘technology active learning strategies’ it is. 90, for ‘technology learning environment stimulation’ it is. 83, for ‘technology learning goal-orientation’ it is. 91, for ‘technology learning self-regulation-triggering’ it is. 86, and for ‘technology learning self-regulation-implementing’ it is. 89.
Application
The permission of the scale’s developers was asked before starting the adaptation into Turkish and after the adaptation of the scale. After the permission was obtained, the substances of the scale were translated into Turkish by the researchers differently from each other. Then the compliance between the translations of the researchers was examined. A joint decision was taken among the different translations. The rating system form developed by Baloğlu (2005) was used in order to determine in what extent the English-Turkish harmony of the phases which were translated into Turkish met the original substances. According to this system, the English experts gave (0) point when they thought that the Turkish translation did not meet the original one, or they when they thought that it fully met the original one they gave (10) points. 13
Bayburt Eğitim Fakültesi Dergisi, Yıl: 2017 Cilt: 12 Sayı: 24
persons with fluent Turkish and English who were also experts in the field of educational technology were asked to fill this form on a paper. Additionally, a Turkish understandability rating form (Baloğlu, 2005) was applied to 8 Turkish language experts in order to determine the compliance of the scale substances with the rules of the Turkish language. Adjustments were made in the Turkish translation by considering the opinions of the experts. Finally, first the English form of the scale, and then 5 weeks later the Turkish from of the scale were applied to 48 bilingual student groups attending 8th grade and the degree of consistency between the two forms was investigated. 48 bilingual students were randomly selected. Exploratory factor analysis was carried out with the data obtained from one thousand seventy-three students and confirmatory factor analysis was performed to the data obtained from three hundred and twenty-one students in order to obtain ideas about the multi-dimensional nature of the scale and about the psychometric features. Cronbach’s alpha was calculated by performing substance analysis to the data obtained from one thousand three hundred and ninety-four students.
Data Analysis
In order to analyze the data, SPSS 21 software was used for the exploratory factor analysis (EFA) and for the reliability and validity studies, while for the confirmatory factor analysis (CFA) the AMOS 21 (Arbuckle, 2012) statistical software was used. The maximum likelihood estimation was used during the first level confirmatory factor analysis and some goodness-of fit statistics were considered in the evaluation of the model. Accordingly, the compliance indexes of the chi-square (χ2), the freedom ratio of the chi-square (χ2 / SD), goodness of fit index (GFI), adjusted goodness of fit index (AGFI), comparative fit index (CFI), root mean square error of approximation (RMSEA), root mean square residual (RMR) and standardized root mean square residuals (SRMR) were used in the evaluation of the model. The fact that the chi-square was close to 0 and that it was statistically significant (p > .05) and that the (χ2 / SD) ratio was less than three suggested a good compliance (Kline, 2011). If the values of the GFI, AGFI, and CFI ratios vary between 0 and 1 and the values above .90 suggest also good compliance. Again .05 and lower values points to good compliance for RMSEA, RMR and SRMR which vary between 0 and 1., .05 and lower values suggest good compliance, .08 and values close to this suggest acceptable compliance while the values above .10 suggest bad compliance (Browne & Cudeck, 1989; Byrne, 2010; Hu & Bentler, 1999). Paired-samples t-test was used for the analysis of the data of the 48 students to whom both the English and the Turkish versions were applied. The correlations between the scale’s substances were investigated by the Pearson Correlation analysis by adopting the significance level of .01.
Results Structure, Concept and Language Equality
The opinions of 13 language experts were asked in order to determine the degree of the scale substances’ English-Turkish compliance. It was given in Table 1 that compliance level of the translated scale substances with the original English substances varied between 8.08 and 9.85 and the average of all substances was observed to be 9.07 (SD = .87). Also shown in Table 1, there are skewness and kurtosis values of the means, which do not indicate any deviation from normality.
Table 1.
English-Turkish Conformity Mean and Standard Deviation Scores
Item Mean Standard
Deviation Item Mean
Standard Deviation 1 8.69 1.84 21 9.15 1.21 2 8.54 2.02 22 9.00 1.53 3 9.85 .37 23 8.61 1.85 4 9.00 1.68 24 8.53 2.02 5 9.00 2.48 25 9.69 .48 6 8.69 2.46 26 9.38 .77 7 8.08 2.53 27 8.84 1.91 8 9.46 .77 28 8.24 3.11 9 9.38 .76 29 8.24 2.24 10 8.85 1.52 30 8.85 1.82 11 9.07 1.70 31 9.15 1.52 12 9.31 1.18 32 9.38 1.19 13 8.46 1.39 33 9.38 1.39 14 8.85 1.21 34 9.46 .77 15 9.15 1.14 35 9.54 .88 16 9.54 .52 36 9.61 .87 17 9.54 .87 37 9.08 1.55 18 9.31 .95 38 8.92 2.18 19 9.08 1.55 39 9.54 .78 20 9.15 1.34
Skewness -1.085 Std.error .616 z-value -1.76 Kurtosis .288 Std.error 1.191 z-value .24
The faculty members of Turkish Language and Literature and the Turkish teachers graded the compliance of the translations of the scale substances in terms of language rules. When looking at Table 2, it could be seen that the Turkish comprehensibility
Bayburt Eğitim Fakültesi Dergisi, Yıl: 2017 Cilt: 12 Sayı: 24
degrees of the scale substances varied between 7.12 and 10.0 and the average of all substances were 9.26 (SD = .45). Also shown in Table 2 are skewness and kurtosis values of the means, which do not indicate any deviation from normality.
Table 2.
Turkish Language Conformity Mean and Standard Deviation Scores
Item Mean Standard
Deviation
Item Mean Standard
Deviation 1 8.12 2.95 21 9.75 .46 2 7.12 3.18 22 9.87 .35 3 9.62 .74 23 9.87 .35 4 7.87 3.40 24 9.62 .74 5 8.50 2.27 25 7.50 2.56 6 9.12 1.25 26 9.62 .74 7 9.37 1.18 27 9.62 .74 8 9.37 .92 28 9.87 .35 9 8.00 2.14 29 9.50 1.07 10 9.12 1.12 30 8.85 1.82 11 8.87 1.12 31 9.75 .46 12 9.50 .75 32 9.87 .35 13 9.37 1.06 33 8.62 1.68 14 9.62 .74 34 9.00 1.92 15 8.75 2.55 35 9.75 .46 16 9.62 1.06 36 9.62 .52 17 10.00 .00 37 9.87 .35 18 8.50 2.27 38 9.75 .46 19 10.00 .00 39 9.87 .35 20 9.62 .74
Skewness -.01 Std.error .752 z-value -.01
Kurtosis .634 Std.error 1.481 z-value .42
Also, it was determined whether the statements in the scales Turkish and English versions meant the same. For this purpose the students filled first the English version then 5 weeks later the Turkish version was filled. The results of the paired-samples t-test related to this stage in which a total of 48 eighth grade students participated were given in Table 3.
Table 3.
Paired Samples t-test Results (N = 48)
Item t p Item t p 1 -3.51 .00* 21 .09 .93 2 -.53 .60 22 1.19 .24 3 -1.54 .13 23 1.17 .25 4 -1.14 .26 24 1.21 .23 5 .93 .36 25 .56 .58 6 -.87 .39 26 .10 .92 7 -1.50 .14 27 1.75 .09 8 -.76 .49 28 -.50 .62 9 -1.30 .20 29 2.85 .00* 10 -.39 .67 30 .47 .64 11 .52 .60 31 .80 .43 12 .12 .90 32 -.60 .55 13 .35 .73 33 .67 .51 14 -.08 .93 34 -.79 .43 15 -.82 .42 35 .49 .62 16 .28 .78 36 -.72 .47 17 1.23 .22 37 .49 .63 18 -.09 .93 38 .40 .69 19 .93 .36 39 1.17 .25 20 .79 .43 *p < .01
The results of the analysis showed that the results of both forms were matching at a high level and the differences between the points of the two scales were not significant to expect the 1st and 29th items. This can be interpreted as in this case the students understand the same from both the English and also from the Turkish version. The Psychometric Features of the Scale
Exploratory factor analysis
Exploratory Factor Analysis was applied in order to determine the structural validity of the motivation and self-regulation scale. Thus the correlation matrix between all the substances was examined. KMO (Kaiser-Meyer-Olkin) coefficient and the “Bartlett Sphericity” tests were performed in order to determine the data’s compatibility to the factor analysis. For the data’s compatibility to the factor analysis, KMO should be above .50 while the Bartlett Sphericity test should be significant (Çokluk, Şekercioğlu, & Büyüköztürk, 2012; Field, 2013; Kaiser, 1974). In this study,
Bayburt Eğitim Fakültesi Dergisi, Yıl: 2017 Cilt: 12 Sayı: 24
the KMO for the thirty-seven substances were found to be .966, while the χ2 value of the Bartlett Sphericity test was found to be 17705.374 (p = .000).
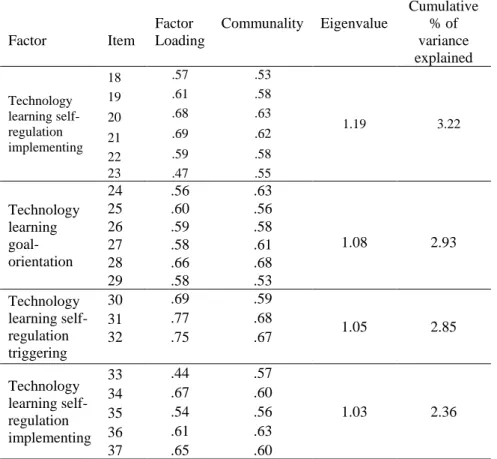
Then the EFA varimax rotation was applied. As a result of this process, a seven-factor and 37 items scale were obtained. The scale tool which consisted of seven factors and 37 items explained the 57.66% of the total variance and it was observed that items included within the sub-factors matched with the items included in the original version. The fact that 57.66% of the scale was explained is considered to be sufficient because an acceptable variance ratio should be between 40% and 60% (Tavşancıl, 2014). The information related to the factor loads of the scale and to the explained variance ratios were presented in Table 4.
Table 4.
Principal Component Analysis of The MSRTL Instrument with Varimax Rotation (N=1073)
Factor Item Factor Loading
Communality Eigenvalue Cumulative % of variance explained Technology learning self-efficacy 1 .70 .67 13.34 36.07 2 .79 .74 3 .73 .67 4 .50 .53 Technology learning value 5 .58 .55 2.52 6.80 6 .66 .60 7 .71 .62 8 .65 .57 9 .49 .46 Technology active learning strategies 10 .46 .52 1.27 3.43 11 .58 .48 12 .58 .49 13 .63 .51 14 .63 .56 15 .59 .55 16 .45 .43 17 .51 .40
Table 4. Continued
Principal Component Analysis of The MSRTL Instrument with Varimax Rotation (N=1073) Factor Item Factor Loading Communality Eigenvalue Cumulative % of variance explained Technology learning self-regulation implementing 18 .57 .53 1.19 3.22 19 .61 .58 20 .68 .63 21 .69 .62 22 .59 .58 23 .47 .55 Technology learning goal-orientation 24 .56 .63 1.08 2.93 25 .60 .56 26 .59 .58 27 .58 .61 28 .66 .68 29 .58 .53 Technology learning self-regulation triggering 30 .69 .59 1.05 2.85 31 .77 .68 32 .75 .67 Technology learning self-regulation implementing 33 .44 .57 1.03 2.36 34 .67 .60 35 .54 .56 36 .61 .63 37 .65 .60
The first of the sub-dimensions obtained by EFA was the technology learning self-efficacy. This sub-dimension which consisted of four items describes 36.07% of the total variances and its factor loads vary between .50 and .79. The second sub-dimension called as technology learning value consists of five items and explains 6.80% of the variance and its factor loads vary between .49 and .71. The technology active learning strategies which are the third sub-dimension consists of eight items, explains 3.43% of the variance and its factor loads vary between .45 and .63. The fourth sub-dimension called as the technology learning environment stimulation consists of six items and describes 3.22% of the variance and its factor loads vary between .47 and .69. Technology learning goal-orientation which is the fifth sub-dimension consists of six items and explains 2.93% of the variance, its factor loads vary between .56 and .66. The dimension of technology learning self-regulation-triggering consists of three items, describes 2.85% of the variance and its factor loads vary between .69 and .77. The last sub-dimension is technology learning
self-Bayburt Eğitim Fakültesi Dergisi, Yıl: 2017 Cilt: 12 Sayı: 24
regulation-implementing, it consists of five items and explains 2.36% of the variance and its factor loads vary between .44 and .67.
Confirmatory factor analysis
The confirmatory factor analysis is intended to tests whether a structure which was created before is verified or not. CFA is usually used to describe the relationship patterns among a variety of latent structures (Bayram, 2010; Byrne, 2010; Kline, 2011). Confirmatory test analysis was performed to the Turkish version of the scale with the AMOS statistical software and it was tested whether the seven dimensions of the data obtained from three hundred and twenty-one students was verified or not. At the end of the analysis, the relationships among the factors and the values of the indexes were given in Figure 1.
Bayburt Eğitim Fakültesi Dergisi, Yıl: 2017 Cilt: 12 Sayı: 24
As a result of CFA the value of χ2/df (χ2 = 1174.068, df = 608, p = .000) was found to be significant. The chi-square value can often be significant in large sample groups (Byrne, 2010). Therefore, the consideration of the χ2/df value is suggested (Kline, 2011). According to this, the χ2/df ratio (1174.068/608=1.93) seems to be less than 3 and demonstrates a very good compliance. However, the other goodness of fit indexes obtained from the CFA result showed that the compliance was not very good (GFI = 0.84, AGFI = 0.81, CF I= 0.89, RMR = 0.073 SMR = 0.053, RMSEA = 0.084). Accordingly, when examining the modification indices obtained as a result of the analysis, it was understood that there was a relationship among the errors of item 6-7, item 18-19, item 20-21, item 24-25, and item 24-28. Due to the fact that these items were not close semantically, the error covariance related to these items were added to the model and the analysis was repeated (Byrne, 2010). As a result of the CFA repeated in Table 5 the χ2/df value (χ2= 1079.051, df = 603, p < .001) was less than 3 and it demonstrated a good compliance. Also it was determined that the obtained goodness of fit index had a compliance at a sufficient level (GFI = 0.90, AGFI = 0.83, CFI = 0.91, SRMR = 0.051, RMR = 0.070, RMSEA = 0.050). Additionally, the standardized regression weights related to the model were statistically significant and varied between .55 and 79. As a result of the confirmatory factor analysis repeated according to the alteration suggestions, the seven-factor model related to the scale adapted by translating it into Turkish was verified. In other words, these results showed that the seven-dimensional factor structure was re-verified on a separate sample.
Table 5.
The Fit Indexes of The Model’s Final Version as The Result of The Improvements (N=321)
Model χ2/df GFI AGFI RMSEA CFI RMR SRMR
1.79 0.90 0.83 0.050 0.91 0.070 0.051
Reliability
The reliability (internal consistency) of the adopted scale was investigated through item analysis; both the item analysis based on the sub-upper group average differences and also the item analysis based on the correlation was performed.
Item analysis based on sub-upper group averages difference
The discriminant power of items included in the scale was tried to be determined. For this purpose, the t value of the differences between the rating means scores of each item included in the MSRTL scale which was given by the student located in the sub and upper groups was calculated. Both the sub and upper groups were created from three hundred seventy-six students, by ranking the total point which was obtained from the scale applied to 1394 8th grade students from the highest to the lowest. The result of the conducted analysis was given in Table 6.
Table 6.
The Item Averages, Standard Deviation and t Values of 27% Subgroups and 27% Upper Groups of The Scale.
Group 95% CI for
Mean Difference Item Upper Sub
M SD n M SD n t df 1 4.51 .72 376 2.91 1.21 376 1.46, 1.74 21.98* 750 2 4.40 .76 2.87 1.21 1.39, 1.68 20.86* 3 4.39 .74 2.94 1.21 1.30, 1.59 19.74* 4 4.55 .65 3.22 1.30 1.19, 1.48 17.84* 5 4.55 .69 3.07 1.36 1.32, 1.63 18.82* 6 4.53 .68 2.88 1.22 1.51, 1.80 22.98* 7 4.47 .70 3.05 1.22 1.28, 1.56 19.67* 8 4.34 .74 2.78 1.16 1.42, 1.70 21.96* 9 4.56 .64 3.05 1.30 1.36, 1.66 20.21* 10 4.61 .60 2.96 1.26 1.51, 1.79 22.94* 11 4.34 .74 2.77 1.20 1.43, 1.71 21.51* 12 4.47 .68 2.70 1.16 1.63, 1.90 25.39* 13 4.40 .79 2.72 1.20 1.53, 1.82 22.56* 14 4.48 .71 2.72 1.22 1.61, 1.90 24.05* 15 4.51 .65 2.78 1.24 1.59, 1.88 24.09* 16 4.47 .68 2.74 1.22 1.58, 1.87 23.93* 17 4.37 .78 2.82 1.17 1.41, 1.70 21.47* 18 4.57 .70 2.68 1.25 1.75, 2.04 25.66* 19 4.53 .70 2.70 1.25 1.69, 1.98 24.86* 20 4.45 .80 2.50 1.22 1.81, 2.10 26.00* 21 4.47 .87 2.59 1.22 1.72, 1.74 24.26* 22 4.57 .66 2.61 1.16 1.83, 2.10 28.64* 23 4.47 .73 2.59 1.18 1.74, 2.02 26.30* 24 4.48 .77 2.54 1.21 1.80, 2.09 26.32* 25 4.51 .74 2.65 1.27 1.70, 1.99 24.56* 26 4.45 .79 2.38 1.25 1.92, 2.22 27.10* 27 4.47 .73 2.56 1.14 1.78, 2.05 27.49* 28 4.63 .62 2.80 1.19 1.69, 1.96 26.46* 29 4.59 .62 2.81 1.16 1.65, 1.92 26.26* 30 4.19 .74 2.94 1.21 1.47, 1.79 19.57*
Bayburt Eğitim Fakültesi Dergisi, Yıl: 2017 Cilt: 12 Sayı: 24 Table 6. Continued
The Item Averages, Standard Deviation and t Values of 27% Subgroups and 27% Upper Groups of The Scale.
Group 95% CI for Mean Difference Item Upper Sub
M SD n M SD n t df 31 4.13 1.01 376 2.51 1.26 376 1.45, 1.78 19.47* 750 32 4.19 1.01 2.51 1.26 1.50, 1.82 20.34* 33 4.43 .74 2.60 1.17 1.68, 1.96 25.57* 34 4.57 .63 2.95 1.30 1.47, 1.77 21.77* 35 4.39 .75 2.62 1.24 1.63, 1.92 23.78* 36 4.57 .64 2.53 1.19 1.89, 2.17 29.13* 37 4.60 .74 2.85 1.36 1.60, 1.91 22.04* p < .05.
According to Table 6, at this stage, none of the items were removed from the scale because the results of the independent t-test made for an average of the sub and upper group items were significant for all the items (p < .05).
Item analysis based on the item total correlation
The item-total correlation describes the relationship between the scores obtained from the test items and the total score of the test. The positive and high total correlation of the test showed that the items sampled similar behaviors and that the internal consistence of the test was high (Field, 2013). The item-total correlation data of the scale is given in Table 7.
Table 7.
Reliability Values (Cronbach’s alpha) ve Item-Total Correlation of The Scale Items Factor Item Corrected
Item-Total Correlation Cronbach’s α Technology learning self-efficacy 1 .58 .81 2 .54 3 .53 4 .50 Technology learning value 5 .53 .79 6 .59 7 .51 8 .55 9 .52 Technology active learning strategies 10 .60 .84 11 .53 12 .57 13 .52 14 .59 15 .59 16 .57 17 .53 Technology learning environment stimulation 18 .59 .84 19 .62 20 .58 21 .56 22 .63 23 .47 Technology learning goal-orientation 24 .60 .84 25 .59 26 .62 27 .64 28 .63 29 .60 Technology learning self-regulation triggering 30 .47 .76 31 .46 32 .49 Technology learning self-regulation implementing 33 .60 .82 34 .56 35 .58 36 .65 37 .58 The whole scale .95
Bayburt Eğitim Fakültesi Dergisi, Yıl: 2017 Cilt: 12 Sayı: 24
In MSRTL the item-total correlation was calculated in order to investigate the internal consistency of the obtained scores. The item-total correlation values of each item vary between .46 and .64 (Table7). Generally, if the item-total correlation value for each item is higher than .30, then it is a sufficient value for the item to be removed from the scale (Field, 2013). For the reliability analysis of the final version of the adapted scale, the scale was applied to one thousand three hundred and ninety-four eighth-grade students. In this application the Cronbach’s alpha value of the items in the scale’s first factor was calculated to be .81, for the items in the second factor it was .79, for the items in the third, fourth and fifth factors it was .84, for the item in the sixth factor it was .76 while for the items in the seventh factor it was .82. The Cronbach’s alpha coefficient of the whole scale was determined to be .95. These values showed that the adapted version of the scale was sufficiently reliable. As well as, the relationship between the student answers of the scale’s sub-dimensions were studied.
Table 8.
The Relationship Between The Dimensions (N=1394)
(1) (2) (3) (4) (5) (6) (7) (1) Technology learning self-efficacy .624** .609** .491** .542** .271** .470** (2) Technology learning value .689** .570** .557** .268** .510** (3) Technology active learning strategies .637** .654** .408** .610** (4) Technology learning environment stimulation .696** .532** .644** (5) Technology learning goal-orientation .532** .669** (6) Technology learning self-regulation triggering .578** (7) Technology learning self-regulation implementing
According to Table 8, the relationships among the scale’s sub-dimensions were significant and positive. The highest relation was observed between the technology
learning environment stimulation and the technology learning goal-orientation sub-dimensions, while the lowest relation was seen between the scores of the Technology learning value and the technology learning self-regulation triggering sub-dimensions.
Discussion, Conclusion, and Suggestions
This study was carried out in order to adapt “The Motivation and Self-regulation towards Technology Learning (MSRTL) scale which was developed by Liou and Kuo (2014) into Turkish. The scale which was developed by Liou and Kuo (2014) was originally English and consisted of seven sub-dimensions and 39 items. Exploratory factor analysis was applied to one thousand seventy-three eighth-grade students in order to determine the construct validity of the scale. As the result of the analysis, the KMO value was .966 and the χ2 value of the Bartlett sphericity test was 17705.374 (p < .05) and a scale consisting of seven factors and thirty-seven items was obtained. It was determined that the scale whose Turkish adaptation was made explained 57.66% of the total variance and that the items of the sub-factors were matching with the items of the original version. Confirmatory factor analysis was conducted on three hundred and twenty-one eighth-grade students in order to test the seven sub-dimensions of the scale. It can be stated that this scale which was adapted by being translated into Turkish formed a good model with all the compliance statistics, was a valid scale with its factor structure and the scale was also confirmed by the Turkish students. The Cronbach’s alpha value of the scale’s Turkish adaptation was detected as .95, while the values of the scale’s seven sub-dimensions varied between .76 and .84.
The findings which were obtained by conducting the exploratory factor analysis and the confirmatory factor analysis on the Turkish adapted version of The Motivation and Self-regulation towards Technology Learning (MSRTL) scale which was developed by Liou and Kuo (2014) and consisted of seven factors and 39 items originally, showed that 37-items version of the scale was valid and reliable in cultural aspect for being used in Turkey. Moreover, it was stated that the scale could be used to determine the level of motivation and self-regulation skills of the 8th-grade students toward technology learning.
References
American Association for the Advancement of Science (1993). Benchmarks for science literacy. New York: Oxford University Press. Retrieved from http://www.project2061.org/tools/benchol/bolframe.htm
Alamin, A. A., Shaoqing, G., & Le, Z. (2015). The development of educational technology policies (1996-2012) lessons from China and the USA. International Education Studies, 8(6), 142-150.
Bayburt Eğitim Fakültesi Dergisi, Yıl: 2017 Cilt: 12 Sayı: 24
Alwan, A.F. (2008). Self-regulated learning in high and low achieving students at Al-Hussein Bin Talal University (AHU) in Jordan. International Journal of Applied Educational Studies, 1(1), 1-13.
Arbuckle, J.L. (2012). Ibm amos 21 user’s guide. chicago: SPSS Inc. Retrieved fromftp://public.dhe.ibm.com/software/analytics/spss/documentation/amos/21.0/en/Manu als/IBM_SPSS_Amos_Users_Guide.pdf
Atkinson, J.W. (1966). Motivational determinants of risk taking behavior. In J.W. Atkinson, & N.T. Feather (Eds.), A theory of achievement motivation (pp. l-31). New York: Wiley. Baloğlu, M. (2005). Matematik kaygısı derecelendirme ölçeği’nin Türkçe’ye uyarlanması, dil
geçerliği ve ön psikometri incelemesi [Adaptation of the mathematics anxiety rating scale to Turkish, language validity and preliminar psychometric properties]. Kuram ve Uygulamada Egitim Bilimleri Dergisi[Educational Sciences: Theory & Practice], 5(1), 7-30.
Bandura, A. (1977). Self-efficacy: toward a unifying theory of behavioral change. Psychological Review, 84(2),191-215. doi: 10.1037/0033-295X.84.2.191
Bandura, A. (1982). Self-efficacy mechanism in human agency. American Psychologist, 37(2), 122-147. doi:10.1037/0003-066X.37.2.122
Bandura, A. (1991). Social cognitive theory of self-regulation. Organizational Behavior and Human Decision Processes, 50, 248-287.
Bandura, A. (1995). Exercise of personal and collective efficacy in changing societies. In A. Bandura (Eds.), Self-efficacy in changing societies (pp. 1-45). Cambridge, England: Cambridge University Press.
Bandura, A. (1997). Self efficacy: The exercise of control. New York, NY: W.H. Freeman & Company.
Bayram, N. (2010). Yapısal eşitlik modellemesine giriş amos uygulamaları [Structural Equation Modeling Introduction: AMOS Applications]. İstanbul: Ezgi Kitabevi.
Boekaerts, M., & Corno, L. (2005). Self-regulation in the classroom: A perspective on assessment and intervention. Applied Psychology: An International Review, 54(2), 199-231.
Boekaerts, M., Pintrich, P., & Zeidner, M. (2000). Self-regulation. an introductory overview. In M. Boekaerts, P. Pintrich, & M. Zeidner (Eds), Handbook of self-regulation (pp.1-9). San Diego: Academic Press.
Bong, M. (2004). Academic motivation in self-efficacy, task value, achievement goal orientations, and attributional beliefs. The Journal of Educational Research, 97(6), 287-298. doi: 10.3200/JOER.97.6.287-298
Browne, M.W., & Cudeck, R. (1989). Single sample cross-validation indices for covariance structures. Multivariate Behavioral Research, 24, 445-455.
Byrne, B. M. (2010). Structural equation modelingwith amos: basic concepts, applications, and programming (2nd ed.). Madison, NY: Routledge.
CEO Forum on Education and Technology. (2001). Education technology must be ıncluded in comprehensive education legislation. policy paper. Retrieved from http://www.hscdsb.on.ca/pdf/publications/5/55/CEO%20Forum%202001%20Policy%20P aper.pdf
Chularut, P., & DeBacker, T. (2004). The influence of concept mapping on achievement, selfregulation, and self-efficacy in students of English as a second language. Contemporary Educational Psychology, 29, 248-263.
Çokluk, O., Şekercioğlu, G., & Büyüköztürk, S. (2012). Sosyal bilimler için çok değişkenli istatistik: SPSS ve LISREL Uygulamaları[Multivariate statistics for the social sciences: SPSS and LISREL Applications] (2nd ed.). Ankara: PegemA Akademi.
Dermitzaki, I., Stavroussi, P., Vavougios, D., & Kotsis, K. T. (2012). Adaptation of the students' motivation towards science learning (SMTSL) questionnaire in the Greek language. European Journal of Psychology Education, 28, 747-766.
doi: 10.1007/s10212-012-0138-1
Eccles, J., Wigfield, A., Harold, R.D., & Blumenfeld, P. (1993). Age and gender differences in children's self- and task perceptions during elementary school. Child Development, 64(3), 830-847. doi: 10.2307/1131221
Field, A. (2013). Discovering statistics using SPSS (4th ed.). London: SAGE Publications. Hu, L., & Bentler, P.M. (1999). Cutoff criteria for fit indexes in covariance structure analysis:
Conventional criteria versus new alternatives. Structural Equation Modeling: A Multidisciplinary Journal 6(1), 1-55. doi:10.1080/10705519909540118.
Kaiser, H.F. (1974). An index of factorial simplicity. Psychometrika, 39(1), 31-36. doi: 10.1007/BF02291575
Keller, J.M. (1983). Motivational design of instruction. In C. M. Reigeluth (Eds.), Instructional-design theories and models: an overwiew of their current status (pp.386-434). Hillsdate, NJ: Lawrence Earlbaum Associates.
Kline, R.B. (2011). Principles and practice of structural equation modeling (3rd ed.). NY: Guilford Press.
Liou, P.Y., & Kuo, P.J. (2014). Validation of an instrument to measure students’ motivation and self-regulation towards technology learning. Research in Science & Technological Education, 32(2), 79-96. doi:10.1080/02635143.2014.893235.
Malpass, J.R., O'Neil, H.F., & Hocevar, D. (1999). Self‐regulation, goal orientation, self‐ efficacy, worry, and high‐stakes math achievement for mathematically gifted high school students. Roeper Review, 21(4), 281-288, doi: 10.1080/02783199909553976
Martin, B.L., & Brigg, L.J. (1986). Other dimensions of the effective domain: emotional development and feelings, interest and motivation, social develpment and group Dynamics, attributions. In B. L.M. Martin, & L.J. Brigg (Eds.), The affective and cognitive domains: ıntegration for ınstruction and research (pp.191-222). New Jersey: Educational Technology Publications Englewood Cliffs, Academic Press.
Meece, J.L. (2003). Applying learner-centered principles to middle school education. Theory Into Practice, 42(2), 109-116, doi: 10.1207/s15430421tip4202_4
Bayburt Eğitim Fakültesi Dergisi, Yıl: 2017 Cilt: 12 Sayı: 24
Meece, J.L., Blumenfeld, P.C., & Hoyle, R.H. (1988). Students’ goal orientations and cognitive engagement in classroom activities. Journal of Educational Psychology, 80, 514-523. Multon, K.D., Brown, S.D., & Lent, R. W. (1991). Relation of self-efficacy beliefs to academic
outcomes: A meta-analytic investigation. Journal of Counseling Psychology, 18, 30-38. National Research Council. (1996). National science education standards. [Adobe Digital
Edtions version]. doi: 10.17226/4962
Öncü, H. (2006). Motivasyon (güdüleme) [motivation]. L. Küçükahmet (Ed.), Sınıf yönetimi içinde [Classroom Management] (pp. 167-189). Ankara: Nobel Yayın Dağıtım.
Pintrich, P.R. (2000). The role of goal orientation in self-regulated learning. In M. Boekaerts, P.R. Pintrich, & M. Zeidner (Eds.), Handbook of self-regulation (pp. 451-502). San Diego, CA: Academic Press.
Pintrich, P.R., Marx, R.W., & Boyle, R.A. (1993). Beyond cold conceptual change: The role of motivational beliefs and classroom contextual factors in the process of conceptual change. Review of Educational Research, 63(2), 167-199. doi:10.3102/00346543063002167
Pintrich, P.R., & Schunk, D. (1996) Motivation in education: theory, research and application. Retrieved from http://www.uky.edu/~eushe2/Pajares/PS.html#history
Puustinen, M., & Pulkkinen, L. (2001). Models of self-regulated learning: A review. Scandinavian Journal of Educational Research, 45(3), 269-286.
Ryan, R., & Deci, E. (2000). Intrinsic and extrinsic motivations: Classic definitions and new directions. Contemporary Educational Psychology, 25, 54–67.
Schmeck, R.R. (1988). An introduction to strategies and styles of learning, In Schmeck, R.R. (Ed.), Learning strategies and learning styles (pp.3-19). New York: Plenum Press. Schumaker, J.B., & Deshler, D.D. (1992). Validation of learning strategy interventions for
students with LD: Results of a programmatic research effort. In Y.L. Wong (Ed.), Contemporary intervention research in learning disabilities: An international perspective (pp.22-46). New York: Springer-Verlag.
Schunk, D.H. (1984). Self-efficacy perspsctive on achivement behavior. Educational Psychologist, 19, 48-58. doi: 10.1080/00461528409529281
Schunk, D.H. (1989). Self-efficacy and achievement behaviors. Educational Psychology Review, 1, 173-208.
Schunk, D.H. (1991). Self-efficacy and academic motivation. Educational Psychologist, 26(3-4), 207-231. doi: 10.1080/00461520.1991.9653133
Schunk, D.H., & Swartz, C.W. (1993). Goals and progress feedback: Effects on self-efficacy and writing achievement. Contemporary Educational Psychology, 18(3), 337-354. Stolk, J., & Harari, J. (2014). Student motivations as predictors of high-level cognitions in
project-based classrooms. Active Learning in Higher Education, 15(3), 231-247. doi: 10.1177/1469787414554873
Tavşancıl, E. (2014). Tutumların ölçülmesi ve SPSS ile veri analizi (5. Baskı). Ankara: Nobel Yayıncılık.
Tuan, H., Chin, C., & Shieh, S. (2005). The development of a questionnaire to measure students’ motivation towards science learning. International Journal of Science Education, 27(6), 639-654. doi: 10.1080/0950069042000323737
Tosun, C., & Şekerci, A.R. (2015). The role of motivation in self regulation skills in eight grade students’ science classess. Erzincan University Journal of Education Faculty, 17(1), 1-29. doi: 10.17556/jef.97746
VandeWalle, D. (1997). Development and validation of a work domain goal orientation instrument. Educational and Psychological Measurement, 57, 995-1015. doi: 10.1177/0013164497057006009
Velayutham, S., Aldridge, J., & Fraser, B. (2011). Development and validation of an instrument to measure students’ motivation and self-regulation in science learning. International Journal of Science Education, 33(15), 2159-2179. doi: 10.1080/09500693.2010.541529 Velayutham, S., Aldridge, J., & Fraser, B. (2012). Gender differences in student motivation and
self-regulation in science learning: a multi-group structural equation modeling analysis. International Journal of Science and Mathematics Education 10(6), 1347-1368. doi:10.1007/s10763-012-9339-y
Wigfield, A., & Eccles, J. S. (1992). The development of achievement task values: A theoretical analysis. Developmental Review, 12(3), 265-310. doi: 10.1016/0273-2297(92)90011-P Wigfield, A., Eccles, J.S., Yoon, K.S., Harold, R.D., Arbreton, A.J.A., Freedman-Doan, C, &
Blumenfeld, P.C. (1997). Change in children's competence beliefs and subjective task values across the elementary school years: A 3-year study. Journal of Educational Psychology, 89(3), 451-469. doi: 10.1037/0022-0663.89.3.451
Yılmaz, H., & Huyugüzel-Cavaş, P. (2007). Reliability and validity study of the students’ motivation toward science learning questionnaire (in Turkish). Elementary Education Online, 6(3), 430-440.
Zeidner, M., Boekaerts, M., & Pintrich, P. (2000). Self-regulation. directions and challenges for future research. In M. Boekaerts, P. Pintrich, & M. Zeidner (Eds.), Handbook of self-regulation (pp. 749-768). New York: Academic Press.
Zimmerman, B.J. (1989). A social cognitive view of self-regulated academic learning. Journal of Educational Psychology, 81(3), 329-339.
Zimmerman, B.J. (1998). Academic studing and the development of personal skill: A self regulatory perspective. Educational Psychologist, 33(2-3),73-86. doi: 10.1080/00461520.1998.9653292
Zimmerman, B.J. (2002). Becoming a self-regulated learner: an overview. Theory into Practice, 41(2), 64-70. doi: 10.1207/s15430421tip4102_2
Zimmerman, B.J. (2008). Investigating self-regulation and motivation: historical background, methodological developments, and future prospects. American Educational Research Journal, 45(1), 166-183. doi: 10.3102/0002831207312909
Bayburt Eğitim Fakültesi Dergisi, Yıl: 2017 Cilt: 12 Sayı: 24
Zimmerman, B.J., & Pons, M.M. (1986). Development of a structured interview for assessing student use of self-regulated learning-strategies. American Educational Research Journal, 23(4), 614-628. doi: 10.3102/00028312023004614
Zimmerman, B.J., & Pons, M.M. (1990). Student differences in self-regulated learning: relating grade, sex, and giftedness to self-efficacy and strategy use. Journal of Educational Psychology, 82(1), 51-59. doi: 10.1037/0022-0663.82.1.51
Zimmerman, B.J., & Risemberg, R. (1997). Self-regulatory dimensions of academic learning and motivation. In G.D. Phye (Ed.), Handbook of academic learning: Construction of knowledge (pp. 105-125). San Diego, CA: Academic Press.
APPENDIX-1: Teknoloji Öğrenimine Karşı Motivasyon ve Öz Düzenleme Ölçeği
Teknoloji öğrenme öz yeterliliği;
1. Teknoloji ile ilgili kavramları öğrenirken çok iyi anlayabilirim. 2. Teknoloji konuları benim için kolaydır.
3. Teknolojide genellikle iyiyimdir.
4. Gayret edersem zorlu çalışmaları tamamlayabilirim. Teknoloji öğrenme değeri;
5. Günlük hayatımda kullanabildiğim için teknoloji öğrenmenin önemli olduğunu düşünürüm.
6. Düşüncelerimi harekete geçirdiği için teknoloji öğrenmenin önemli olduğunu düşünürüm.
7. Teknolojide, problemlerin nasıl çözüleceğini öğrenmenin önemli olduğunu düşünürüm.
8. Teknolojide, sorgulamaya yönelik etkinliklere katılmanın önemli olduğunu düşünürüm.
9. Teknoloji öğrenirken merakımı giderecek fırsatlara sahip olmanın önemli olduğunu düşünürüm.
Teknoloji aktif öğrenme stratejileri;
10. Teknoloji ile ilgili yeni kavramları öğrenirken onları anlamak için çaba gösteririm. 11. Teknoloji ile ilgili yeni kavramları öğrenirken onları önceki deneyimlerimle ilişkilendirmeye çalışırım.
12. Teknoloji ile ilgili yeni kavramları öğrenirken onları anlamak için araştırmaya çalışırım.
13. Bir teknoloji kavramını anlamadığım zaman, o kavramı netleştirmek için öğretmenimle ya da öğrenci arkadaşlarımla tartışırım.
14. Teknoloji ile ilgili bir konuyu öğrenirken önceden öğrendiğim kavramlar ile bağlantılar kurmaya çalışırım.
15. Teknolojiyi uygulamada bir engelle karşılaştığımda bu problemin nedenlerini anlamaya çalışırım.
16. Anlamadığım teknoloji kavramlarıyla karşılaştığımda, onları yine de öğrenmeye çalışırım.
17. Teknolojiyle ilgili öğrendiğim önceki ve yeni kavramlar uyuşmadığında aralarındaki farklılıkları ayırt etmeye çalışırım.
Teknoloji öğrenme ortamında teşvik;
18. Teknoloji ile ilgili ders kitapları görsel olarak canlı ve zengin içeriğe sahip olduğu için derse katılmaya istekliyim.
19. Öğretmenim çeşitli öğretim yöntemlerini kullandığı için teknoloji dersine katılmaya istekliyim.
20. Öğretmenim üzerimde çok fazla baskı oluşturmadığı için teknoloji dersine katılmaya istekliyim.
21. Öğretmenim beni önemsediği için teknoloji dersine katılmaya istekliyim. 22. Teknoloji dersi ilgi çekici olduğu için bu derse katılmaya istekliyim.
23. Teknoloji dersi, öğrencileri tartışmalara dâhil ettiği için bu derse katılmaya istekliyim.
Teknoloji öğrenme hedefine yönelim;
24. Hedeflerimden birisi mümkün olduğu kadar teknoloji ile ilgili kavramları öğrenmektir.
25. Hedeflerimden birisi yeni teknolojilerin içeriğini öğrenmektir. 26. Hedeflerimden birisi teknoloji ile ilgili yeni becerilerde ustalaşmaktır. 27. Teknoloji dersini anlamam önemlidir.
28. Teknoloji ile ilgili becerilerimi geliştirmek benim için önemlidir. 29. Teknolojik fikirleri anlamak benim için önemlidir.
Teknoloji öğrenme öz-düzenlemeyi tetikleme;
30. Teknoloji ile ilgili ödevler/görevler ilgi çekici olmadığında bile çalışmaya devam ederim.
31. Yaptıklarımdan hoşlanmasam bile teknoloji dersine sıkı çalışırım. 32. Yapılacak daha iyi şeyler olsa bile teknoloji çalışmaya devam ederim. Teknoloji öğrenme öz-düzenlemeyi uygulama;
33. Önemli noktaları kaçırmamak için teknoloji dersine yoğunlaşırım. 34. Teknoloji ile ilgili çalışmaları ve ödevlerimi zamanında bitiririm. 35. Teknoloji ile ilgili çalışmalar zor olsa bile vazgeçmem.
36. Teknoloji dersine konsantre olurum.
37. Teknoloji dersinde yapmam gerekenleri bitirene kadar çalışmaya devam ederim. Genişletilmiş Özet
Okul ve diğer eğitim kurumlarının en önemli görevlerinden biri de bilgi ve becerileriyle donatılmış (bilgiye ulaşabilen, kullanabilen, iletebilen ve üretebilen), teknolojiyi kullanabilen ve kendi kendine öğrenebilen (öğrenmeyi öğrenmiş) bireyler yetiştirmektir. Yaşantımızın önemli bir parçası olarak teknoloji, eğitim faaliyetlerinin yürütülmesinde vazgeçilmez bir hal almıştır. Bu noktada okullarda yürütülen eğitim faaliyetlerinin, öğrencilerin teknolojiyi kullanımalarında ve öğrenmelerinde olumlu yönde motive etmesi ve onların herhangi bir konu hakkında öz düzenleme becerilerini kazanmalarına yardımcı olması beklenmektedir. Öğrencilerin teknoloji öğrenimi ile olumlu yönde motivasyon ve öz düzenleme becerilerini edinmemeleri durumu ekonomik gelişmelerin temeli olarak görülen fen, teknoloji, mühendislik ve matematik gibi alanlara daha az ilgili göstermeleri neden olacağı vurgulanmaktadır
Bayburt Eğitim Fakültesi Dergisi, Yıl: 2017 Cilt: 12 Sayı: 24
(Liou & Kuo, 2014). Bu çalışmanın amacı Liou ve Kuo (2014) tarafından geliştirilen ölçeğin Türkçe’ye uyarlanmasıdır.
Teknoloji Öğrenimine Karşı Motivasyon ve Öz Düzenleme Ölçeği’nin Türkçe’ye uyarlanması ve daha sonra adapte edilen ölçeğin uygun bir örneklem grubuna uygulanması aşamasında dört farklı örneklem grubundan veri toplanmıştır. Örneklem gruplarının; ilkinde ölçek maddelerinin araştırmacılar tarafından Türkçe’ye çevrilmesinden sonra çeviri maddelerinin orijinal ölçek maddelerini ne derece karşıladığını belirlemek için her iki dili de hâkim 13 eğitim teknolojisi alanında uzmana inceletilmiştir. İkincisinde sekiz Türk Dili uzmanı ölçek maddelerinin Türk dil kurallarına uygunluğunun değerlendirmeleri istenmiştir. Üçüncüsünde ise bir ortaokulun 8. sınıfında öğrenimlerine devam etmekte olan 48 öğrenciye ölçek maddelerinin Türkçe ve İngilizce ifadelerinden aynı şeyleri anlayıp anlamadıklarını belirlenmiştir. Sonuncusu ise ölçeğin geçerlik ve güvenirlik çalışmasını yapmak üzere Türkiye’nin üç farklı ilinin (Kütahya, Adana ve Trabzon) kırsal ve kentsel bölgelerinin devlet okullarında öğrenim gören 1394 sekizinci sınıf öğrencisi çalışmaya katılmıştır. Araştırmada veri toplama aracı olarak Liou ve Kuo (2014) tarafından geliştirilen “Teknoloji Öğrenimine Karşı Motivasyon ve Öz Düzenleme Ölçeği”nin yedi alt boyutta 39 maddelik İngilizce formu kullanılmıştır. Bu alt boyutlar teknoloji öğrenme öz yeterliliği, teknoloji öğrenme değeri, teknoloji aktif öğrenme stratejileri, teknoloji öğrenme ortamında teşvik, teknoloji öğrenme hedefine yönelim, teknoloji öğrenme öz-düzenlemeyi tetikleme ve teknoloji öğrenme öz-düzenlemeyi uygulamadır. Orijinal ölçeğin çok boyutluluğu açımlayıcı faktör analizi ile saptanmıştır. Ölçek maddeleri beşli likert tipinde hazırlanmıştır. Ölçeği cevaplandıranların maddelere katılma dereceleri; Tamamen Katılıyorum (5)’ dan Kesinlikle Katılmıyorum (1)’a doğru sınıflandırılmıştır. Ölçekte yer alan tüm maddeler olumlu cümle yapısındadır. Orijinal ölçeğin verileri 10. sınıf da öğrenimlerine devam etmekte olan toplam 1822 öğrenciden elde edilmiştir.
Türkçe’ye uyarlama çalışmasına başlanmadan önce ve ölçeği uyarlama sonrası, ölçeğin geliştiricilerinden izin alınmıştır. İzin alındıktan sonra, ölçek maddeleri araştırmacılar tarafından birbirinden farklı olarak Türkçe’ye tercüme edilmiştir. Daha sonra araştırmacıların çevirileri arasındaki uyum incelenmiştir. Birbirinden farklı çeviriler arasında ortak bir karara varılmıştır. Türkçe’ye çevrilen ifadelerin İngilizce-Türkçe uyumluluğu İngilizce-Türkçe çevirinin orijinal maddeleri hangi oranda karşıladığını belirlemek amacıyla Baloğlu (2005) tarafından geliştirilen ingilizce uzmanları Türkçe çevirinin orijinal maddeyi hiç karşılamadığını düşünülüyorsa sıfır (0); tamamen karşıladığını düşünüyorlarsa on (10) sınırlarında puan verdiği derecelendirme formu kullanılmıştır. Bu form Türkçe ve İngilizceye hâkim 13 eğitim teknolojisi alanında uzmanına kağıt üzerinde doldurulması istenmiştir. Bununla birlikte ölçek maddelerinin Türk dil kurallarına uygunluğunun belirlenmesi için sekiz Türk dili uzmanına Türkçe anlaşılabilirlik derecelendirme formu (Baloğlu, 2005) uygulanmıştır. Uzmanların görüşleri dikkate alınarak Türkçe çeviride düzeltmeler yapılmıştır. Son olarak ölçeğin ilk önce İngilizce formu beş hafta sonra Türkçe formu
sekizinci sınıfta okuyan ve iki dili bilen 48 öğrenci grubuna uygulanarak iki form arasındaki tutarlık derecesi incelenmiştir. Ölçeğin çok boyutlu yapısı, psikometrik özellikleri hakkında fikir elde etmek amacıyla 1073 öğrenciden elde edilen veriye açımlayıcı faktör analizi, 321 öğrenciden elde edilen veriye ise doğrulayıcı faktör analizi yapılmıştır. 1394 öğrenciden elde edilen veriye ise madde analizi yapılarak Cronbach’s alfa hesaplanmıştır. Verilerin analizinde Açımlayıcı faktör analiz (AFA), geçerlik ve güvenirlik çalışması için SPSS 21 programı ve doğrulayıcı faktör analizi (DFA) için AMOS 21 (Arbuckle, 2012) istatistik programı kullanılmıştır. Liou ve Kuo (2014) tarafından geliştirilen ve orijinal dili İngilizce olan yedi alt boyut 39 maddeden oluşan bir ölçektir. Ölçeğin yapı geçerliğini belirlemek için 1073 sekizinci sınıf öğrencisine açımlayıcı faktör analizi yapılmış ve analiz sonucunda KMO değeri .966 ve Bartlett Küresellik testi χ2 değeri ise 17705.374 (p < .05) olan, yedi faktörlü ve otuz yedi maddeden oluşan ölçek elde edilmiştir. Türkçe’ye uyarlaması yapılan ölçme aracının toplam varyansın %57.66’sını açıkladığı ve alt faktörlerde yer alan maddelerin orijinal formdaki maddelerle örtüştüğü belirlenmiştir. Ölçeğin yedi alt boyutu doğrulayıp doğrulamadığı test etmek için 321 sekizinci sınıf öğrencisine doğrulayıcı faktör analizi yapılmıştır. Türkçe’ye çevrilerek uyarlaması yapılan bu ölçeğin, bütün uyum istatistikleriyle iyi bir model oluşturduğu, faktör yapılarıyla geçerli bir ölçek olduğu ve Türk öğrenciler ile de doğrulandığı söylenebilir. Türkçe’ye uyarlaması yapılan ölçeğin cronbach’s alfa değeri .95 tespit edilmiş ve ölçeğin yedi alt boyutuna ait değerler ise .76 ile .84 arasında değiştiği belirlenmiştir.
Sonuç olarak Liou ve Kuo (2014) tarafından yedi faktör ve 39 madde olarak geliştirilen “Teknoloji Öğrenmeye Karşı Motivasyon ve Öz-düzenleme Ölçeği”nin Türkçe’ye uyarlanan formunun açımlayıcı faktör analizi ve doğrulayıcı faktör analizi sonucu elde edilen bulgular, ölçeğin 37 maddelik halinin kültürel açıdan Türkiye’de kullanılabilecek geçerli ve güvenilir bir ölçek olduğunu göstermiştir. Bununla birlikte ölçeğin ortaokul sekizinci sınıf öğrencilerinin teknoloji öğrenimine karşı motivasyon ve öz-düzenleme beceri düzeylerinin belirlenmesinde kullanılabileceği söylenebilir.