doi: 10.1093/nar/gkw048
Modeling the combined effect of RNA-binding proteins
and microRNAs in post-transcriptional regulation
Saber HafezQorani
1,†, Atefeh Lafzi
1,†, Ruben G. de Bruin
2,3, Anton Jan van Zonneveld
2,3,
Eric P. van der Veer
2,3, Yes¸im Aydın Son
1and Hilal Kazan
4,*1Graduate School of Informatics, Department of Health Informatics, Middle East Technical University, ¨Universiteler
Mahallesi, Dumlupınar Bulvarı, No:1, 06800 Ankara, Turkey,2Einthoven Laboratory of Experimental Vascular
Medicine, Albinusdreef 2, 2333 ZA Leiden, The Netherlands,3Department of Nephrology, Albinusdreef 2, 2333 ZA
Leiden, The Netherlands and4Department of Computer Engineering, Antalya International University, C¸ıplaklı
Mahallesi, Farabi Caddesi No:23, 07190 D¨os¸emealtı, Antalya, Turkey Received May 21, 2015; Revised December 29, 2015; Accepted January 18, 2016
ABSTRACT
Recent studies show that RNA-binding proteins (RBPs) and microRNAs (miRNAs) function in coordi-nation with each other to control post-transcriptional regulation (PTR). Despite this, the majority of re-search to date has focused on the regulatory effect of individual RBPs or miRNAs. Here, we mapped both RBP and miRNA binding sites on human 3′UTRs and
utilized this collection to better understand PTR. We show that the transcripts that lack competition for HuR binding are destabilized more after HuR deple-tion. We also confirm this finding for PUM1(2) by mea-suring genome-wide expression changes following the knockdown of PUM1(2) in HEK293 cells. Next, to find potential cooperative interactions, we identi-fied the pairs of factors whose sites co-localize more often than expected by random chance. Upon exam-ining these results for PUM1(2), we found that tran-scripts where the sites of PUM1(2) and its interacting miRNA form a stem-loop are more stabilized upon PUM1(2) depletion. Finally, using dinucleotide fre-quency and counts of regulatory sites as features in a regression model, we achieved an AU-ROC of 0.86 in predicting mRNA half-life in BEAS-2B cells. Altogether, our results suggest that future studies of PTR must consider the combined effects of RBPs and miRNAs, as well as their interactions.
INTRODUCTION
Post-transcriptional regulation (PTR) is increasingly rec-ognized as a complex system that controls every aspect of RNA metabolism. Dysregulation of PTR mechanisms is as-sociated with many diseases such as neurodegenerative
dis-orders, cancer and atherosclerosis (1). PTR is mediated by
the interactions of trans-factors such as RNA-binding pro-teins (RBPs) and microRNAs (miRNAs) with cis-acting el-ements located in mRNAs. Characterization of these inter-actions is the first step to better understanding PTR and diseases associated with defective PTR.
RBPs critically regulate (pre-)mRNA splicing, localiza-tion, degradation and translation by binding to short se-quences and/or structure motifs in target (pre)-mRNAs
(2). Eukaryotic genomes encode for more than 850 RBPs
(3,4); however, the (p)mRNA targets of most RBPs
re-main uncharacterized. The lack of motifs for the major-ity of RBPs prevents the analysis of PTR mechanisms. Recently developed experimental methods provide great promise in filling this gap by expanding our knowledge of RBP targets. UV cross-linking and immunoprecipita-tion (CLIP) based approaches have been designed to
cap-ture the in vivo binding sites of RBPs (5).
Photoactivatable-ribonucleoside-enhanced CLIP (PARCLIP) is a widely used modification of the CLIP protocol where photoreactive nu-cleosides are introduced to generate characteristic sequence
changes upon crosslinking (6). These mutations make it
possible to distinguish between direct and indirect inter-actions with (pre-)mRNA targets. CLIP experiments have been performed for only a handful of RBPs, though this number is increasing rapidly. In vitro methods have also been used in identifying the binding specificities of RBPs. In particular, RNAcompete is a high-throughput array-based method that has been recently used to characterize the binding specificities of 207 RBPs from 20 diverse
eukary-otes (7). This compendium, together with CLIP-determined
binding sites, form an invaluable resource to investigate RBP-regulated mechanisms. miRNAs, an important class of non-coding RNAs, also interact with mRNAs and en-hance either transcript degradation or translational repres-sion based on sequence complementarity, effectively
down-*To whom correspondence should be addressed. Tel: +90 242 245 0271; Fax: +90 242 245 01 00; Email: [email protected]
†These authors contributed equally to the paper as first authors.
C
⃝The Author(s) 2016. Published by Oxford University Press on behalf of Nucleic Acids Research.
This is an Open Access article distributed under the terms of the Creative Commons Attribution License (http://creativecommons.org/licenses/by/4.0/), which permits unrestricted reuse, distribution, and reproduction in any medium, provided the original work is properly cited.
by guest on March 3, 2016
http://nar.oxfordjournals.org/
regulating gene expression. Computational methods such
as TargetScan (8) and PicTar (9) are commonly used
pro-grams that enable the prediction of miRNA targets. Ad-ditionally, Ago-CLIP experiments can be used to identify the miRNA sites on mRNAs in vivo. However, the identity of the miRNA(s) binding to an AGO cross-linked region is unknown and needs to be inferred by further computa-tional analysis. Recent studies have shown that mRNA fate is controlled by the complex interplay of RBPs and
miR-NAs (10–12). An interesting example of this phenomenon is
the cooperation between the RBP PUM1 and the miRNAs
miR-221/222 on the 3′UTR of the tumor suppressor gene
p27, where PUM1 was found to induce a conformational switch that enhanced miR-binding and repression of p27
(13). Similarly, the nuclear RBP HNRNPL was found to
undergo a hypoxia-induced translocation to the cytoplasm where it competes with several miRNAs for access to the
VEGFA 3′UTR through a CA-rich element, enhancing the
stability of the transcript (14). Despite several similar
ex-amples of such interactions, the number of studies that have looked at the combined effect of RBPs and miRNAs in PTR is limited. Mukharjee et al. analyzed the combinatorial
reg-ulation by HuR and miRNAs (15). They found that the
ex-istence of overlapping miRNA sites has no effect on HuR-mediated regulation of pre(mRNAs), but that the existence of overlapping HuR sites is capable of relieving miRNA-mediated repression. Also, Jiang et al. investigated the in-teractions between a limited set of RBPs and miRNAs by looking at the positional relationship of motif occurrences
(16). To the best of our knowledge, a comprehensive study
of cooperative and competitive interactions between pairs of factors (i.e. all RBPs and miRNAs) is still lacking.
In this study, we mapped the RBP and miRNA target
sites on human 3′UTRs by combining computational
pre-dictions with CLIP-determined peaks. We also incorpo-rated the conservation and secondary structure context of RBP and miRNA binding sites. Such properties of target sites are well characterized for miRNAs, but relatively little is known about the functionality of RBP sites with vary-ing degrees of accessibility and conservation. As such, we focused on two RBPs, HuR and PUM2, and assessed how accessibility and conservation of their binding sites differ between CLIP-supported sites and other sites that are com-putationally predicted. Next, following HuR depletion, we showed that: (i) mRNAs with CLIP-supported HuR sites are more destabilized compared to mRNAs with computa-tionally predicted sites; and (ii) transcripts that lack com-petition for HuR binding display increased destabilization, clearly illustrating the effect of competition of other factors to HuR finding. We validated these findings by specifically abrogating PUM1 and PUM2 in HEK293 cells, after which we assessed genome-wide gene expression. To our knowl-edge this study marks the first time that the genome-wide effects of PUM1 and PUM2 knockdown have been inves-tigated. Next, we characterized the potential interactions between the factors (i.e. between either a pair of RBPs, a pair of miRNAs or a pair of RBP and miRNA) by find-ing those pairs of factors with co-occurrence of bindfind-ing sites higher than expected by chance. Subsequently, we fur-ther interrogated some of the predicted interactions, and showed that the co-localization of the following pairs of
factors have a functional effect: HuR and MSI1, PUM1(2) and TIA1; and miR-148b and HNRNPC. We also con-firmed that transcripts where the sites of PUM1(2) and its interacting miRNA form a stem-loop are more stabilized upon PUM1(2) depletion. Finally, we used logistic regres-sion with features compiled from the counts of sites of fac-tors and dinucleotides to accurately predict the stability and steady-state abundance of mRNAs.
MATERIALS AND METHODS Mapping RBP binding sites
To map the binding sites of RBPs, we downloaded 103 po-sition frequency matrices (PFMs) that correspond to 85
hu-man RBPs from the RNAcompete paper (7). These PFMs
(which are of length seven or eight) are generated from the alignment of top 10 7-mers determined using all data (i.e. both setA and setB of RNAcompete pool). Rather than us-ing these top 10 7-mers directly, we generated the top 10 n-mers from the PFMs. In this way, we were able to scan for motifs that are longer than seven. An example is the FXR1 RBP for which the PFM inferred by RNAcompete is of length eight. By using the top 10 8-mers in our motif search, we can represent the binding preferences to all eight posi-tions of this PFM. In addition to RNAcompete motifs, we downloaded the motifs (consensus motifs and the top 10 n-mer when a PFM is available) for the following well-known
RBPs from RBPDB database (17): HNRNPAB, PUM1,
PUM2, ELAVL2, KHSRP, ZFP36, AUF1 and CUGBP. We
downloaded human 3′UTRs from UCSC Genome Browser
(on 16 February 2014) and determined the genome-wide binding sites of each RBP by finding matches to its top 10
n-mers or consensus motifs on human 3′UTR sequences.
We downloaded CLIP-seq and PARCLIP data for a list of RBPs (HuR, FMR1, FUS, FXR1, FXR2, HNRNPA1, HNRNPA2B1, HNRNPC, IGF2BP1-3, LIN28, PUM2, QKI, SRSF1, TDP-43, TIA1, TIAL1) from doRINA
database (18). For HuR, there exists four CLIP datasets
where three of them are from HEK293 cells and one of them is from HeLa cells. We took the union of three CLIP ex-periments in HEK293 cells. We also downloaded the scores and rank percentiles associated with each CLIP-determined peak. In addition to these RBP specific CLIP datasets,
we downloaded gPARCLIP-determined peaks (3).
gPAR-CLIP dataset contains genome-wide protein-occupied re-gions bound by any RBP in HEK293 cells. However, the identity of a particular RBP that binds to a region is un-known.
We first intersected the peaks identified with CLIP or
gPARCLIP with human 3′UTRs. To correct for the
back-ground binding bias in CLIP-based techniques as identified
by Friedersdorf et al. (19), we excluded parts of peaks that
overlap with regions that correspond to background bind-ing. In summary, for each putative RBP site we keep track of the following information: (i) the start and end position; (ii) a flag showing whether the site is located in a CLIP- or gPARCLIP-determined peak; and (iii) conservation score calculated as the average PhastCons score across the
mo-tif (20) (phastCons100way track downloaded from UCSC
Genome Browser) (Figure1).
by guest on March 3, 2016
http://nar.oxfordjournals.org/
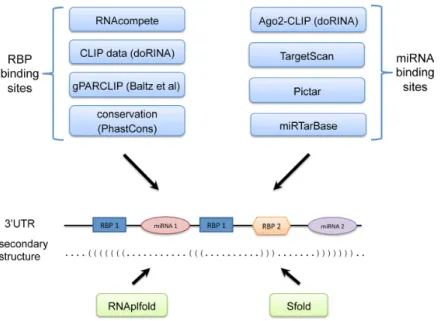
Figure 1. Mapping of RBP and miRNA binding sites on human 3′UTRs. RBP binding sites are mapped by leveraging RNAcompete PFMs, CLIP- and PARCLIP-determined peaks and PhastCons conservation scores. miRNA binding sites are mapped by combining TargetScan and PicTar predictions with
Ago-CLIP datasets and experimentally-verified interactions in miRTarBase database. Also, the secondary structure of the 3′UTRs are predicted with
RNAplfold and Sfold. In particular, accessibility of a site is calculated by RNAplfold, and the probability of a site to form a stem-loop by binding to another site is calculated by Sfold.
Scanning for HuR and PUM1(2) sites
We determined the HuR sites by scanning with RNAcompete top 10 n-mers (i.e. RNAcompete IDs RNCMPT00032,112,117,136,274). RNAcompete has not been performed for PUM1 or PUM2; however it has been performed for their Drosophila homolog Pumilio. We used the Pumilio motif as a substitute for PUM1(2) motif as they all belong to the same protein family (i.e. PUF family). The members of the PUF family contain a highly conserved RNA binding domain (RBD) known as the PUF domain
(21), and the RBDs of PUM1 and PUM2 are 80 and 78%
amino acid positions identical to Pumilio, respectively. Indeed, the RNAcompete motif inferred for Pumilio is very similar to the PUM1 or PUM2 motif found by in vivo studies such as RIP-Chip (22,23) or CLIP (6). Among the multiple RNAcompete motifs inferred for Pumilio, we chose the one (i.e. RNCMPT00104) that is most consistent with in vivo binding data (Supplementary Table S6 of RNAcompete paper). Additionally, we also used the consensus motifs that we downloaded from RBPDB for PUM1 and PUM2. Because PUM1 and PUM2 have similar binding specificities, we also used the PUM1 motif to scan for PUM2 sites and vice versa. As such, hereafter, we use PUM1(2) to represent the union of PUM1 and PUM2 binding sites.
Mapping miRNA binding sites
To determine miRNA binding sites, we downloaded the tar-get sites predicted by Tartar-getScan (version 6.2) and PicTar
methods (8,9) (PicTar predictions were downloaded on 20
February 2014 from doRINA database). We downloaded AGO1-4 PARCLIP, AGO2 CLIP-seq and AGO2-MNase PARCLIP datasets from doRINA database and removed
background binding bias as described in the previous sec-tion. We also downloaded experimentally verified miRNA
targets from miRTarBase database (24) (version 4.5). The
interactions in miRTarBase database specify only whether a miRNA interacts with an mRNA without providing the exact position of the target site on the mRNA. Therefore, we assumed that a target miRNA site on an mRNA is sup-ported by miRTarBase if that miRNA–mRNA interaction exists in the database. For each putative miRNA binding site, we keep track of the following: its start and end posi-tion, a flag showing whether the site is supported by Tar-getScan, PicTar or both, a flag showing whether it is sup-ported by miRTarBase and a flag whether the site is located
in CLIP- or PARCLIP-determined peaks (Figure1).
Compilation of datasets related to post-transcriptional regu-lation
The following datasets were downloaded from the supple-mentary material of the corresponding papers:
!
Knockdown datasets: log fold changes (LFCs) of tran-script abundance upon HuR knockdown in HEK293 andHeLa cells from (15) and (25), respectively.
!
Transfection dataset: log fold changes (LFCs) of tran-script abundance upon transfection of miR-148b inHeLa cells from (26,27).
!
Zhao dataset: the effect of human 3′UTR segments(160-nts long) on mRNA stability and steady-state mRNA abundance in BEAS-2B human bronchial epithelial cells
(28).
!
Schueler dataset: mRNA half-lives measured in HEK293and MCF7 cells (29). Average of the two replicate
mea-surements is used.
by guest on March 3, 2016
http://nar.oxfordjournals.org/
The set of expressed RBPs and miRNAs can vary be-tween different cell lines. As such, it is important to consider only those factors that are expressed in the corresponding cell line for the analysis of the datasets above. We used the following sources to define the set of expressed RBPs and miRNAs in a given cell type:
!
HEK293 cells:– RBPs: quantitative mass spectrometry results (3).
– miRNAs: top 100 expressed miRNAs identified with
small-RNA sequencing (6).
!
HeLa cells:– RBPs: immunohistochemistry results from Human
Protein Atlas database (http://www.proteinatlas.org).
– miRNAs: top 100 expressed miRNAs identified with
small-RNA sequencing (25).
!
MCF7 cells:– RBPs: immunohistochemistry results from Human Protein Atlas database.
– miRNAs: top 100 expressed miRNAs identified with
small-RNA sequencing (30).
!
BEAS-2B cells:– RBPs: immunohistochemistry results from Human Protein Atlas database.
– miRNAs: top 100 expressed miRNAs identified with
small-RNA sequencing (28).
Quantitative mass spectrometry data was only available for HEK293 cells. As such, for all the other cell lines, we used immunohistochemistry results from Human Protein Atlas. We checked whether this introduces any bias by cal-culating the overlap between sets of expressed RBPs across the cell lines. We found that the set of expressed RBPs across different cell lines are largely shared indicating that the dif-ferent sources for protein expression data does not lead to any bias (Supplementary Figure S2).
Predicting the RNA secondary structure of binding sites To determine whether binding sites are accessible, we
pre-dicted RNA secondary structure of human 3′UTRs with
RNAplfold (31). Since the flanking regions can affect
sec-ondary structure, we folded the 3′UTRs together with the
upstream 200 nt-long flanking sequence from coding re-gion. Previous studies have shown that local folding with a window length of 200 and base pair span of 150 gives op-timal results compared to using other parameters or global
folding (32,33). As such, we applied local folding by
run-ning RNAplfold with the parameters −W 200 and −L 150 where ‘-W’ specifies the length of the local window and ‘-L’ restricts the maximal base pair span. We used the base pair probabilities output from RNAplfold to determine acces-sibility. Namely, we calculated accessibility as the average probability of being unpaired across the site.
As in the example of PUM1-miR-221 (or miR-222)
in-terplay (13), factors can act in cooperation by binding to
the two sides of the same stem-loop. In this way, one of the factors can allow the other factor to bind its site by chang-ing the secondary structure (i.e. accessibility) of the region. To identify similar potential cooperative interactions, we aimed to find the pairs of sites that are likely to form a stem.
We calculated the number of base pairs that can be formed between each pair of sites by considering reverse comple-mentarity only. We deemed the pairs of sites that have ≥5 base pairs as potential interactors. As one site can be reverse complementary to several other sites, we need to choose the partner site that is most likely to form a stem-loop. To define a quantitative metric for this purpose, we used SFOLD. We were unable to use RNAplfold as it only outputs the prob-ability for a base to be in paired context, whereas we also need to know where this base is paired to (and with what probability). To determine this, we used SFOLD to gener-ate 1000 sample structures from the Boltzmann distribution of all possible structures for each running window of length 200 nt. For each pair of binding sites, we considered those windows that both sites are located in, and parsed all the sampled structures of each window to calculate the average number of base pairs formed between the two sites. For in-stance, if the two sites are located at 300 and 350 nt away
from the start of the 3′UTR, we consider 200-nt long
run-ning windows that start from positions 150 to 300. The fi-nal estimate is the average of 150 values that are themselves averages calculated from the number of base pairs in 1000 structures. Thus, the final value reflects the probability that the two sites will form a stem.
To determine the pairs of sites that could form a stem-loop, we sorted the potential interacting sites (determined by reverse complementarity only) according to SFOLD-calculated probabilities, and filtered out those that have a probability less than 0.1. We started from the top of this list and selected pairs of sites iteratively. We ignored alternative possible interacting sites of an already selected site. For
ex-ample, let’s assume that a particular 3′UTR contains three
sites labeled as A, B and C, and each pair of these sites can form a stem-loop with more than ≥5 bp. Let’s also assume that the Sfold-calculated probabilities for these pairs are as follows: A-B: 0.3, B-C: 0.6, A-C: 0.4. With our procedure, B-C pair would score the highest and get selected, whereas A-B and A-C pairs would be ignored as B and C are already considered.
Testing for significance
We used one-tailed Mann–Whitney U test (also called Wilcoxon rank-sum test) to compare various properties (e.g. log fold change, stability) of sets of transcripts (see ‘Re-sults’ section), and we used Wilcoxon signed-rank test to compare the area under the Receiving Operating Character-istic curve (AUROC) values of different logCharacter-istic regression models.
Motif co-occurrence analysis
Our co-occurrence analysis is based on previous work by
Jiang et al. (16). Though, we extended this approach with
two main improvements to deal with problems that can arise due to (i) factors that have similar binding motifs and (ii) homotypic clusters of binding sites. The first problem oc-curs because sites of factors that have similar binding motifs (e.g. HuR and AUF1) tend to cluster together artificially. To avoid this bias, we identified the factors with similar binding motifs (i.e. PFMs and consensus motifs for RBPs and seed
by guest on March 3, 2016
http://nar.oxfordjournals.org/
sequences for miRNAs) using the TomTom tool with
de-fault parameters (34). For each factor, we ignored the set of
factors that are found to have similar binding motifs. The second problem is specific to factors whose sites can oc-cur in homotypic clusters. For example, we expect to find several overlapping HuR sites in an U-rich region. Naive counting can result in very high number of co-occurrences with other factors that have sites in the same window. As such, we pre-processed the sites so that only one (most up-stream) of the overlapping sites of a factor is kept. Then, for each site of a factor, we calculated the number of neigh-boring sites of other factors in each 50-nt-window within 200-nt on either side of the site. We calculated an empiri-cal P-value by comparing this count to the distribution of counts obtained when factor identities (keeping the site po-sitions fixed) are shuffled 1000 times. We performed the per-mutation test three times by employing different types of shuffling: (i) shuffling the factor identities of sites that are lo-cated on the same chromosome; (ii) classifying the sites into three groups based on AU-content (i.e. <3, ≥3 and <6, ≥6 ) and shuffling the factor identities of the sites in the same group; (iii) classifying the sites into 10 groups according to
their relative position within the 3′UTRs and shuffling the
factor identities of the sites in the same group (see (16) for
more details). We converted P-values to q-values to correct
for multiple testing (35), and defined interacting factors as
those for which there is at least one window (among the 20 windows) with q-value <0.01 from all of the three permu-tation tests.
Analysis of competition effects
We defined two sites as overlapping if they share at least one position in common. Based on this definition, we clas-sified the mRNAs that contain a binding site for a factor of interest into two groups. The mRNAs where all the sites of the factor of interest are overlapping with sites of other factors are classified in the competition group. The mRNAs that have at least one non-overlapping site for the factor of interest are classified in the no-competition group.
Predicting stability and expression using logistic regression To run logistic regression with L2 regularization, we used
the glmnet package (36) with alpha parameter set to 0.
Within each cross-validation run, we ran the cv.glmnet func-tion to determine the optimal lambda (i.e. regularizafunc-tion constant) value.
Experimental procedures
Cell culture. Human Embryonic Kidney 293T Cells (HEK293T) were purchased from ATCC (CRL-3216), and cultured according to the guidelines provided. In short, cells
were maintained at 37◦C at 5% CO2in Dulbecco’s Modified
Eagle’s Medium (DMEM), high glucose (4500 mg/l), sup-plemented with Penicillin (100 units/ml), Streptomycin (100 !g/ml), Glutamine (2 mM) and 10% heat inactivated fe-tal calf serum. Trypsin-ethylenediaminetetraacetic acid so-lution was used to dissociate the cells to subcultivate the cells in a 1:8 ratio, every 3-4 days (all materials were pur-chased from Gibco, Life technologies).
siRNA transfection and RNA isolation. Smartpool siRNA’s were purchased from Dharmacon/GE health-care. Three different Smartpools were used: Pumilio1 pool (cat no: M-014179-01), Pumilio2 pool (cat no: M-014031-00) and a non-targeting control smartpool (cat no: D-001206-13). Transfections were performed using Lipofectamine2000 (Life technologies) according to the manufacturer’s recommendations. siRNA pools for Pumilio 1 and Pumilio 2 were mixed and diluted to a final concentration of 50nM and transfected overnight in a 24 wells culture plate. Cells were incubated for 48 h, thereafter lysed in Trizol Reagent (Life technologies). RNA was isolated using the RNeasy Mini Kit (Qiagen, cat no: 74104) according to the manufacturer’s instructions. An on-column DNA digestion was also performed to eliminate any genomic DNA contamination (Qiagen cat no: 79254). RNA concentration and purity was assessed using a NanoDrop1000 (NanoDrop Products). RNA integrity number (RIN) was assessed using a BioAnalyzer (Agilent Technologies), all RNA’s used had a RIN value of 10.
Illumina human HT-12 v4 microarray. Genome-wide gene expression was assessed using the Illumina Inc. Human HT-12 v4 Bead Chip platform. Arrays were performed by AROS Applied Biotechnology A/S (Aarhus, Denmark) ac-cording to the manufacturer’s instructions. Each array con-tains specific probes for more than 47 000 human tran-scripts. Bead-Chips were scanned using the iScan system (Ilumina Inc.) and the fluorescence intensities were ana-lyzed and annotated using GenomeStudio software
(Ilu-mina Inc.). Quantile normalized and log2transformed data
was used as input to the lmFit function of the limma
pack-age (37) to calculate log fold changes. Raw intensity files are
deposited in GEO database.
cDNA synthesis and qRT-PCR. cDNA was made us-ing M-MLV-Reverse Transcriptase and random primers according to the manufacturer’s instructions (Promega). qRT-PCR was performed using SYBR-select Master-mix (Applied Biosystems/Life Technologies) on a Biorad CFX384 system. Gene-specific primer-sequences were
de-rived from the online Primerbank (http://pga.mgh.harvard.
edu/primerbank/, (38) ). Primer oligonucleotides were syn-thesized by Sigma Aldrich. The list of primers are avail-able in Supplementary Tavail-able S1. The expression changes of PUM1, PUM2 and three known targets of PUM1 or PUM2 (i.e. COX10, CDKN1B, SDAD1) can be found in Supple-mentary Figure S2.
RESULTS
Accessibility and conservation scores of HuR and PUM2 binding sites
One approach to map the binding sites of an RBP is to scan the genome with a pre-determined motif or PWM. How-ever, RBPs bind to only a subset of these matches in vivo. Therefore, it would be useful to find additional features that can help in the identification of the true binding sites. In this analysis, our goal is to assess whether accessibility or se-quence conservation can distinguish the RBP binding sites
by guest on March 3, 2016
http://nar.oxfordjournals.org/
that are located in CLIP-determined peaks from other po-tential sites that are not located in CLIP-determined peaks. For these studies, we focused on two well-characterized pro-teins: HuR and PUM2.
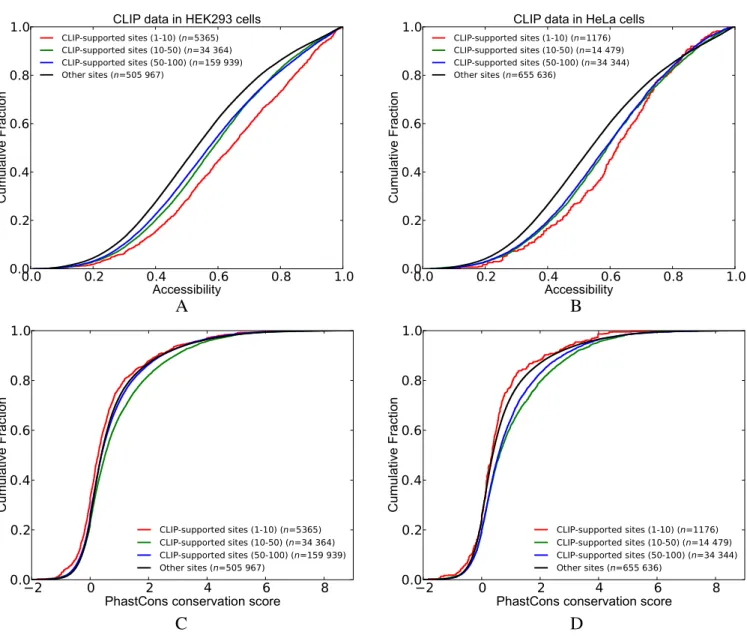
First, we classified the transcripts into two groups based on whether they reside in CLIP-determined peaks (i.e. CLIP-supported sites) or not (i.e. other sites). Next, we compared the cumulative distribution of accessibility and conservation scores between these two groups (see Figures
2and3). In accordance with previous literature (39), we
ob-served that the CLIP-supported HuR sites are more
accessi-ble when CLIP data from either HEK293 cells (6) or HeLa
cells (25) is taken into consideration. Furthermore,
group-ing CLIP-supported sites accordgroup-ing to their peak score (i.e. percentiles downloaded from doRINA database) revealed that sites that reside in peaks with higher scores are more accessible as compared to other CLIP-supported sites
(Fig-ure2A and B). We repeated these analyses to compare the
PhastCons conservation scores of binding sites (Figure2C
and D). Interestingly, for both HEK293 and HeLa cells, the CLIP-supported sites with high scores (in the highest 10% percentile) are less conserved than the sites that are not CLIP supported. On the other hand, CLIP-supported
sites within 10thto 50thpercentiles are more conserved than
other sites (i.e. not CLIP supported) in both HEK293 and HeLa cells.
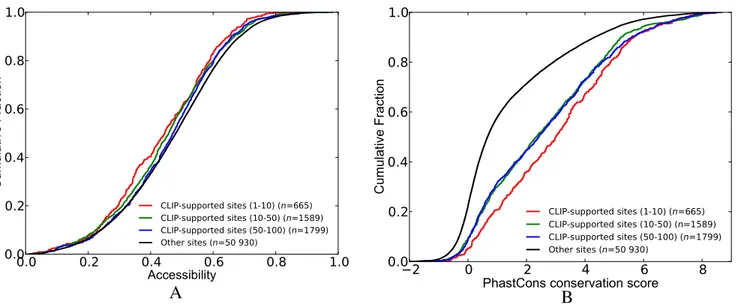
We observed that CLIP-supported sites of PUM1(2) are less accessible as compared to other sites. In fact, when we separate the CLIP-supported sites according to their peak scores, we found that sites located in high scoring peaks (percentile 1–10) are less accessible compared to sites
lo-cated in low scoring peaks (percentile 50–100) (Figure3A).
This result is surprising as PUM1 is known to bind to
single-stranded motifs (40), whereas there is no previous literature
regarding a structural preference for PUM2 with mRNAs. However since PUM1 and PUM2 possess nearly identical RBDs, these studies suggested that PUM2 will also pre-fer accessible sites. Subsequent comparison with conserva-tion scores enabled us to identify that the sites located in high scoring peaks are more conserved than other CLIP-supported sites or sites that are not CLIP-CLIP-supported
(Fig-ure3B).
Analysis of RBP knockdown datasets
To gain more insight into the functional effect of the distinct properties of individual binding sites (e.g. supported by CLIP, overlapping with sites of other factors), we compiled knockdown datasets of HuR and PUM1(2). We down-loaded log fold expression changes (LFCs) of transcripts
upon HuR depletion in HEK293 and HeLa cells from (15)
and (25), respectively. Hereafter, we name these knockdown
datasets as Mukharjee and Lebedeva datasets, respectively. Mukharjee et al. have shown that transcripts possessing solely intronic HuR sites still show reduced expression upon
HuR depletion in HEK293 cells (15). Since the aim of our
study is to investigate the function of HuR sites in 3′UTRs,
we filtered out those transcripts containing intronic HuR sites throughout the following analyses. This approach lim-its the hidden effect of intronic sites of HuR in our analy-sis. In the absence of existing genome-wide changes of
ex-pression upon PUM1(2) depletion, we reduced PUM1 and PUM2 expression in HEK293 cells using siRNAs, and mea-sured the changes in genome-wide gene expression.
We analyzed each of these knockdown datasets to
deter-mine whether a correlation exists between LFCs and 3′UTR
length, and between LFCs and gene expression levels (i.e. expression in mock transfected cells). For Mukharjee
dataset, the Spearman correlation of LFCs versus 3′UTR
length and LFCs versus expression levels were −0.06 and −0.11, respectively. Interestingly, we observed a much larger
correlation when comparing LFCs with 3′UTR length (R
= −0.22) and LFCs with expression levels (R = 0.14) in the Lebedeva dataset. The correlation coefficients in PUM1(2) knockdown dataset were 0.09 and −0.03 for
com-parisons with 3′UTR length and expression levels,
respec-tively. Lastly, we also found that the Spearman’s rank corre-lation coefficient of the LFCs between the two HuR knock-down datasets is only 0.1.
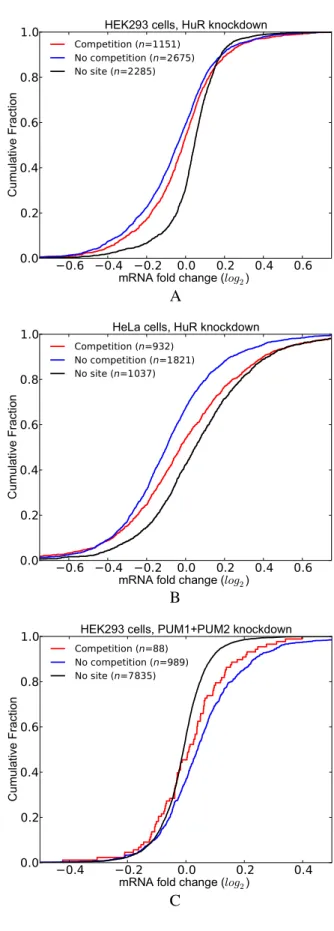
mRNAs with CLIP-supported sites show greater expres-sion effects upon RBP knockdown. To examine the ef-fect of CLIP-supported sites, we classified the transcripts into three groups: (i) those that have at least one CLIP-supported HuR site (CLIP); (ii) those that have one or more predicted HuR sites but none of them are CLIP-supported (other); and (iii) those lacking HuR sites (no site). In Figure
4, we plotted the cumulative distribution of transcript LFCs
following stratification according to these groups. If the no site group was deemed as baseline, we observed for both knockdown datasets that transcripts in the CLIP group were significantly more destabilized upon HuR depletion
than transcripts in the other group (Figure4A and B). As
HuR is known to stabilize the expression levels of target mRNAs, these results show that CLIP-supported HuR sites more accurately predict changes in gene expression, and dis-play greater effects than other (non-CLIP-supported) sites. Next, we assessed whether our categorization of mRNAs in the above analysis results in groups with distinct
distribu-tions of 3′UTR length or expression levels. Indeed, for both
knockdown datasets, we observed that the transcripts in the CLIP group have longer 3′UTRs as compared to the other
groups. Subsequent comparisons of these groups in terms of expression levels yielded smaller differences compared to
the differences we observed for 3′UTR length. The
Mukhar-jee dataset revealed that the CLIP group have the highest expression levels while the Lebedeva dataset revealed that the CLIP group have lower expression levels compared to the no site group. To show that our findings are still evident
upon removing 3′UTR length and expression levels effects,
we used linear regression to predict LFCs using these two factors as features. Then, we replotted the CDF plots in
Figure4using the residuals of this model (Supplementary
Figure S3). Importantly, we observed that the transcripts in the CLIP group still display significantly more effect com-pared to the other groups in the Mukharjee dataset (Sup-plementary Table S11A). This difference in destabilization between the CLIP group and the other groups became sig-nificantly smaller for the Lebedeva dataset (Supplementary Table S11B).We indeed anticipated a larger change between the analysis with LFCs and residuals for the Lebedeva dataset due to larger positive and negative correlations
by guest on March 3, 2016
http://nar.oxfordjournals.org/
A
B
C
D
Figure 2. Comparison of the cumulative distribution of accessibility and conservation scores between CLIP-supported and not CLIP-supported sites (i.e. other sites) of HuR. CLIP-supported sites are classified into different groups based on the scores of the peaks that they are located in (A and B) show the accessibility scores where the CLIP dataset from HEK293 and HeLa cells was used, respectively. Similarly, (C and D) show Phastcons conservation scores. (See Supplementary Table S2 for P-values).
tween LFCs versus 3′UTR length and expression levels. In
fact, when we compare our results between the two
knock-down datasets before the removal of 3′UTR length and
ex-pression levels effects, we see that the difference between the groups CLIP and other, and the difference between the groups CLIP and no site are more pronounced in the Mukharjee dataset. One explanation for this observation could be the small concordance between the two knock-down datasets. Another reason could be the existence of only a single HuR CLIP dataset in HeLa cells compared to three datasets in HEK293 cells. This might have resulted in a more comprehensive set of sites in HEK293 cells. Indeed, we found that 3865 transcripts that have CLIP-supported sites based on HEK293-CLIP data do not have any CLIP-supported site according to HeLa-CLIP data. When we
plotted Figure 4B using HEK293 CLIP data rather than
HeLa CLIP data we observed a much larger difference
be-tween the CLIP group and the other groups, and this dif-ference is still present when we plot the same figure with residuals (Supplementary Figure S4A and B). In order to have a more robust definition of HuR-regulated transcripts we opted to utilize the HEK293 CLIP data for both knock-down datasets for subsequent analyses.
We repeated the above analysis with PUM1(2)
knock-down data (Figure 4C). PUM1(2) is known to decrease
the stability of its mRNA targets. As such, the depletion of PUM1(2) should result in increased expression of target mRNAs. Similar to our observations with HuR, transcripts with CLIP-supported sites displayed greater effects com-pared to other transcripts. This observation still holds true when we re-plotted the CDFs using the residuals that we get from the regression model fit to LFCs of the PUM1(2) dataset. (Supplementary Figure S3C, Supplementary Table S11C).
by guest on March 3, 2016
http://nar.oxfordjournals.org/
A
B
Figure 3. Comparison of the cumulative distribution of accessibility and conservation scores between CLIP-supported and not CLIP-supported sites (i.e. other sites) of PUM1(2). CLIP-supported sites are classified into different groups based on the scores of the peaks that they are located in. (A) Accessibility. (B) PhastCons conservation scores. (See Supplementary Table S3 for P-values).
mRNAs with competitive sites show less effect upon RBP knockdown. So far, our analyses have focused on bind-ing sites occupied by a sbind-ingle RBP. However, transcripts are known to be occupied by several RBPs and miRNAs concurrently. Here, we assessed the effect of competition of HuR and PUM1(2) with other factors. We assumed that competition exists for those RBP sites (HuR or PUM1(2)) that overlap with sites of other factors at one or more posi-tions.
To examine the effect of competition in the HuR knock-down dataset, we classified the transcripts into three groups: (i) transcripts that have at least one CLIP-supported HuR site that is not overlapping with any other site (no competi-tion); (ii) transcripts that have at least one CLIP-supported HuR site but the HuR sites including the CLIP-supported ones are overlapping with sites of other factors (competi-tion); and (iii) transcripts that have no HuR site. Similar to the previous analysis, we initially filtered out those
tran-scripts that contain intronic HuR sites. Figure5shows that
the transcripts lacking competition for binding (no competi-tion) display increased destabilization after HuR depletion, as compared to the transcripts in the competition group. Im-portantly, this observation holds true for HuR knockdown
data from both HEK293 and HeLa cell lines (Figure 5A
and B).
Subsequently, we repeated this analysis with the
PUM1(2) knockdown dataset. Figure 5C compares the
transcripts in the competition and no competition groups with respect to the transcripts lacking PUM1(2) binding site. These analyses revealed that transcripts in the no competition group are more stabilized upon depletion of PUM1(2), suggesting that competition with other factors decreases the likelihood that PUM1(2) will bind to target sites. Overall, these studies addressing the consequences of a specific reduction in HuR or PUM1(2) expression consistently indicate that the presence of overlapping
binding sites for other competing factors results in distinct functional outcomes.
When we replotted the CDFs in Figure5with residuals,
we observed the same relations between the competition and no competition groups. (Supplementary Figure S5, Supple-mentary Table S13). The P-value of the Mann–Whitney U test comparing the competition and no competition groups is slightly greater than the significance threshold (i.e. 0.06) for PUM1(2) knockdown dataset. This is likely due to the small sample size of the competition group. We further
ana-lyzed the effect of 3′UTR length and expression levels in this
dataset by sampling transcripts with replacement from the no competition group to match the 3′UTR length and
ex-pression levels of the transcripts in the competition group. When we repeated the sampling 1000 times and calculated the P-values using Mann–Whitney U test, a significant dif-ference was observed in 989 cases showing that the two groups show distinct LFC distribution (i.e. empirical P-value 0.011).
Analysis of co-localization of binding sites
We set out to determine whether sites of a pair of factors co-localize within a certain distance more often than can be expected by chance. Jiang et al. performed a similar analy-sis between five RBPs and all miRNAs. Using an improved approach (See ‘Materials and Methods’ section), we ex-tended this analysis to look at the interactions between a set of 7 RBPs and 16 miRNAs (Supplementary Table S18) with all the factors (i.e. all RBPs and miRNAs). We se-lected this set of RBPs and miRNAs as they have previously been shown to interact with other factors, and/or the con-sequences of modulating their expression on genome-wide transcript abundance has been tested. To determine the fac-tors whose sites co-localize with the sites of a factor of inter-est, we counted the number of neighboring sites in four 50 nt windows upstream or downstream of each site of a factor
by guest on March 3, 2016
http://nar.oxfordjournals.org/
A
B
C
Figure 4. Comparison of the effect of RBP depletion on transcripts that contain CLIP-supported RBP sites against those that do not contain CLIP-supported RBP sites. X-axis shows the LFCs of transcripts upon the depletion of the RBP of interest. (A) HuR knockdown data in HEK293 cells. (B) HuR knockdown data in HeLa cells. (C) Double knockdown of PUM1 and PUM2 in HEK293 cells. (See Supplementary Table S4 for P-values).
A
B
C
Figure 5. Functional outcome of the competitive effects of other factors on RBP binding and function. (A) HuR knockdown data in HEK293 cells. (B) HuR knockdown data in HeLa cells. (C) Double knockdown of PUM1 and PUM2 in HEK293 cells. (See Supplementary Tables S5 for P-values).
by guest on March 3, 2016
http://nar.oxfordjournals.org/
of interest. We compared this number to the average num-ber of co-occurrences calculated from shuffled data (details of the shuffle procedure are described in the ‘Materials and Methods’ section).
We classified the factors as interacting if there is at least one window (among the eight windows) with a q-value <0.01 from all of the three permutation tests. Based on this definition, we found that RBPs and miRNAs typically
in-teract with many other factors. As an example, Figure 6
shows the enrichment ratios for factors that interact with PUM1(2) in each window (Enrichment ratios of other fac-tors are available in Supplementary Figures S10-S31). As expected, factors with similar binding motifs (e.g. members of the same miRNA family or RBPs that bind to similar motifs) have similar profiles and are clustered together. We discovered that PUM1(2) sites co-localize with sites of sev-eral miRNAs. Among these are miR-221 and 222 which have been previously found to cooperate with PUM1(2)
(13). Additionally, miR-374a(b) and miR-99a(b) sites are
significantly over-represented near PUM1(2) sites. Overall, miRNAs that were found to interact with PUM1(2) dis-played higher enrichment ratios than RBPs. Also, enrich-ment ratios of miRNAs vary significantly across the wdows; whereas they remain consistent for RBPs. Further in-vestigation of other factors such as HuR and PTBP1 reveals several interacting factors the majority of which are miR-NAs. In contrast, the RBPs HNRNPL, QKI, IGF2BP2 and IGF2BP3 were characterized by a relatively small num-ber of interactions. miRNAs also interact with a large number of other factors, and the scale of over- or under-representation is larger compared to RBPs (enrichment ra-tios and q-values are available in Supplementary Table S19-20).
Next, we utilized the knockdown datasets to investigate some of these interactions in further detail for PUM1(2) and HuR.
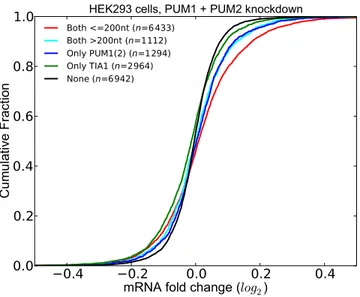
PUM1(2) have cooperative interactions with other RBPs and miRNAs. Among the factors that are predicted to in-teract with PUM1(2), we chose to investigate the inin-teraction with TIA1, as TIA1 is a well-established repressor of tar-get mRNAs. Given that both PUM1(2) and TIA1 serve as repressors, this enabled us to test whether transcripts con-taining sites for both factors have significantly lower expres-sion compared to transcripts that have site(s) for only one of the these factors. We also considered the effect of the dis-tance between the PUM1(2) and TIA1 sites by distinguish-ing the transcripts where the two sites are located within 200
nt. As shown in Figure7, following PUM1(2) knockdown,
we assessed the differential expression profile of transcripts grouped according to the presence of PUM1(2) and TIA1 sites, taking into account those PUM1(2) and TIA1 sites that are supported by CLIP or gPARCLIP datasets. Indeed, the set of transcripts where PUM1(2) and TIA1 sites are lo-cated within 200 nt show the greatest increase in expression upon PUM1(2) depletion. When the distance between the PUM1(2) and TIA1 site is >200 nt, this effect disappears. In fact, there is no statistically significant difference between the LFCs of these transcripts and the transcripts that have only PUM1(2) sites. These results indicate that the potential interaction between PUM1(2) and TIA1 occurs when their
sites are proximal to one another. We observed the same results when we repeated the analysis with residuals (Sup-plementary Figure S6).
PUM2 has previously been found to be interacting with
miRNAs (13,16). Here, we assessed whether these
inter-actions can be recovered with our compendium of bind-ing sites in our experimentally generated dataset where PUM1(2) expression levels were decreased. We defined the interacting miRNAs as those that have a significant q-value within 200 nt (upstream or downstream) of the PUM1(2) site. We then assessed the effect of co-occurrence of sites of these miRNAs with PUM1(2) sites when PUM1 and PUM2 are depleted. We classified the transcripts into five groups:
(i) those that do not have any PUM1(2) or miRNA sites (None)
(ii) those that contain at least one CLIP-supported PUM1(2) site but do not contain any site of an inter-acting miRNA (Only PUM1(2))
(iii) those that contain at least one interacting miRNA site but do not contain any PUM1(2) sites (Only miRNA) (iv) those that contain at least one CLIP-supported
PUM1(2) site and at least one site of an interacting miRNA (Both (not stem-loop))
(v) those that contain at least one CLIP-supported PUM1(2) site and at least one site of an interact-ing miRNA with the additional constraint that the PUM1(2) site forms a stem-loop with the miRNA site (Both (stem-loop)) (See ‘Materials and Methods’ for details on how we predict stem-loops).
Figure 8 shows the comparison of the distribution of
LFCs for these five sets of transcripts. We discovered that transcripts in the Both (stem-loop) group have signifi-cantly higher LFCs as compared to those in the Both (not stem-loop) group, the Only PUM1(2) group and the Only miRNA group. Importantly, the difference between the LFCs of the groups Only PUM1(2) and Both (not stem-loop) is not significant, indicating that the functional effect of co-occurrence of PUM1(2) and interacting miRNAs is only seen when their sites are located in a stem-loop. The same results are obtained when we repeated the analysis with residuals (Supplementary Figure S7) These results sug-gests that the cooperation of PUM1(2) and miRNAs is a widespread phenomenon.
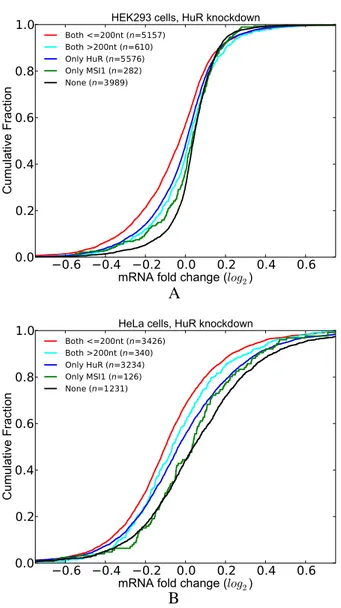
HuR have potential cooperative interactions with MSI1. Our assessment of the co-occurrence analysis for HuR (Supplementary Figure S4) revealed MSI1 as an RBP whose sites significantly co-occur nearby HuR sites. Since MSI1 is known to increase the stability of its target mR-NAs (i.e. similar to HuR), we sought to determine whether this co-occurrence has a functional effect using HuR knock-down datasets. For this purpose, we classified the transcripts into five groups based on whether they contain a HuR or MSI1 site. We then used the HuR knockdown datasets to compare the LFCs of the transcripts in these groups. Figure
9A and B show the distribution of LFCs upon HuR
deple-tion in HEK293 and HeLa cells, respectively. These studies revealed that transcripts that contain a MSI1 site within 200 nt of the HuR site are more destabilized upon HuR
by guest on March 3, 2016
http://nar.oxfordjournals.org/
200 150 100 50 50 100 150 200 miR−99b miR−99a miR−361−5p miR−374a miR−374b miR−21 miR−33a miR−101 miR−183 miR−421 miR−181a miR−181c miR−590−3p miR−425 miR−186 miR−340 miR−222 miR−221 miR−32 miR−25 miR−92a miR−34a HNRPLL HNRNPL PABPN1 SART3 PABPC1 PABPC4 IGF2BP2 IGF2BP3 SFPQ PTBP1 U2AF2 RBM3 MSI1 QKI KHDRBS1 AUF1 ELAVL2 ZCRB1 DAZAP1 MATR3 HuR ZC3H14 CPEB2 RALY TIA1 HNRNPCL1 HNRNPC CPEB4 miR−107 miR−196a miR−196b miR−148b miR−148a miR−96 miR−182 miR−218 miR−128 miR−27a miR−27b miR−10a miR−10b miR−18a miR−192 miR−23b RBMS1 miR−93 miR−20a miR−17 miR−106b miR−19b miR−19a miR−26a miR−26b miR−130b miR−301a miR−301b miR−130a miR−30b miR−30d miR−30c miR−30a miR−30e −1 0 0.5 1 log(ratio)
Figure 6. Co-occurrence of PUM1(2) sites with sites of other factors. Each row is a potential interacting factor and each column is a window. The heat map shows log-transformed enrichment ratios that are calculated as (the number of neighboring binding sites in a window/expected number of sites determined with shuffling). Minimum ratio across the three shuffle types is displayed. Row clustering is performed with hierarchical agglomerative clustering.
Figure 7. Co-occurrence of PUM1(2) and TIA1 sites have a functional effect. Transcripts that have at least one pair of PUM1(2) and TIA sites within 200 nt have significantly higher LFCs upon PUM1(2) depletion. (See Supplementary Tables S6 for P-values).
tion. Our results from both datasets indicate that the pres-ence of a MSI1 site proximal to that of HuR increases this effect. These observations were maintained when the
anal-Figure 8. Effect of co-occurrence of PUM and miRNA sites to differen-tial expression of transcripts when PUM1 and PUM2 are knocked down. Transcripts where PUM1(2) and miRNA sites are predicted to be in coop-eration with each other (Both (stem-loop)) have significantly higher LFCs compared to other transcripts.(See Supplementary Table S7 for P-values).
ysis was performed with residuals (Supplementary Figure S8).
by guest on March 3, 2016
http://nar.oxfordjournals.org/
A
B
Figure 9. Co-occurrence of nearby HuR and MSI1 sites have a functional effect. Transcripts that have at least one pair of HuR and MSI1 sites within 200 nt have significantly higher LFCs upon HuR depletion. (A) HuR knockdown in HEK293 cells. (B) HuR knockdown in HeLa cells. (See Supplementary Tables S8 for P-values).
miR-148b have potential cooperative interactions with HN-RNPC. We repeated the above analysis for miR-148b
using transfection data in HeLa cells (26). HNRNPC is
known to decrease the stability of its target mRNAs similar to miRNAs. We classified the transcripts into five groups based on whether they contain a miR-148b or HNRNPC site. We then compared the distribution of LFCs of these
sets of transcripts (Figure10) Similar to our previous
obser-vations, we determined that transcripts containing an HN-RNPC site within 200 nt of the miR-148b site are more destabilized upon miR-148b transfection. These results dicated that the presence of a nearby HNRNPC site in-creases the effect of miR-148b.
Similar to our analysis of knockdown datasets, we
checked whether 3′UTR length and expression levels are
correlated with LFCs in miR-148b transfection dataset. We found a Spearman correlation of 0.04 between LFCs and
Figure 10. Co-occurrence of miR-148b and HNRNPC sites have a func-tional effect. Transcripts that have at least one pair of miR-148b and HN-RNPC sites within 200 nt have significantly higher LFCs upon miR-148b transfection. (See Supplementary Tables S9 for P-values).
3′UTR length and a correlation of −0.02 between LFCs
and expression levels. Next, we calculated the residuals of
a regression model that predicts LFCs using 3′UTR length
and expression levels. Importantly, these findings were also observed when we repeated the analysis with these residuals (Supplementary Figure S9).
Predicting stability and gene expression with a logistic regres-sion model
Next, we took into account the effect of both RBPs and miRNAs to predict transcript stability and expres-sion levels. For this, we used the following datasets: (i)
ef-fect of 3′UTR segments to mRNA half-lives and
steady-state mRNA abundance in BEAS-2B immortalized
hu-man bronchial epithelial cells (Zhao dataset, (28)); and (ii)
mRNA half-lives in HEK293 and MCF7 cells (Schueler
dataset, (29)). We sorted 3′UTR segments or transcripts
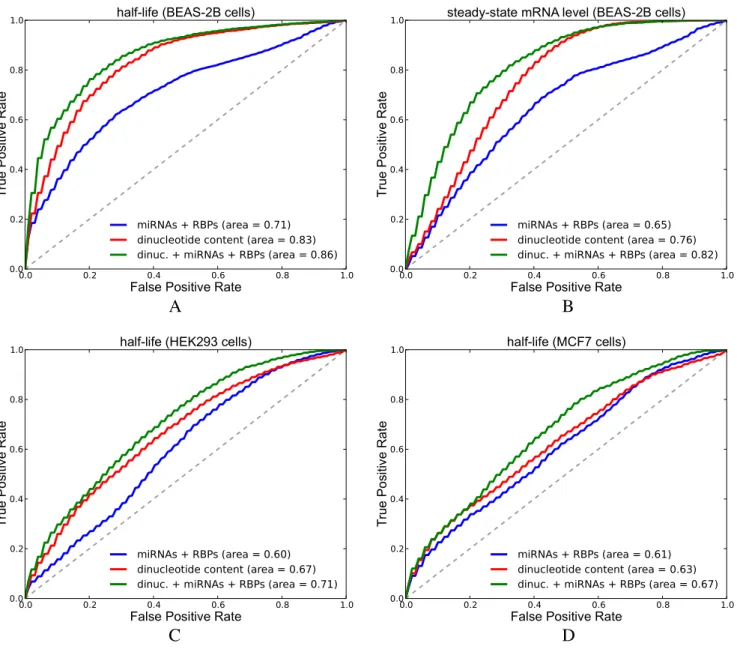
based on half-lives or abundance and filtered out those that do not have any miRNA or RBP site. We classified the top 500 transcripts as one class (stable or highly expressed) and the bottom 500 transcripts as the other class (unsta-ble or lowly expressed). We labeled the sequences in the first class with 1 and the second class with 0. Our features consist of dinucleotide counts as well as counts of factor sites where factors have been grouped as miRNAs, activa-tors and repressors. We defined the activaactiva-tors and repres-sors as sets of RBPs that are known to increase or decrease stability in literature, respectively. The activators group consisted of the RBPs HNRNPL, PABPC1, PABPC3, PABPC4, PABPC5, PABPN1, RBFOX1, HuR, IGF2BP2 and IGF2BP3, while the repressors group consisted of the RBPs CUGBP1, MBNL1, HNRNPC, KHSRP, ZFP36, AUF1, TIA1, PUM1 and PUM2. We used the glmnet pack-age to fit a logistic regression model with L2 regulariza-tion. We repeated 10-fold cross validation (CV) 10 times and plotted the interpolated area under ROC curve
(AU-ROC) of 100 curves. Figure11A and B compare the
AU-ROC curves of three models that predict half-life or
by guest on March 3, 2016
http://nar.oxfordjournals.org/
A
B
C
D
Figure 11. Results of predicting half-life and steady-state mRNA levels in Zhao and Schueler datasets. Figures show ROC curves (interpolation of 100 curves) of logistic regression models. Area shows the average of 100 AU-ROC values. (A) We predict half-life in BEAS-2B cells (Zhao dataset). (B) We predict steady state mRNA abundance in BEAS-2B cells (Zhao dataset). (C) We predict mRNA half-life in HEK293 cells (Schueler dataset). (D) We predict mRNA half-life in MCF7 cells (Schueler dataset) (See Supplementary Tables S10 for P-values from Wilcoxon sign-rank test).
state mRNA abundance in the Zhao dataset, where: (i) miR-NAs, activators and repressors are used as features (miR-NAs + RBPs); (ii) counts of 16 2-mers that represent dinu-cleotide content are used as features (dinudinu-cleotide content); (iii) the combination of features used in model (i) and (ii) are used (dinucleotide content + miRNAs + RBPs). We ob-served that dinucleotide features alone perform much bet-ter than features formed from miRNA and RBP binding sites; however, the addition of miRNA and RBP features on top of dinucleotide content features improved the predictive power of the model. Learned parameter values are shown in Supplementary Figure S32. Among the parameters that are learned from the half-life measurements in BEAS-2B cells, the parameter for activators has the highest value. The fre-quency of UU, UC and AA are among the other parameters
with highest positive values. On the other hand, the param-eter for repressors has the lowest value. miRNAs, GA, GG, AC content have negative parameter values as well. The pa-rameters learned from steady-state mRNA levels are similar except for the fact that the parameter value for activators is much smaller.
Subsequently, we repeated these analyses with half-life datasets in HEK293 and MCF7 cells (Schueler dataset) this
time calculating the features considering the 3′UTRs of the
transcripts. Figure11C and D show the ROC curves
ob-tained from the logistic regression models predicting half-life in HEK293 and MCF7 cells, respectively. For both cell types, the increase in AU-ROC between model (i) and model (ii); and between model (ii) and model (iii) was found to be significant according to Wilcoxon signed-rank test
by guest on March 3, 2016
http://nar.oxfordjournals.org/
values are 1.9E − 12 and 9.0E − 12 for HEK293 cells and 6.8E − 05 and 2.7E − 13 for MCF7 cells). Our model learned from the half-life dataset from HEK293 cells re-vealed that the parameter value for miRNAs is amongst the lowest values observed together with that of repressors, and GA/GG content (Supplementary Figure S32). In the MCF7 model, the effect of activators and repressors was rel-atively low.
We also tested whether our features simply represent a
bias of 3′UTR length. The 3′UTR segments in Zhao dataset
were all of the same length whereas the Schueler dataset
contains 3′UTRs of variable length. Predicting half-life with
only the 3′UTR length feature generated a mean AU-ROC
value of 0.545 and 0.548 in HEK293 and MCF7 cells, re-spectively. This confirmed that our features do not simply
represent 3′UTR length.
In addition to simply counting the number of binding sites as above, we also implemented more advanced fea-tures, such as: (i) using the sum of the accessibility of sites of miRNAs, activators or repressors as features; (ii) consid-ering solely gPARCLIP- or CLIP-supported RBP sites; or (iii) considering the effect of RBP and/or miRNA competi-tion by counting the sites that overlap with other factor sites as 0.5 rather than 1. However, these modifications did not markedly improve the performance of the AU-ROC, with a slight improvement observed in a few cases. This assessment can be found in Supplementary Table S21.
DISCUSSION
PTR is mediated by the interactions of RBPs and miR-NAs with target sites on mRmiR-NAs. Recent studies have pro-vided many examples where RBPs and miRNAs function through cooperative or competitive interactions with one another. Despite this fact, the majority of studies have fo-cused on a single factor of interest in isolation from other factors. In this article, we considered the effect of multiple factors concurrently. To achieve this, we mapped all RBP
and miRNA binding sites on human 3′UTRs by leveraging
existing knowledge generated through in vitro (RNAcom-pete), in vivo (CLIP, gPARCLIP) and computational meth-ods (TargetScan, PicTar). We also considered and predicted
the secondary structure of 3′UTRs using the computational
methods RNAplfold and Sfold.
First, we focused on two well-characterized RBPs, namely HuR and PUM2, and showed that sites that are CLIP-supported are more conserved compared to sites pre-dicted by PFMs and consensus motifs. In line with
previ-ous literature (39,41), we found that CLIP-supported sites
of HuR are more accessible. In contrast to the expected
preference based on the crystal structure of PUM1 (40), we
observed that CLIP-supported sites of PUM2 are less ac-cessible. One recent computational study also recovers the
same preference for PUM2 (42). Our results on PUM1(2)–
miRNA interactions indicate that PUM1(2) is often found in stem-loops. These type of cooperative interactions of PUM1(2) might explain why PUM1(2) sites are located in inaccessible regions according to computationally predicted structures.
To test whether CLIP-supported sites of RBPs displayed any difference as compared to other sites in terms of
func-tional outcome, we compiled HuR knockdown datasets from literature. Since no genome-wide knockdown dataset for PUM1(2) was available, we performed a double knock-down of PUM1 and PUM2 in HEK293 cells to deter-mine differentially expressed transcripts. Our analysis of these datasets revealed that transcripts containing CLIP-supported sites of HuR and PUM1(2) show greater differ-ential expression profiles as compared to other transcripts. To assess the effect of competitive interactions, we com-pared the LFCs of transcripts where all sites of the RBP of interest are overlapping with sites of other factors to those transcripts that possess at least one site with no overlap. For both HuR and PUM1(2), we found that sites for which there is no competition display greater expected change upon the knockdown of the RBP of interest. To find potential co-operative factors, we also tested whether sites of two fac-tors co-occur more often than expected by random chance. For this, we assessed the interactions of PUM1(2) with tar-get mRNAs, and showed that the transcripts that contain a PUM1(2) site and a site for one of the interacting miRNAs in a stem-loop have higher LFCs compared to transcripts that still contain sites of both of these factors but not in a stem-loop. We also found that there is a distance-dependent cooperative interaction between PUM1(2) and TIA1, HuR and MSI1, and miR-148b and HNRNPC.
We observed that our categorizations of transcripts in the analyses mentioned in the above paragraph results in groups
with distinct distributions of 3′UTR length and expression
levels. Thus, our observations could be affected by the ex-perimental biases related to these two features. To con-firm that we still observe the same results when we remove
the effect of 3′UTR length and expression levels, we used
these two features in a regression model to predict LFCs in knockdown/transfection datasets. When we repeated our analyses with residuals of these regression models, we ob-served the same results indicating that our hypotheses still hold when we removed the effect of these potential biases.
Finally, we trained a logistic regression with features compiled from counts of sites of miRNAs, RBPs and din-ucleotides to predict mRNA half-life and abundance. The high performance of the dinucleotide-only model is in line with 2013 DREAM5 challenge results where motif models
that consider dinucleotide content perform well (43). We
hy-pothesize that dinucleotide features capture the binding mo-tifs of RBPs or miRNAs. Importantly, we also observed that including counts of RBP and miRNAs sites improves the performance in this analysis, and we achieved a 10-fold CV AU-ROC of 0.86 in predicting half-life in BEAS-2B cells. We also considered alternative ways to compile the features: (i) counting RBP sites that are only gPARCLIP or CLIP-supported; (ii) summing the accessibility of sites; and (iii) considering the competition between the factors. However, these modifications did not increase the predictive perfor-mance. The first modification may not have improved per-formance as only 7 out of 19 RBPs that are in activators and repressors group have CLIP data. Also, counting sites with gPARCLIP support may not result in an accurate es-timate of the activity of a specific RBP as the identity of the bound RBP in a gPARCLIP-determined peak is un-known. Lastly, most of the CLIP experiments and gPAR-CLIP have been performed in HEK293 cells, whereas we
by guest on March 3, 2016
http://nar.oxfordjournals.org/
predicted transcript half-life and abundance in other cell types, such as BEAS-2B and MCF7 cells. Considering the accessibility of sites will likely improve the performance of these assessments, but is reliant on accurate mRNA sec-ondary structure prediction. While experimental techniques
can query mRNA secondary structure in vivo (44,45);
how-ever, the coverage of the resulting profiles is limited. The
re-cently developed icSHAPE technique (46) has been shown
to query the secondary structure of all four bases in mouse ES cells. icSHAPE secondary structure profiles can be uti-lized in our framework as they become available for human cell types. As such, our assumption that all RBPs and miR-NAs prefer binding to accessible regions might be inaccu-rate. It should be noted that the secondary structure pref-erences of most of the RBPs are unknown and increased knowledge regarding binding site preferences (aside from nucleotide sequence) would be highly informative.
Here, we have demonstrated the utility of a comprehen-sive collection of mapped RBP and miRNA binding sites
on human 3′UTRs. To the best of our knowledge, this is
the first study that accurately predicts transcript half-life and abundance by considering the effects of both RBPs and miRNAs. In addition, the methods presented here provide a novel framework to query cooperative and competitive in-teractions between trans-acting factors in PTR. Our results on HuR and PUM1(2) knockdown datasets indicate that the presence of multiple, yet proximal RBP and miRNA binding sites must be taken into account to fully understand the PTR of individual transcripts.
SUPPLEMENTARY DATA
Supplementary Dataare available at NAR Online. ACKNOWLEDGEMENT
We would like to thank the members of Kazan Lab for help-ful discussions.
FUNDING
The Scientific and Technological Research Council of Turkey [113E159 to H.K.]; European Union Marie Curie Career Integration Grant [631986 to H.K.]. Funding for open access charge: Marie Curie CIG [631986 to H.K.]. Conflict of interest statement. None declared.
REFERENCES
1. van der Veer,E., de Bruin,R., Kraaijeveld,A., de Vries,M., Bot,I. et al. (2013) Quaking, an RNA-binding protein, is a critical regulator of vascular smooth muscle cell phenotype. Circ. Res., 113, 1065–1075. 2. Li,X., Kazan,H., Lipshitz,H. D. and Morris,Q. D. (2014) Finding the
target sites of RNA-binding proteins. Wiley Interdiscip. Rev. RNA, 5, 111–130.
3. Baltz,A.G., Munschauer,M., Schwanh¨ausser,B., Vasile,A.,
Murakawa,Y., Schueler,M., Youngs,N., Penfold-Brown,D., Drew,K., Milek,M. et al. (2012) The mRNA-bound proteome and its global occupancy profile on protein-coding transcripts. Mol. Cell, 46, 674–690.
4. Castello,A., Fischer,B., Eichelbaum,K., Horos,R., Beckmann,B.M., Strein,C., Davay,N.E., Humphreys,D.T., Preiss,T., Steinmetz,L.M.
et al. (2012) Insights into RNA Biology from an atlas of mammalian
mRNA-binding proteins. Cell, 149, 1393–1406.
5. Ule,J., Jensen,K., Mele,A. and Darnell,R.B. (2005) CLIP:A method for identifying protein-RNA interaction sites in living cells. Methods, 37, 376–386.
6. Hafner,M., Landthaler,M., Burger,L., Khorshid,M., Hausser,J., Berninger,P., Rothballer,A., Ascano,M., Jungkamp,A.C., Munschauer,M. et al. (2010) Transcriptome-wide identification of RNA-binding protein and microRNA target sites by PAR-CLIP.
Cell, 141, 129–141.
7. Ray,D., Kazan,H., Cook,K.B., Weirauch,M.T., Najafabadi,H.S., Li,X., Gueroussov,S., Albu,M., Zheng,H. et al. (2013) A
compendium of RNA-binding motifs for decoding gene regulation.
Nature, 499, 172–177.
8. Lewis,B.P., Burge,C.B. and Bartel,D.P. (2005) Conserved seed pairing, often flanked by adenosines, indicates that thousands of human genes are microRNA targets. Cell, 120, 15–20.
9. Krek,A., Grun,D., Poy,M.N., Wolf,R., Rosenberg,L., Epstein,E.J., MacMenamin,P., Piedade,I., Gunsalus,K.C., Stoffel,M. et al. (2005) Combinatorial microRNA target predictions. Nat. Genet., 37, 495–500.
10. Kouwenhove,M.V., Kedde,M. and Agami,R. (2011) MicroRNA regulation by RNA-binding proteins and its implications for cancer..
Nat. Rev. Cancer, 11, 644–656.
11. Ho,J.J. and Marsden,P.A. (2014) Competition and collaboration between RNA-binding proteins and microRNAs. Wiley Interdiscip.
Rev. RNA, 5, 69–86.
12. Jens,M. and Rajewsky,N. (2015) Competition between target sites of regulators shapes post-transcriptional gene regulation. Nat. Rev.
Genet., 16, 113–126.
13. Kedde,M., Kouwenhove,M.V., Zwart,W., Vrielink,J. A.O., Elkon,R. and Agami,R. (2010) A pumilio-induced RNA structure switch in
p27-3′UTR controls miR-221 and miR-222 accessibility. Nat. Cell
Biol., 12, 1014–1020.
14. Jafarifar,J., Yao,P., Eswarappa,S.M. and Fox,P.L. (2011) Repression of VEGFA by CA-rich element-binding microRNAs is modulated by hnRNP L. EMBO J., 30, 1324–1334.
15. Mukherjee,N., Corcoran,D.L., Nusbaum,J.D., Reid,D.W., Georgiev,S., Hafner,M., Ascano,M.J., Tuschl,T., Ohler,U. and Keene,J.D. (2011) Integrative regulatory mapping indicates that the RNA-binding protein HuR couples pre-mRNA processing and mRNA stability. Mol. Cell, 43, 327–339.
16. Jiang,P., Singh,M. and Coller,H.A. (2013) Computational assessment of the cooperativity between RNA binding proteins and MicroRNAs in transcript decay. PLoS Comput. Biol., 9, e1003075.
17. Cook,K.B., Kazan,H., Zuberi,K., Morris,Q. and Hughes,T.R. (2011) RBPDB: a database of RNA-binding specificities. Nucleic Acids Res., 39, D301–D308.
18. Anders,G., Mackowiak,S.D., Jend,M., Maaskola,J., Kuntzagk,A., Rajewsky,N., Landthaler,M. and Dieterich,D. (2011) doRINA: a database of RNA interactions in post-transcriptional regulation.
Nucleic Acids Res., 40, D180–D186.
19. Friedersdorf,M.B. and Keene,J.D. (2014) Advancing the functional utility of PAR-CLIP by quantifying background binding to mRNAs and lncRNAs. Genome Biol, 15, R2.
20. Siepel,A., Bejerano,G., Pedersen,J.S., Hinrichs,A., Hou,M., Rosenbloom,K., Clawson,H., Spieth,J., Hillier,L.W., Richards,S.
et al. (2005) Evolutionarily conserved elements in vertebrate, insect,
worm, and yeast genomes. Genome Res., 15, 1034–1050.
21. Zamore,P.D., Williamson,J.R. and Lehman,R. (1997) The Pumilio protein binds RNA through a conserved domain that defines a new class of RNA-binding proteins. RNA, 3, 1421–1433.
22. Morris,A.R., Mukharjee,N. and Keene,J.D. (2008) Ribonomic analysis of human Pum1 reveals cis-trans conservation across species despite evolution of diverse mRNA target sets. Mol. Cell. Biol., 12, 4093–4103.
23. Galgano,A., Forrer,M., Jaskiewicz,L., Kanitz,A., Zavolan,M. and Gerber,A.P. (2008) Comparative analysis of mRNA targets for human PUF-family proteins suggests extensive interaction with the miRNA regulatory system. PLoS One, 3, e3164.
24. Hsu,S.D., Tseng,Y.T., Shrestha,S., Lin,Y.L., Khaleel,A., Chou,C.H., Chu,C.F., Huang,H.Y., Lin,C.M., Ho,S.Y. et al. (2014) miRTarBase update 2014: an information resource for experimentally validated miRNA-target interactions. Nucleic Acids Res., 42, D78–D85. 25. Lebedeva,S., Jens,M., Theil,K., Schwanh¨ausser,B., Selbach,M.,
Landthaler,M. and Rajewsky,N. (2011) Transcriptome-wide analysis
by guest on March 3, 2016
http://nar.oxfordjournals.org/