THE REAL EXCHANGE RATE AND OIL PRICES: EVIDENCE FROM IRAQ
Halah Ali Qasım QASIM
ÇANKAYA UNIVERSTY
GRADUATE SCHOOL OF SOCIAL SCIENCES
DEPARTMENT OF ECONOMICS
MSc PROGRAM IN FINANCIAL ECONOMICS
MASTER’S THESIS
THE REAL EXCHANGE RATE AND OIL PRICES: EVIDENCE FROM IRAQ
Halah Ali Qasım QASIM
ABSTRACT
THE REAL EXCHANGE RATE AND OIL PRICES: EVIDENCE FROM IRAQ
Halah Ali Qasım QASIM
M.Sc. Program in Financial Economics, Master’s thesis Supervisor: Prof. Dr. Ergun DOĞAN
June 2019, 61 pages
ARDL bounds testing methodology is used to test for co-integration between Iraqi real exchange rate and oil prices. Monthly data for the period from January 2007 to December 2015 were used for the estimations. Results were interpreted in the context of Dutch disease hypothesis, and it was found that one of the main predictions of this hypothesis, which is that rising oil prices would lead to a real appreciation, was not supported. Toda-Yamomoto (1995) approach for causality testing indicated that there was one way Granger causality between REER and oil prices. Other more descriptive evidence from annual data indicated that Iraqi economy might be showing some symptoms of Dutch disease, such as slight falls in the manufacturing and services sector GDP and employment shares.
ÖZET
REEL DOVİZ KURU VE PETROL FİYATLARI: IRAK ÖRNEĞİ
Halah Ali Qasım QASIM
Msc. Finansal Ekonomi, Yüksek Lisans Programı Tez Yöneticisi: Prof. Dr. Ergun DOĞAN
Haziran 2019 61 sayfa
Bu çalışmada ARDL Sınır Testi methodu kullanılarak Irak economisi için 2007-20015 aylık verileri ile reel doviz kuru ile petrol fiyatları arasındaki eşbütünleşme incelenmiştir. Elde edilen ampirik sonuçlar çerçevesinde Irak ekonomisinde Hollanda Hastalığı hipotezinin geçerliliği değerlendirilmiş ve bu hipotezin Irak ekonomisi için geçerli olmadığı sonucuna varılmıştır. Toda-Yamomoto (1995) nedensellik testi reel kurdan petrol fiyatlarına doğru tek yönlü bir nedensellik olduğunu göstermiştir. Diğer taraftan yıllık verilere dayalı grafiksel analiz son yıllarda sanayi ve hizmetler sektörünün milli gelir ve istihdamdaki payının düştüğünü göstermektedir. Bu bugu Irak ekonomisi için Hollanda hastalığının belirtileri olarak değerlendirilebilir.
ACKNOWLEDGEMENTS
At first, I'd like to reveal my deep thankfulness to my advisor Prof. Dr. Ergun DOĞAN for his continuous help and support of my Master study and research, and for his endurance, inspiration, commitment, extensive knowledge. His supervision helped me all through the way. Really this thesis couldn't be completed without his efforts.
Besides my advisor, my appreciation goes to Prof. Dr. Mehmet YAZICI, as he guided me with his kindness and his consideration.
Also my thanks goes to the rest of the committee: Assoc. Prof. Dr.Süleyman AÇIKALIN and Assoc. Prof. Dr. Dilek TEMĠZ DĠNÇ for helpful comments.
At last, I can't forget my family, friends, and fellow mates who provide care and motivation inexhaustibly.
CONTENTS
ACKNOWLEDGEMENTS ... vi
LIST OF TABLES ... vii
LIST OF FIGURES ... viii
INTRODUCTION ... 1
CHAPTER Ⅰ ... 4
A BRIEF OVERVIEW OF THE IRAQI ECONOMY ... 4
1.1. 1921 – 1958: Strategies for Founding and Building ... 4
1.2. After 1958, and the Era of Military Rule ... 5
1.3. 1980-2003 the Era of the Baath Party ... 7
1.4. Iraqi Economy After 2003 Economic Reforms ... 9
CHAPTER Ⅱ ... 10
Dutch Disease Model ... 10
2.1. Dutch Disease Model ... 10
2.1.1. Resource Movement Effect ... 11
2.1.2. Spending Effect ... 11
3.1.2. Summary of the Symptoms of the Dutch Disease ... 12
2.2. Evidence of Dutch Disease in Iraq ... 12
2.2.1. Growth in the shares of oil, manufacturing and services sectors in GDP ... 13
2.2.2. Employment growth in the oil, manufacturing and service sectors ... 14
2.2.3. Changes in the real wages in the oil, manufacturing, service sectors ... 15
2.2.4. Real Exchange Rate Appreciation ... 16
CHAPTER Ⅲ ... 18
LITERATURE REVIEW... 18
CHAPTER Ⅳ ... 23
THE REAL EXCHANGE RATE AND OIL PRICES: EVIDENCE FROM IRAQ ... 23
4.1. Data and Methodology ... 23
4.3. Empirical Results ... 31
4.3.1. ARDL Model ... 31
4.3.2. Bounds Testing ... 32
4.3.3. Long-run relationship ... 32
4.3.4. Short run relationship ... 33
4.3.5. Diagnostic Tests ... 34
4.3.6. The Toda and Yamamoto Causality Analysis ... 36
CHAPTER Ⅴ ... 40
CONCLUSION ... 40
BIBLIOGRAPHY ... 42
LIST OF TABLES
Table 1.1 : Amount of crude oil production in Iraq for period (1974-1979)
(million) b/d ...7
Table 1.2 : The Population, GDP, GDP per capita in Iraq for Period (1960-1980) ...7
Table 2.1 : Summary of Dutch Disease Symptoms ...12
Table 4.1 : Definitions and Sources of Data ...26
Table 4.2 : Descriptive Statistics...26
Table 4.3 : Unit Root Tests ...30
Table 4.4 : Autoregressive Distributed Lag Estimates ...31
Table 4.5 : Bounds Test Results ...32
Table 4.6 : Long Run Coefficients ...33
Table 4.7 : Error Correction Representation ...34
Table 4.8 : Diagnostic Test Results ...34
LIST OF FIGURES
Figure 2.1 : Sectorial Shares in GDP ...13
Figure 2.2 : Employment by sectors ...14
Figure 2.3 : Employment shares in total employment by sectors ...15
Figure 2.4 : Real wages by sector ...16
Figure 2.5 : Iraqi REER and oil prices...17
Figure 4.1 : Iraqi Real Effective Exchange Rates (LNREER). ...27
Figure 4.2 : Oil Price (LNOILP). ...27
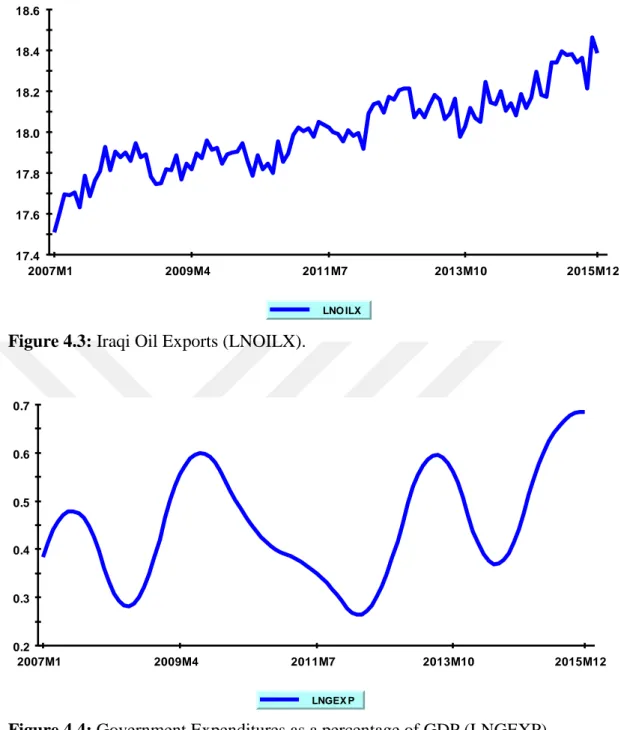
Figure 4.3 : Iraqi Oil Exports (LNOILX). ...28
Figure 4.4 : Government Expenditures as a percentage of GDP (LNGEXP). ...28
Figure 4.5 : Net Foreign Assets (LNNFA). ...29
Figure 4.6 : Real GDP per capita (LNRGDPK). ...29
Figure 4.7 : Plot of the CUSUM Stability Test ...35
LIST OF ABBREVIATIONS
ADF Augmented Dickey-Fuller AIC Akaike Information Criterion ARDL Autoregressive Distributed Lag CBI Central Bank Of Iraq
CPI Consumer Price Index ECM Error Correction Mechanism EIA Energy Information Administration GEXP Government consumption expenditure JODI Joint Organisations Data Initiative
KPSS Kwiatkowski Phillips Schmidt and Shin’s test NFA Net Foreign Assets
OLS Ordinary Least Squares OILP Oil Price
OILX Oil Exports
OPEC Organization of the Petroleum Exporting Countries PP Phillips And Perron
REER Real Effective Exchange Rate RGDPK Real GDP Per Capita
VAR Vector Auto-regression Model VEC Vector Error Correction WDI World Development Indicators
INTRODUCTION
The Iraqi economy suffers from structural problems in its economic structure, as it witnessed many events and transformations in its economic policies and orientation, whether it is fiscal policy or monetary policy.
The Iraqi economy can be seen as a rentier economy, which relies excessively on oil revenues to finance its development. The contribution of oil revenues to the GDP is quite high, which makes the country vuln1erable to many external shocks, especially shocks in the world crude oil markets.
The dependence of the Iraqi economy on oil, especially after the 1970s, has led to imbalances in the structure of production, and in the composition of exports. This, in turn, had negative impact on balance of payments and government budget. It is possible to say that excessive reliance on oil at the end has led to the waste of economic resources, especially after 2003, and exposed Iraqi economy to several positive and negative shocks in oil prices since 1990 until the end of 2014.
Abundance of oil revenues might be a curse for a country. Easily available oil revenues might curtail the incentive to develop manufacturing and service sectors that would lead to a diversified economic structure and an economy that is more resilient to negative external and internal shocks. Given the role of manufacturing sector in improving productivity of a country, any delay in emergence and further development of the manufacturing sector might be detrimental to sustainable long run growth for an economy.
Another explanation of why a thriving oil sector could be a problem for the entire economy is the Dutch disease hypothesis. This hypothesis predicts that rising
oil prices and hence increasing oil revenues would lead to de-industrialization of a country and appreciation of its real exchange rate.
Besides the real exchange rate appreciation and the possibility of a decline of manufacturing output, two other symptoms of the disease are worth discussing. The hypothesis also predicts that employment in manufacturing sector might decline, and real wages for the entire economy might increase as a result of rising oil prices. The latter effect, that is, rising real wages, is one important cause of the increase in the general price level in the economy, which leads to an appreciation of the real exchange rate.
Given the importance of oil revenues for Iraqi economy and the fact that no extensive study has been conducted for such an economy, this thesis attempts to investigate whether the Iraqi economy has suffered from the Dutch disease, which is an issue that has not been examined extensively before, by empirically examining the relationship between real effective exchange rate and oil prices for Iraq.
We look into all symptoms of the disease graphically first and then we specifically focus on the effect of oil price changes on the real effective exchange rate by using monthly data for the period of 2007 -2015. To achieve this goal, first the effect of oil prices or rather a booming oil sector on sectoral outputs, employment, and real wages is graphically examined by using annual data. Then, ARDL bounds testing methodology is used to test for co-integration between Iraqi real exchange rate and oil prices. After co-integration test and short run and long run estimates, Toda-Yamomoto (1995) causality test is conducted to find out any causality between model variables, especially the causality between variables of interest, real exchange rate and oil prices.
The structure of the study is as follows: The first chapter presents an overview of the Iraqi economy by taking an historical perspective and dividing into certain eras based on important developments. Chapter 2 presents the Dutch disease model and graphically examine the symptoms of Dutch disease using annual data on
employment, share in GDP and real wages for oil, manufacturing and services sectors. Chapter 3 reviews the literature that is the most relevant to the present study. Chapter 4 presents the empirical results from the estimation of an ARDL model of Iraqi real exchange rate and oil prices and Toda-Yamomoto (1995) causality test results. The final chapter summarizes the findings and based on the findings offers some policy recommendations.
CHAPTER Ⅰ
A BRIEF OVERVIEW OF THE IRAQI ECONOMY
1.1. 1921 - 1958: Strategies for Founding and Building
Britain occupied Iraq during the First World War of 1914-1918. Under the San- Remo agreement of April 25, 1920, Iraq was placed under the British Mandate, a royal government was formed in Iraq, and Faisal I was chosen as the King of Iraq in 1921.
In 1922 The Turkish Petroleum Company (TPC) submitted to Iraqi government an application to obtain a concession for oil exploration in Baghdad and Mosul. The Iraqi government agreed to that request, and then negotiations between the parties began in 1923 (Maamouri, et al: 2011). In March 1925, the agreement between the two parties was signed. The one of the terms of the agreement contained the identification of 4 shillings of gold per ton of crude oil. The excavation began in the first well in the Balkana region in 1927 (Al-Hiti, 2000). Iraq gained official independence from Britain in 1932, but Britain's influence in Iraq remained through bilateral treaties in the fields of trade, defense and foreign policy (Özlü, 2006).
Before oil exports began, the Iraqi economy was characterized by being a largely agricultural economy, and less trade. State revenues were not more than 4 million dinars. In 1921-1922, it amounted to about 3.9 million dinars, 1926 to about (4.3) million dinars, and remained until 1934, the first year for the export of oil, which led to an increase in exports of national income of Iraq (Maamouri, et al: 2011).
After the Second World War, oil production in Iraq grew weakly from 1945-1947. It was about 190,000 barrels / day. Then it dropped by 50% in 1948. It did not achieve a significant increase until 1950. The oil revenues achieved great profits on concessionary companies until 1952. In accordance with these concessions, the Iraqi government received a fixed percentage of each unit of production which did not exceed 5% of the actual revenues (Özlü, 2006). In 1952, a new agreement was signed between the Iraqi government and the Iraqi Oil Company (IPC), whereby the Iraqi government got 50% of the revenues of oil exports, as well as receipt of more than 12% of net production, which could be sold at any level of prices (Özlü, 2006).
Oil revenues for the Iraqi government increased as a result of a rise in oil prices and increase in oil production. Oil prices rose from $ 0.22 per barrel in 1950 to $ 0.84 per barrel in 1952. The oil production increased from (190) thousand barrels / day to (697) thousand barrels / day and to 30 million tons in 1955. Iraq's net income of oil was estimated at 20 million Iraqi dinars or about 40 million dollars then.
1.2. After 1958, and the Era of Military Rule
The political system in Iraq moved from a monarchy to a republican system as a result of the military coup in 1958 led by Abdul Karim Qasim. As a result, political and economic features emerged were quite different from those that preceded them. The government followed new economic policies, the essence of which was agricultural reform, increased industrialization and change of policy towards companies. The new government paid special attention to oil issues. For the first time, it formed a special ministry for oil in 1959. The government then asked the companies to reconsider the concession agreement to improve terms and apply what the government believed was its right under the agreement.
After the failure of the negotiations, the Iraqi government issued Law No. 80 in 1961, which placed 99.5% of the concession land under the control of the Iraqi government and controlled the places that did not invest, leaving for the foreign companies oil producing fields only (Enaz, 2014). The desire of the Iraqi government
was directed toward investing oil nationally, and therefore rejected all offers made by international companies.
After the overthrow of the leader (Abdul Karim Qassem) in a coup of the Baath Party in conjunction with other officers in 1963, Colonel Abdel Salam Aref became president of country. The Iraqi government established the Iraqi National Oil Company in 1964. It started to prepare its formations, and the development process after the year 1968. The Iraqi Oil Company adopted the policy of direct investment, where it worked on the development of oil fields and firms’ requirements for production and transport through the conclusion of agreements with the countries of Europe and the former Soviet Union.
In 1968, Ahmad Hassan al-Bakr became president of the Republic of Iraq after the military coup through an alliance which included the army and the Baath party in order to seize power of the country. The government prepared its economic and social policy formulation, clearly characterized by broadening the public sector base in economic activity, so showed central planning in the process of economic development. As the planning process continued, development plans became in the form of investment approach (Nasrawi, 1994).
After the nationalization of the Iraqi Oil Company on 1/6/1972 and reaching a settlement agreement with the oil companies in 1973, the operations of the Iraqi National Oil Company expanded, especially after the first price boom and increase in Iraq's oil revenues, inflow of large foreign currency (US $) that has turned Iraq into a rentier country, which depends on oil revenues to finance its operating and investment budgets.
The nationalization of oil companies were completed in 1975. In 1979, after the discovery of several oil fields, the Iraqi National Oil Company initiated a program to increase the production capacity of crude oil. In 1979, oil revenues reached 23.4 billion Iraqi dinars. Iraq was able to rely on the Iraqi National Oil Company in 1979 of production 3.5 million barrels per day as shown in Table 1.1.
Table 1.1: Amount of crude oil production in Iraq for period (1974-1979) (million)
b/d
Amount of crude oil production Year 1.9 1974 3.1 1975 3.3 1976 3.2 1977 3.5 1978 2.5 1979
Source: OPEC Annual Statistical Bulletin 1999, Table 38, P.5
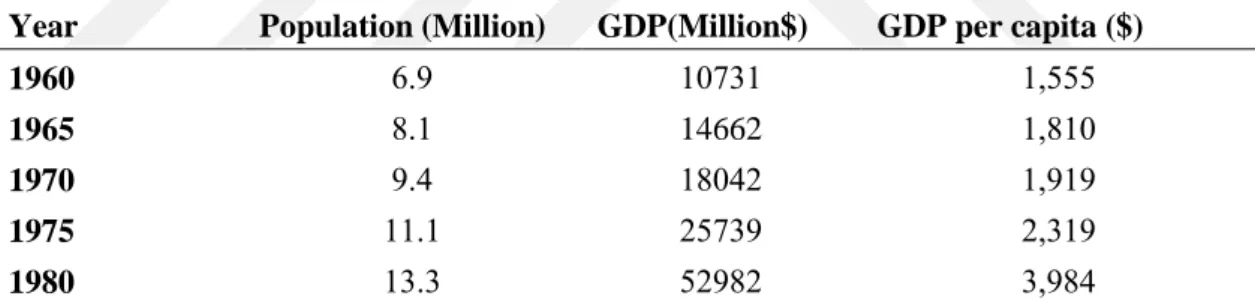
The five-year economic development plan showed real growth in GDP per capita income rose significantly (at 1980 constant prices) from $ 1,555 in 1960 to $ 3,984 in 1980, with an annual growth rate of 4.8%, thus achieving the highest level in modern Iraq's history. So, in the 1970s, Iraq's economy represented the golden age (Zinni, 2003) as shown in Table 1.2
Table 1.2: The Population, GDP, GDP per capita in Iraq for Period (1960-1980)
Source: Central Statistical Organization of Iraq
1.3. 1980-2003 the Era of the Baath Party
The Iraqi economy in the seventies was considered one of the strongest economies in the region. Iraq was a candidate to become an influential financial force as a result of the economic revolution and high oil prices, until political change took place in Iraq. The president (Al Bakr) was deposed and Saddam Hussein was declared the president of Iraqi government in late 1979. In the early months of his rule he entered a war against Iran in September 1980, turning the Iraqi economy into
GDP per capita ($) GDP(Million$) Population (Million) Year 15555 13721 9.9 1960 15813 14662 8.1 1965 15919 18383 9.8 1970 35219 35729 11.1 1975 25988 53983 12.2 1980
a war economy that directed all factors of production and government revenues towards the military machine and the war effort.
Because of the war, Iraq was put on the brink of social and economic breakdown. The damage caused to the Iraqi economy was the loss of nearly 62 billion dollars of oil revenues, the depletion of between 35 - 40 billion dollars of foreign reserves, and the accumulation of external debt estimated at 42 billion dollars to non-Arab countries, and $35 billion to Arab countries, additional military expenditures of $ 105 billion and the destruction of an infrastructure of $30 billion (Zinni, 2003). The gross domestic product peaked at $52.9 billion in 1980 because of the oil boom and fell by about one-half to $26.9 billion in 1989 (on constant 1980 dollar prices). GDP reached its low point in 1994 falling to $6.5 billion.
The United Nations Security Council imposed a comprehensive international economic embargo on Iraq as a result of the invasion of Kuwait (resolution 661) in August 1990. The economic sanctions led to the cessation of oil exports, the decline of industrial and agricultural production and other services. Iraq lost in Kuwait a lot of what it achieved in the field of human and economic development.
The country suffered during the period 1990-1995 from the lack of public revenues due to the absence of oil resources. Inflationary pressures increased over time and affected the value of exchange rates. The exchange rate of the US dollar against the Iraqi dinar rose from 7.5 dinars per dollar in 1991, to more than 2500 dinars per dollar at the end of 1995. The GDP also dropped to $ 6.5 billion in 1994, after then rose to $ 10.8 billion in 1996 because oil exports resumed under the U.N. Oil for Food Program (OFFP) after 1995 (Berihi, 2011). Due to economic sanctions from 1990 to 2003, Iraq's economy was getting to worst in 2003 (Maamouri, et al: 2011).
1.4. Iraqi Economy After 2003 Economic Reforms
The United States launched an offensive against Iraq, which overthrew the Baath Party and the end of the Saddam era. A new era emerged where democratic governments were elected by the people. The United Nations Security Council adopted resolution 1483 on 22 May 2003, lifting trade sanctions on Iraq (excluding arms embargoes). Coalition Provisional Authority (CPA) began its project to reform the Iraqi economy. It issued legislation and laws and took measures in many areas, including foreign investment, infrastructure, banking system, monetary stability etc.
The monetary policy in Iraq has been able to achieve the most important goals, which are to stabilize the exchange rate and increase confidence in the Iraqi dinar where the exchange rate of the dollar decreased from about 3000 dinars to the dollar before the change in 2003, to 1120 dinars to the dollar in the years 2017.
Monetary policy has also managed to ease inflation, falling from 60-70% in the first years after 2003 to 3-6% in 2012-2013. The monetary policy has also been able to build sovereign cash reserves in international currencies and gold, as a cover for the local currency, and to ensure economic stability in the event of decrease in oil imports or in the case the Iraqi economy is exposed to other shocks caused by natural disasters.
The financial and banking reform also include a package of procedures, the most important of which are: the liberalization of interest rates, the liberalization of foreign exchange rates, and away from credit oriented.
CHAPTER Ⅱ
DUTCH DISEASE MODEL
2.1. Dutch Disease Model
The term Dutch Disease was first coined by the Economist magazinein 1977 to describe the decline in Dutch manufacturing after the discovery of large natural gas deposits in the early 1960s in Netherlands. Increasing wealth in the country as a results of this development led to the appreciation of the Dutch guilder, making non-oil exports more expensive and, therefore, less competitive. Dutch Disease can also arise from any significant cash flow to a country. This might occur either through foreign direct investment or through loans and international aid (ALshammari, 2010).
To illustrate the effects of Dutch disease on productive activities we use the Cordon and Neary (1984) model. In the model, economy is classified into three sectors: Oil, manufacturing, and services.1 Tradable goods (oil and manufacturing) sectors are subject to international competition, which means that prices in these sectors are determined in international markets. 2 It is also assumed that the country is a small open economy, and hence cannot influence these prices. In the services sector prices depend only on domestic demand and supply since this sector produces non-tradable goods, and hence is not subject to international competition. In the
1 These sectors are labeled energy, manufactures, and services, respectively, in Corden and Neary
(1984).
2 Manufacturing sector includes electricity, gas and water distribution, ferrous metals, non-ferrous
metals, chemical and petrochemical, machinery, forestry and wood- working, light industry, and food. Services sector includes construction, wholesale and retail trade, repair of automobiles, motorcycles and durable consumer goods; hotels and restaurants; transportation and communications; finance; real estate and rental services; public administration, defense,
model, a booming oil sector gives rise to a “resource movement effect” and a “spending effect”, which we explain next by following, unless otherwise mentioned, Oomes and Kalcheva (2007).
2.1.1. Resource Movement Effect
This effect is due to the movement of factors of production (labor, capital) between different sectors. When the oil price rises, the demand for labor and capital in the oil sector will rise as producers try to increase production. This will lead to higher wages there and to a higher return on capital, which will stimulate labor and capital to move from the manufacturing and service sectors to the oil sector. Oil sector employment and output will thus increase, while employment and output in the services and manufacturing sectors will decrease. therefore, the resource movement effect unambiguously gives rise to direct de-industrialisation (Cordon and Neary,1984, p.838).”
2.1.2. Spending Effect
This effect occurs because high oil prices generate higher wages and/or profits in the oil sector, leading to higher aggregate demand and spending in the economy. Higher spending on non-tradable goods (services) leads to higher prices of non-tradable goods relative to the prices of tradable goods, since oil prices and prices of manufacturing goods, which are determined abroad, are not affected. This process results in an appreciation in the real exchange rate.
Assuming that it is mobile between the sectors, labor will move to services sector from the other sectors because wages will rise as firms try to meet the increased demand for non-tradable goods. Since it is not possible for prices and wages to change neither in oil nor in the manufacturing sector, employment in these sectors would decrease. This is called indirect de-industrialization by Cordon and Neary (1984).
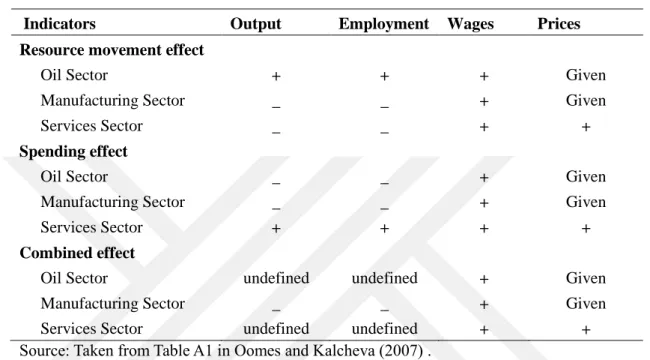
3.1.2. Summary of the Symptoms of the Dutch Disease
The Table 2.1 below (taken from Table A1 in Oomes and Kalcheva (2007)) summarizes the symptoms of Dutch disease.
Table 2.1: Summary of Dutch Disease Symptoms
Indicators Output Employment Wages Prices
Resource movement effect
Oil Sector + + + Given
Manufacturing Sector _ _ + Given
Services Sector _ _ + +
Spending effect
Oil Sector _ _ + Given
Manufacturing Sector _ _ + Given
Services Sector + + + +
Combined effect
Oil Sector undefined undefined + Given
Manufacturing Sector _ _ + Given
Services Sector undefined undefined + +
Source: Taken from Table A1 in Oomes and Kalcheva (2007) .
2.2. Evidence of Dutch Disease in Iraq
Resource abundance seems to be a curse rather than a blessing where several empirical studies have showed that countries without the natural resources grow faster than resource-abundant countries (Auty, 2001). Some economists believe that the Dutch disease which results in a rise in real wages, a decline in the production and export of products in the manufacturing sector reflecting both direct and indirect de-industrialization, an increase in service sector output, and a real exchange rate appreciation is the reason for the low growth rates in oil exporting countries. In this part we will show whether or not these Dutch disease symptoms exist in the Iraqi economy by using annual data on real output, employment, and real wages by sectors (see Appendix Table A1 for the data set).
2.2.1. Growth in the shares of oil, manufacturing and services sectors in GDP
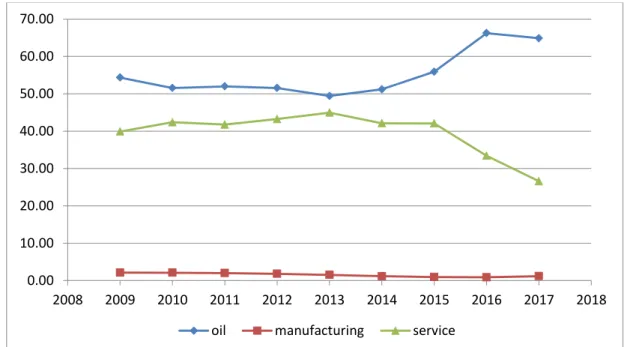
Figure 2.1 shows the contribution of oil, manufacturing, and service sectors to GDP in period of 2010-2017. We find that the share of the oil sector in GDP increased from 54.33% in 2009 to 51.55% in 2010, and its highest share amounted to 64.85% in GDP 2017.
The share of the manufacturing sector to the GDP is generally low, and ranges between 0.88% and 2.12%. Figure 2.1 shows that share of manufacturing sector in GDP was at its highest in 2010 with a share of 2.11%. The share of the services sector in GDP is gradually increasing, reaching its highest level of 44.95% in 2013. Afterwards, service sector share decreases slowly to a low of 26.58% in 2017.
It is not difficult to see that to seek the symptoms the Dutch disease in Iraq one needs to look at the developments in shares of oil and service sectors. Plots shown in Figure 2.1 make it clear that until 2013 spending effect is more important since the share of oil sector in RGDP decreases while that of service sector increases. However, these trends reverse themselves after 2013, indicating the existence of the resource movement effect.
Figure 2.1: Sectorial Shares in GDP
0.00 10.00 20.00 30.00 40.00 50.00 60.00 70.00 2008 2009 2010 2011 2012 2013 2014 2015 2016 2017 2018
2.2.2. Employment growth in the oil, manufacturing and service sectors
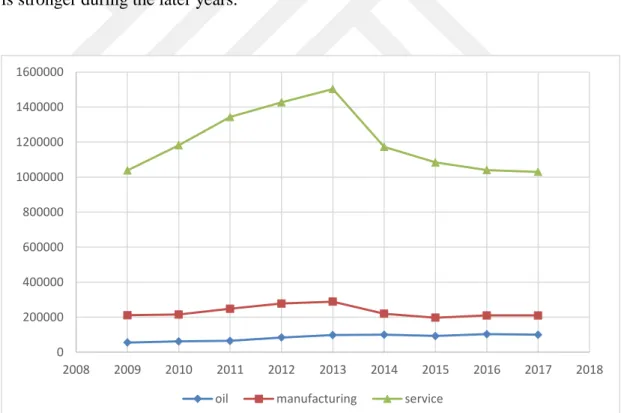
Figure 2.2 shows that employment in all sectors grows until 2013. After 2013 there is a clear-cut decrease in service sector employment, while there are modest gains in the other two sectors. Plots of the employment shares of each sector in total employment shown in Figure 2.3 clearly show that share of oil sector in oil sector has been increasing since 2011, share of manufacturing has been fluctuating between 14% and 16%, and share of services is slightly lower by the end of the time period under study.
These developments in employment and employment shares indicate that the resource movement effect has not been significant in the Iraq economy before 2013. There was no significant labor mobility between the oil sector and other sectors in the earlier years of the period. However, evidence for the resource movement effect is stronger during the later years.
Figure 2.2: Employment by sectors 0 200000 400000 600000 800000 1000000 1200000 1400000 1600000 2008 2009 2010 2011 2012 2013 2014 2015 2016 2017 2018 oil manufacturing service
Figure 2.3: Employment shares in total employment by sectors
2.2.3. Changes in the real wages in the oil, manufacturing, service sectors
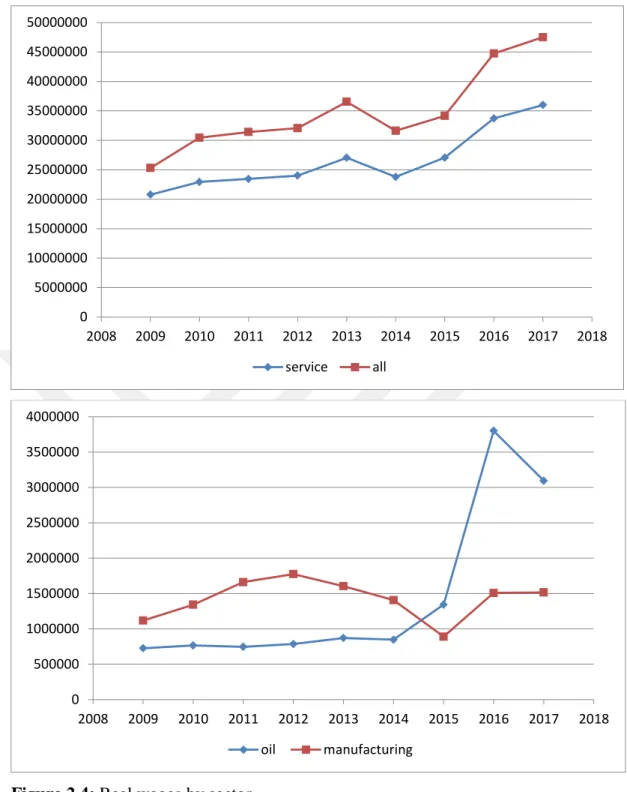
Figure 2.4 shows the plots of real wages in oil, manufacturing and service sectors, and in the overall economy. Real wage grows in the overall economy and services sector during the entire period, except for 2014. In manufacturing, real wages fall between 2013 and 2015. In oil sector, there are decreases in real wages in the years of 2011, 2014, and 2017. Evidence presented here is not unambiguously consistent with the Dutch disease hypothesis since the hypothesis predicts that real wages must rise in all sectors, and in the overall economy. We see that occurring only during the periods of 2009-2012, and 2015-2016. Perhaps one can talk about the Dutch disease affecting the economy only in these periods.
0.00 10.00 20.00 30.00 40.00 50.00 60.00 70.00 80.00 90.00 2008 2009 2010 2011 2012 2013 2014 2015 2016 2017 2018
Figure 2.4: Real wages by sector
2.2.4. Real Exchange Rate Appreciation
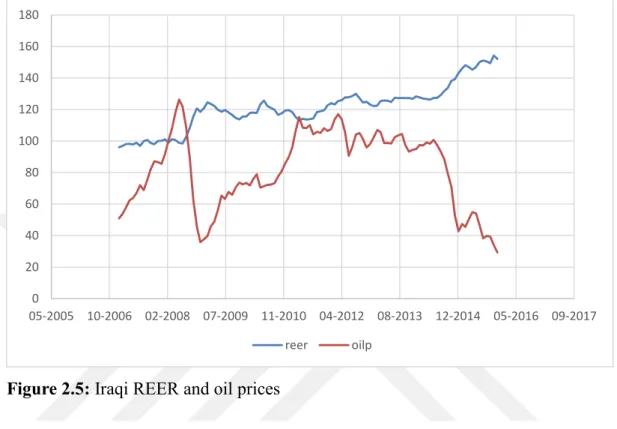
As Figure 2.5 shows correlation between the REER and oil prices was not positive throughout the period. Both of these two series generally show an upward trend before 2011M04, except for the year of 2018, but these changes afterwards
0 5000000 10000000 15000000 20000000 25000000 30000000 35000000 40000000 45000000 50000000 2008 2009 2010 2011 2012 2013 2014 2015 2016 2017 2018 service all 0 500000 1000000 1500000 2000000 2500000 3000000 3500000 4000000 2008 2009 2010 2011 2012 2013 2014 2015 2016 2017 2018 oil manufacturing
with REER continuing to appreciate while oil prices start to decrease gradually. So it is not obvious that a Dutch disease related real appreciation occurred in Iraq during this period. This issue is analyzed further econometrically in Chapter 4.
Figure 2.5: Iraqi REER and oil prices 0 20 40 60 80 100 120 140 160 180 05-2005 10-2006 02-2008 07-2009 11-2010 04-2012 08-2013 12-2014 05-2016 09-2017 reer oilp
CHAPTER Ⅲ LITERATURE REVIEW
Some nations are financially affected via oil price and US dollar fluctuations. This study will investigate if there is an impact of the oil price on the exchange rate for Iraq. In this chapter, the literature about relationship between the oil price and the real exchange rate will be reviewed. The oil price plays a main role in international financial issues. The US dollar is the most important currency in the international economy. It has a main position in the price of oil and other commodities in the financial market. The dominance of the US dollar in international commerce as a currency commodity lets this currency serve as the central currency in the exchange rate arrangements of many nations. Some of the important studies are reviewed below.
Chen and Rogoff (2002) studied the determinants of the real exchange rate movements by focusing on the three (OECD) economies i.e.; (Australia, Canada, and New Zealand), in which the primary commodities constituted an important share of their exports. They utilized the OLS regression, and GMM-IV regression estimation for the data ranged from 1973Q1 to 2001Q2. It was found that the dollar price of the commodity exports had a strong and stable effect on their floating real exchange rate.
Lizardo and Mollick. (2010) found-out that oil prices significantly explained the reasons for the changes in the value of the dollar against major currencies using monthly data from 1970 to 2008. They utilized the VECM and co-integration tests. Their results showed that; the increase in the actual oil prices led to a sharp drop in the value of the US dollar against Canada, Mexico, and Russia and other net oil currencies. On the other hand, the currencies of oil-importing countries such as; Japan has depreciated against the US dollar when the actual oil price has risen.
Korhonen and Juurikkala (2009) used the annual data from oil-dependent countries (OPEC countries) for the period between the years 1975 to 2005. The purpose of the authors' was to assess the determinants of the equilibrium real exchange rates of the Organization of Petroleum Exporting Countries utilizing (PMG) and (MG) estimators. Their findings showed that oil prices have a statistically significant effect on the real exchange rate of oil producing countries. The high oil prices lead to appreciation of real exchange rates. The elasticity of the real exchange rate for oil prices was usually between 0.4 and 0.5. As for the per capita real GDP, the results showed that the GDP had no effect on the real exchange rate.
Mohammadi and Parvar (2012) using monthly data from 13 oil exporting countries during the period from 1970 to 2010 studied, the long-term relationships and the short-term dynamics between the real exchange rates and real oil price to investigate the possibility of the Dutch disease in these countries. The authors utilized the (TAR and M-TAR) models in the tests, and their results showed that in 3 countries (Norway, Bolivia, and Mexico), there was a long-term existence of the real oil prices affecting the real exchange rate. Single-factor Granger causality) There was no evidence that there was a short-term granger non-causal relationship in any direction between real oil prices and the exchange rate .For the other nine countries (Colombia, Algeria, Saudi Arabia, Russia, Venezuela, Kuwait, Indonesia, Gabon, Nigeria) (real oil prices do not affect the real exchange rate). This result proves the weak link between oil price and exchange rate, and the possibility of disease is limited.
Hasanov (2010) evaluates the effect of real oil prices on the real exchange rate of Manat in Azerbaijan and using the quarterly data from 2000 to 2007 and applying the ARDL model and the Johansen co-integration methods. His research results revealed that the real oil prices have a significant positive impact on the long-term real exchange rates. In addition, the relative prices had as a proxy for productivity statistically significant positive effect on Manat’s real exchange rate.
Saad - Filho and Weeks (2013) derived data from the (UNCTAD) United Nations Conference on Trade and Development, for countries that were considered to be the main source of natural gas and oil from 1980 to 2012. With the exception of
Dutch disease (short-term), this study looks at the resource curse (long-term) literature. Their research results show that factors that lead to the deterioration of economic growth (leading to a reduction in international payments) are, in addition to assisting in the development and hiring of natural resources, a large number of remittances of foreign currency inflows.
Koranchelian (2005) estimates the long-term equilibrium path of the real exchange rate in Algeria using the annual data from (1970 to 2003). Using the VECM model and co- integration tests the authors conclude that the real exchange rate is positively affected by the real price of oil and relative productivity.
Habib and Kalamova (2007) had examined impact of the real oil prices on real exchange rates for three major oil exporting countries: Russia, Saudi Arabia, and Norway using quarterly data (1980 – 2006) for Norway and Saudi Arabia, and (1998-2006) for Russia. Their results showed that there was a long-term positive relationship between the real oil price in Russia and the real exchange rate. For Saudi Arabia and Norway, real oil has no effect on the real exchange rate.
Kalcheva and Oomes (2007) tested the symptoms of Dutch disease for Russia using monthly data for the period (1997- 2005). These include (a) appreciation of the real exchange rate; (b) slowing growth in manufacturing; (c) accelerated growth in the service sector, and (d) higher overall wages. They carefully control other factors that may cause similar symptoms. Their results show that although Russia has all symptoms, and the real oil price has a statistically significant and positive effect on the long-term actual effective exchange rate, the diagnosis of Dutch disease remains to be confirmed.
Zalduendo (2006) tried to separate the impact of oil prices from other factors related to the real equilibrium exchange rate such as oil prices, productivity, government expenditure as a percentage of GDP, and differences in real interest rates.
equilibrium real exchange rate. (ii) Oil prices are not the only important determinant of the real exchange rate, and low productivity is also a key factor. (iii) Appreciation pressure is rising, (iv) Speed of convergence is higher with parallel rates compared to official exchange rates.
Crespo - Cuaresma et al. (2003) utilized the panel datasets from six Central and Eastern European countries (Czech Republic, Hungary, Poland, Romania, Slovakia, and Slovenia) for the period 1994-2002. estimate the monetary exchange rate model with panel co-integration methods. Including Pooled Mean Group estimator (PMGE), (FMOLS) fully modified least square estimator and (DOLS) dynamic least squares estimator. Their research shows that the current model can convincingly explain the long-term dynamics of the exchange rate of CEECs.
Jahan - Parvar and Mohammadi (2008) using the monthly data from the year (1970 to 2007), examined the validity of the Dutch disease hypothesis by looking into the relationship between the real oil price and the real exchange rate in the sample of 14 oil exporting countries. They used a co-integration-supported ARDL bounds test. Their results showed that there was a stable relationship between the actual exchange rate of all countries and the real oil price, which showed strong support for the Dutch disease hypothesis.
Chen et al. (2013) aimed to investigate the interaction between exchange rates and oil prices. They analyzed whether the asymmetric adjustment mechanism was embedded in the Philippines' co-integration regression. They used quarterly data from the first quarter of 1970 to the fourth quarter of 2011. The threshold autoregressive (TAR) model shows that the exchange rate and oil price are not co-integrated. But the momentum threshold autoregressive (MTAR) model. Their research shows co- integration and asymmetric adjustment between exchange rate and oil price seems to be asymmetric in the Philippines, and the exchange rate adjusts to positive deviation.
Akram (2002 checked whether there was a non- linear relationship between the oil price and the Norwegian exchange rate. The data is 1971:2-1997:4. He used the equilibrium correction models (EqCMs) and the linear and nonlinear oil price effects on Norway's nominal effective exchange rate. The author's results show that there is a non-linear negative relationship between the price of the Norwegian krone and the price of crude oil. Changes in oil prices have a strong influence on exchange rates in the short term, but not in long – term.
Suleiman and Mohammed (2011) investigate using the vector error correction model (VECM) and Johansen co- integration annual data from 1980 to 2010, the long-term impact of real oil prices on the real exchange rate in Nigeria was investigated. Their results show that the real oil price has a significant positive impact on the real exchange rate in Nigeria. The difference in productivity has a negative effect on the real exchange rate.
Kutan and Wyzan (2005) studied whether Kazakhstan was prone to Dutch disease for period January 1991- November 2003. Using the extended version of the Balassa -Samuelson model, including oil prices, they found that changes in oil prices have had a significant positive impact on the real exchange rate and provided signs for disease in the Kazakhstan.
Camarero and Tamarit (2002) utilize the panel co-integration tests to examine the main determinants of the bilateral real Spanish peseta exchange rate for the (1973-1992) annual data for the 9 member states of the European Union. Their research results showed that determining the real exchange rate in both, the supply and demand variables are important.
CHAPTER Ⅳ
THE REAL EXCHANGE RATE AND OIL PRICES: EVIDENCE FROM IRAQ
4.1. Data and Methodology
In this study, a behavioral equilibrium exchange rate model for Iraqi REER is used to detect any sign of Dutch disease. It is assumed that
REER = f(OILP, OILX, GEXP, NFA, RGDPK)
where REER is the real effective exchange rate index, OILP is oil price, OILX is oil exports, GEXP is government consumption expenditure as a percentage of GDP, NFA is net foreign assets, and RGDPK is the real GDP per capita (proxy for productivity differential).
Following Darvas (2012) REER is calculated as
where t indexes time. dCPI denotes domestic (Iraqi) CPI. fCPI denotes geometrically weighted average of CPI indices of its 138 trading partners. NEER denotes nominal effective exchange rate of Iraq, calculated as the geometrically weighted average of bilateral nominal exchange rates between Iraq and its trading partners. Nominal exchange rate is the foreign currency price of Iraqi dinar. An increase in REER indicates an appreciation of the Iraqi dinar against a basket of currencies of its trading partners.
Oil price (OILP) is included in the model to test the Dutch disease hypothesis. A positive relationship between REER and OILP would indicate support for the Dutch
disease hypothesis. Oil exports (OILX) is included to control for the effect of oil exports on the exchange rate. As oil exports increase oil revenues in foreign currency will also increase, boosting the demand for domestic currency and causing its appreciation when these revenues are converted to domestic currency. So expected sign of OILX should be positive, that is, when OILX increases REER also increases, indicating an appreciation in domestic currency (Al-Shammari, et al, 2018).
Real GDP per capita (RGDPK) is used as a proxy for the Balassa-Samuelson effect, which occurs through a productivity increase in the tradable sector. As increasing productivity in the tradable sector translates into higher wages, prices of tradable goods start to increase, putting upward pressure on the domestic CPI. This increase in domestic CPI, which is the result of an increase in domestic productivity relative to a country’s trade partners as was just explained, eventually causes an appreciation in the real exchange rate. Following the literature we use real GDP per capita instead of productivity for lack of reliable monthly data.3
Government consumption expenditure (GEXP) affects real exchange rate because higher expenditure levels tend to increase aggregate demand and domestic prices, which leads to an appreciation. The higher the share of non-tradable goods in total government expenditure the larger the appreciation would be. The effect of net foreign assets (NFA) also works through aggregate demand and domestic prices. An increase in net foreign assets would translate into higher spending, and eventually to higher prices, which lead to rear exchange rate appreciation.
The following Autoregressive Distributed Lag (ARDL) Model is used in estimations: ∑ ∑ ∑
∑ ∑ ∑ ( )
where a0 is the intercept, is the random error term respectively, and is the first difference operator. All variables are expressed in natural logarithms except the percentage change in RGDP. The short-run relationship between REER and the explanatory variables is measured by the coefficients that are attached to the first differenced terms (from b to g), while long-run relationships are measured by µ1 to µ6. The test has the null hypothesis of
: = = = = = = 0
against the alternative hypothesis
: ≠0, ≠0, ≠0, ≠0, ≠0, ≠0.
Null hypothesis indicates the absence of a long-run relationship. To perform the test critical values given in Pesaran et-al (2001) are used. In the second step long-run relationship is estimated by using the following equation:
( )
The error correction model (ECM) can be express as follows:
∑ ∑ ∑
∑ ∑ ∑ ( )
where is the error correction term, which captures the short-run dynamics.
The study uses monthly time series data. The definitions of variables and data sources are shown in Table 4.1, and descriptive statistics are given in Table 4.2.
Table 4.1: Definitions and Sources of Data
Variable Notation Data source Unit
real effective exchange rateⁱ REER Bruegel Index (2007M12=100)
oil exports OILX JODI Barrels per month
oil priceⁱⁱ OILP EIA US Dollars per barrel
real GDP per capitaⁱⁱⁱ,iv RGDPK CBI Millions of Iraqi dinars government consumption ⁱv GEXP WDI Percentage of nominal GDP net foreign assets NFA CBI Millions of Iraqi dinars
Notes:
ⁱ CPI-based (2007=100). An increase in REER indicates appreciation of the home currency against the basket of currencies of Iraq’s 138 trading partners.
ⁱⁱ U.S. FOB Costs of OPEC Countries Crude Oil
ⁱiⁱ Real GDP = Gross Domestic Product in constant prices (2007=100).
ⁱv RGDPK and GEXP were converted to monthly series from annual series by using R package
tempdisagg.
Bruegel is a European think tank that specializes in economics. The data set was downloaded from http://bruegel.org/2012/03/real-effective-exchange-rates-for-178-countries-a-new-database. See also CBI : The Central Bank of Iraq.
EIA : Energy Information Administration JODI : Joint Organisations Data Initiative WDI : World Development Indicators
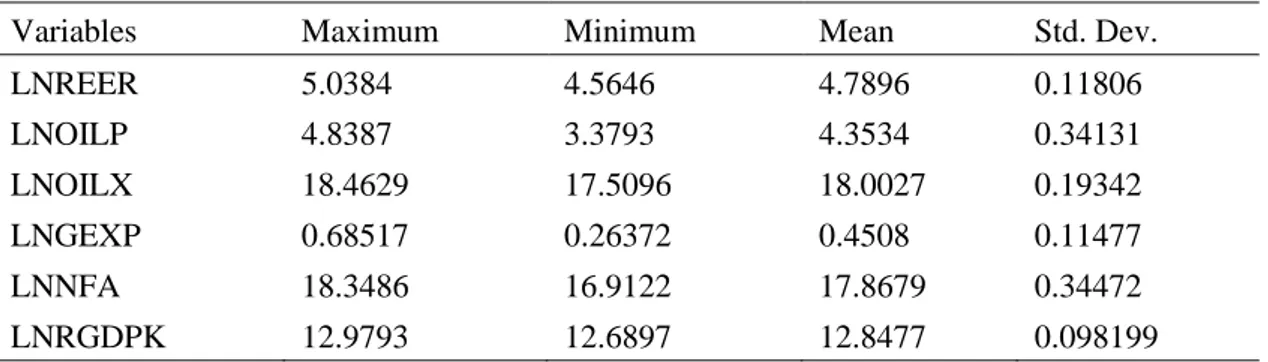
Table 4.2: Descriptive Statistics
Variables Maximum Minimum Mean Std. Dev.
LNREER 5.0384 4.5646 4.7896 0.11806 LNOILP 4.8387 3.3793 4.3534 0.34131 LNOILX 18.4629 17.5096 18.0027 0.19342 LNGEXP 0.68517 0.26372 0.4508 0.11477 LNNFA 18.3486 16.9122 17.8679 0.34472 LNRGDPK 12.9793 12.6897 12.8477 0.098199
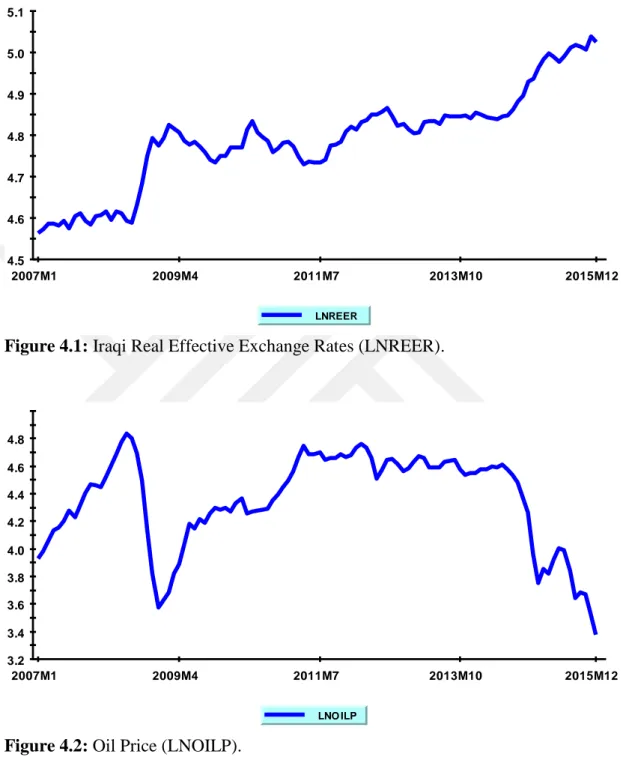
Plots of the data series are shown in Figures 4.1 - 4.6. All series except for LNOILP and LNNFA exhibit upward trends.
Figure 4.1: Iraqi Real Effective Exchange Rates (LNREER).
Figure 4.2: Oil Price (LNOILP). 4.5 4.6 4.7 4.8 4.9 5.0 5.1 2007M1 2009M4 2011M7 2013M10 2015M12 LNREER 3.2 3.4 3.6 3.8 4.0 4.2 4.4 4.6 4.8 2007M1 2009M4 2011M7 2013M10 2015M12 LNO ILP
Figure 4.3: Iraqi Oil Exports (LNOILX).
Figure 4.4: Government Expenditures as a percentage of GDP (LNGEXP).
17.4 17.6 17.8 18.0 18.2 18.4 18.6 2007M1 2009M4 2011M7 2013M10 2015M12 LNO ILX 0.2 0.3 0.4 0.5 0.6 0.7 2007M1 2009M4 2011M7 2013M10 2015M12 LNGEX P
Figure 4.5: Net Foreign Assets (LNNFA).
Figure 4.6: Real GDP per capita (LNRGDPK).
4.2. Unit Root Tests
Augmented Dickey-Fuller (ADF) and Phillips-Perron (PP) tests are used to determine the times series properties of the series. The null hypothesis in both of these tests is stationarity, that is, there is a unit root in the time series. Each test is done with a constant included (level stationarity), and again with a constant and trend included (trend stationarity).
16.8 17.0 17.2 17.4 17.6 17.8 18.0 18.2 18.4 2007M1 2009M4 2011M7 2013M10 2015M12 LNNFA 12.60 12.70 12.80 12.90 13.00 2007M1 2009M4 2011M7 2013M10 2015M12 LNRGDPK
The unit root test results are shown in Table 4.3. The results from the regressions with level variables are reported in the first panel, and those from the regressions with first-differenced variables are reported in the second panel. In order to make a decision about the order of integration, we first check the figures above to see if a series is trended. If it is, we take the result in the constant and trend column in the first panel and compare it to the result in the constant column in the second panel. If a series is level stationary we ignore the result in the first difference panel since in this case there is no need to check whether it is trend stationary or not. For instance, since LNREER series show a trend (see Figure 4.1) the relevant results would be that it is trend non-stationary in levels and level stationary in first differences. The conclusion is that LNREER is integrated of order 1 or I(1). Repeating the same decision process for other series, we find that LNOILP is I(1), LNOILX is I(0), LNGEXP is I(1), LNNFA is I(1). In the case of LNRGDPK PP test gives a conflicting result. We do an additional test to be able to make a decision by performing Kwiatkowski-Phillips-Schmidt-Shin test for stationarity (KPSS test) for this series, which indicates that LNRGDPK is I(1). Since none of the series are I(2), we proceed with the ARDL estimation.
Table 4.3: Unit Root Tests
Level First Differences
Variables Constant Constant and Linear Trend
Constant Constant and Linear Trend
t-Statistic Prob t-Statistic Prob t-Statistic Prob t-Statistic Prob ADF Test LNREER -0.982 0.758 -2.479 0.3379 -7.554 0.0000 -7.517 0.0000 LNOILP -1.867 0.3468 -1.834 0.6811 -5.140 0.0000 -5.342 0.0001 LNOILX -1.457 0.5513 -3.886 0.0159 -17.029 0.0000 -16.948 0.0000 LNGEXP -1.792 0.3828 -2.322 0.4183 -5.163 0.0000 -5.171 0.0002 LNNFA -3.034 0.0349 -0.980 0.9417 -10.953 0.0000 -12.214 0.0000 LNRGDPK -0.264 0.9253 -2.410 0.3724 -3.467 0.0108 -3.368 0.0613 PP test LNREER -0.898 0.7855 -2.347 0.4049 -7.522 0.0000 -7.485 0.0000 LNOILP -1.401 0.5792 -1.240 0.8965 -4.951 0.0001 -5.011 0.0004 LNOILX -2.166 0.2198 -6.562 0.0000 -17.029 0.0000 -16.948 0.0000 LNGEXP -1.841 0.3591 -2.080 0.5507 -2.966 0.0414 -3.023 0.1309 LNNFA -3.131 0.0273 -0.803 0.9615 -11.028 0.0000 -12.177 0.0000 LNRGDPK -0.815 0.8107 -1.493 0.8262 -2.305 0.1724 -2.321 0.4186
4.3. Empirical Results 4.3.1. ARDL Model
The first step of the analysis is to run an ARDL (p,q) model, with p lags for the dependent variable and q lags for the independent variables. The optimal lags are selected by using the Schwarz Criterion (SC). This procedure requires the specification of a maximum lag length, which are 12 lags in our case since we have monthly data. We include 11 seasonal (monthly) dummies in the regression equation to control for seasonal effects.
Out of the 10 000 models that are run with 12 lags (p=q=12) ARDL (3,1,1,0,1,2) model is selected. However, serial correlation test indicates that there was autocorrelation, and Ramsey's RESET test indicated functional form misspecification. In order to fix these problems we modified the lag structure of the selected model, and after several trials we selected ARDL (2,2,2,3,1,1) as the best model. Table 4.4 shows the results from this model.
Table 4.4. Autoregressive Distributed Lag Estimates
Regressor Coefficient Standard Error T-Ratio[Prob]
LNREER(-1) 0.84453 0.12357 6.8343[0.000] LNREER(-2) -0.15289 0.11216 -1.3631[0.177] LNOILP -0.093466 0.023703 -3.9433[0.000] LNOILP(-1) 0.06736 0.036757 1.8326[0.071] LNOILP(-2) -0.015136 0.025871 -0.58507[0.560] LNOILX -0.026856 0.027913 -0.96214[0.339] LNOILX(-1) -0.057863 0.028208 -2.0513[0.044] LNOILX(-2) -0.034696 0.028493 -1.2177[0.228] LNGEXP -0.19797 0.70488 -0.28086[0.780] LNGEXP(-1) 1.0003 1.804 0.55447[0.581] LNGEXP(-2) -1.2392 1.7926 -0.69127[0.492] LNGEXP(-3) 0.44305 0.69054 0.64161[0.523] LNNFA -0.077954 0.043856 -1.7775[0.080] LNNFA(-1) 0.099662 0.040248 2.4762[0.016] LNRGDPK 1.8529 0.79548 2.3292[0.023] LNRGDPK(-1) -1.816 0.81041 -2.2409[0.028] CONSTANT 2.8732 0.98795 2.9083[0.005] TREND 0.0012095 3.55E-04 3.4063[0.001]
4.3.2. Bounds Testing
F statistics obtained from the estimation of equation 4.5 is used to conduct the bounds test. This F statistic is compared with the critical values given in Pesaran, et-al (2001). The null hypothesis of the test is that there is no co-integration between the variables. If the calculated F statistic is higher than the I(1) bound, the null hypothesis is rejected. If the calculated F statistic is less than the I(0) bound, this means there is no co-integration, that is, the null hypothesis is not rejected. The test inconclusive if the calculated F statistic is between the upper limit and the lower limit.
Bounds test results indicate that the null hypothesis is rejected, since the calculated F statistic is 4.2603 is higher that the upper critical value. Hence, we can conclude that there is co-integration between LNREER and the other variables listed in the table (LNOILP, LNOILX, LNGEXP, LNNFA, and LNRGDPK).
Table 4.5: Bounds Test Results
Result 95% Upper Bound 95% Lower Bound F-stat, Dependent variable Co-integration 4.0982 2.9964 4.2603 F(LNREER/LNOILP,LNOILX, LNGEXP, LNNFA, LNRGDPK) 4.3.3. Long-run relationship
Long run coefficients are given in Table 4.6 The long-run coefficient between the real exchange rate (LNREER) and the oil price (LNOILP) is -0.13375, and significant. This means that when OILP increases by one percent REER decreases (depreciates) by approximately 0.13 percent. This result also means that that, in the Iraq during the period under study, there was no evidence of Dutch disease hypothesis, which predicts that Iraqi RER would appreciate.
The long-run coefficient between LNREER and LNOILX is -0.38726 and significant; meaning that when oil exports increase by one percent REER decreases by approximately 0.39 percent. The results reported in Table 4.6 also indicate that there is no long long-run relationship between the REER and the other variables.
Table 4.6: Long Run Coefficients
Regressor Coefficient Standard Error T-Ratio [Prob]
LNOILP -0.13375 0.035845 -3.7313 [0.000] LNOILX -0.38726 0.10821 -3.5787 [0.001] LNGEXP 0.019905 0.12995 0.15318 [0.879] LNNFA 0.070397 0.10735 0.65580 [0.514] LNRGDPK 0.11953 0.2414 0.49517 [0.622] INPT 9.3179 3.2577 2.8602 [0.006] TREND 0.0039225 0.0010003 3.9213 [0.000]
The most likely explanation for this counterintuitive finding of a negative relationship between REER and oil prices is that REER and oil prices move in the opposite direction in the later months of the period (see Figure 2.5). Oil prices gradually decrease after 2011M04, while Iraqi REER continues to appreciate. Appreciation of the REER might be due to rising government expenditures, net foreign assets, real GDP. Although these variables are not individually significant, their combined effect might have pushed the REER upwards.
4.3.4. Short run relationship
As mentioned above the error correction model (ECM), equation 4.3, is used to analyze the dynamic relationship in the short run. Results for the model are reported in Table 4.7. We can see from the table that error correction term ecm(-1) is negative and significant. This means that about 31percent of errors (any deviations from equilibrium) are corrected for within a month.
Table 4.7: Error Correction Representation
Regressor Coefficient Standard Error T-Ratio[Prob]
dLNREER1 0.15289 0.11216 1.3631[0.177] dLNOILP -0.09347 0.023703 -3.9433[0.000] dLNOILP1 0.015136 0.025871 0.58507[0.560] dLNOILX -0.02686 0.027913 -0.96214[0.339] dLNOILX1 0.034696 0.028493 1.2177[0.227] dLNGEXP -0.19797 0.70488 -0.28086[0.780] dLNGEXP1 0.79616 1.1631 0.68450[0.496] dLNGEXP2 -0.44305 0.69054 -0.64161[0.523] dLNNFA -0.07795 0.043856 -1.7775[0.080] dLNRGDPK 1.8529 0.79548 2.3292[0.023] dTREND 0.00121 3.55E-04 3.4063[0.001] ecm(-1) -0.30836 0.069587 -4.4313[0.000] 4.3.5. Diagnostic Tests
Diagnostic test results are given in Table 4.8. None of the test results t indicate any problems with the model. CUSUM and CUSUM of squares are plotted in Figures 4.7 and 4.8 together with the 5 percent critical lines. These results indicate that model parameters are stable since neither series go outside the area between the critical lines.
Table 4.8: Diagnostic Test Results
df Prob. Test stat. Type Test 124 0.114 18.0539 χ2 A: Serial Correlation (1,66) 0.524 0.40975 F B: Functional Form 2 0.752 0.56907 χ2 C: Normality 1 0.206 1.6000 χ2 D: Heteroscedasticity
Figure 4.7: Plot of the CUSUM Stability Test
4.3.6. The Toda and Yamamoto Causality Analysis
In order conduct the Toda and Yamamoto (1995) causality test we proceed as follows
1- Select the optimal lag length (k) of the VAR model by using the Schwarz criterion.
2- Check for unit roots, autocorrelation, and other problems.
3- The correct model specified in the previous step is run with an extra lag for all the variables in the model. The lag length is determined by maximum order of integration in the model (dmax). Since dmax=1, we estimate (k +
dmax) th order VAR. In Eviews10, this can be done by adding an extra lag on all the variables in the exogenous variables box.
4- In the final step, the Granger causality test is done by using the VAR Granger causality/Block Exogeneity Wald Test, with the null hypothesis that X does NOT cause Y.
Test results are reported in Table 4.9. These results show that there is one-way causality from LREER to LNOILP, from LNRGDP to LNGEXP, and from LNREER to LNRGDPK.
Table 4.9: Toda-Yamamoto Results
VAR Granger Causality/Block Exogeneity Wald Tests Date: 06/20/19 Time: 15:11
Sample: 2007M01 2015M12 Included observations: 104
Dependent variable: LREER
Excluded Chi-sq df Prob.
LOILP 6.061259 3 0.1087 LOILX 2.274340 3 0.5175 LNGEXP 6.678983 3 0.0829 LNFA 4.357851 3 0.2253 LRGDPK 3.909075 3 0.2715 All 28.72461 15 0.0174
Dependent variable: LOILP
Excluded Chi-sq df Prob.
LREER 10.68614 3 0.0135 LOILX 4.851906 3 0.1830 LNGEXP 2.873305 3 0.4116 LNFA 4.398459 3 0.2215 LRGDPK 2.560866 3 0.4644 All 21.46455 15 0.1226
Table 4.9: Continues
Dependent variable: LOILX
Excluded Chi-sq df Prob.
LREER 4.356663 3 0.2254 LOILP 2.770011 3 0.4285 LNGEXP 2.413502 3 0.4911 LNFA 3.068988 3 0.3811 LRGDPK 0.591911 3 0.8983 All 16.56388 15 0.3456
Dependent variable: LNGEXP
Excluded Chi-sq df Prob.
LREER 2.187982 3 0.5343 LOILP 1.946055 3 0.5837 LOILX 6.465082 3 0.0910 LNFA 2.712589 3 0.4381 LRGDPK 20.93444 3 0.0001 All 32.99080 15 0.0047
Dependent variable: LNFA
Excluded Chi-sq df Prob.
LREER 2.279055 3 0.5165 LOILP 0.823081 3 0.8439 LOILX 3.545205 3 0.3149 LNGEXP 5.499973 3 0.1386 LRGDPK 1.465128 3 0.6903 All 14.53939 15 0.4851
Table 4.9: Continues
Dependent variable: LRGDPK
Excluded Chi-sq df Prob.
LREER 11.22407 3 0.0106 LOILP 5.807373 3 0.1214 LOILX 5.676804 3 0.1284 LNGEXP 0.824801 3 0.8435 LNFA 3.893597 3 0.2732 All 21.67403 15 0.1166
CHAPTER Ⅴ
CONCLUSION
The aim of this study is to understand the relationship between crude oil prices and real effective exchange rate within the framework of Dutch disease hypothesis. This hypothesis predicts that increasing oil prices would lead to an appreciation in the real exchange rate. We use ARDL bounds testing methodology to test for co-integration, and Toda-Yamomoto (1995) approach for causality testing. Our model includes real effective exchange rate as the dependent variable and oil prices, oil exports, general government final consumption expenditure, net foreign assets, and real gross domestic product per capita as independent variables. Monthly data for the period from January 2007 to December 2015 were used for the estimations.
We find co-integration among the above listed variables. Toda-Yamamoto causality test results show that there is a one way Granger causality between the real exchange rate and oil price, there is a one way Granger causality between real gross domestic product per capita and general government final consumption expenditure, and there is a one way Granger causality between real exchange rate and real gross domestic product per capital. Regression results obtained in this study do not support the Dutch disease hypothesis since the coefficient of oil price is significant but negative.
Dutch disease refers to the harmful effects arising from the exploitation of natural resources, including oil, such as the decline that can occur in other sectors, especially the manufacturing. The increasing revenues in the oil sector leads to the
collapse of the other productive sectors due to the rise in the value of the local currency, and the low competitiveness of the tradable good sector in world markets.
Analysis of the recent developments in oil, manufacturing, and service sectors show that Iraqi economy might have started to show some signs of Dutch disease. The share of the oil sector in GDP and total employment shows an upward trend un recent years, while there is a slight downward trend or stagnation in these shares in the other two sectors. This might mean that the Iraqi economy is getting exposed to Dutch disease.
Avoiding the potential harmful effects of Dutch disease would require the creation of an investment environment conducive to the development of manufacturing sector in order to increase its share in GDP. Raising the productivity of the manufacturing sector and increasing its competitiveness through quality improvements and cost reductions would support the development of the sector by creating additional demand for its products.
Macroeconomic policy-making can help by giving greater consideration to the real exchange rate, and by the promotion of exports of goods from non-oil sectors, especially the manufacturing sector. Economic policymaking might also be instrumental in diversifying the production base to create or increase sources of revenue, other than that those come from sale of oil.
BIBLIOGRAPHY
Akram, Q. F., (2002). "Oil prices and exchange rates: Norwegian evidence", Norges Bank'sWorking papers, Research Department.
Al-Hitti, A. (2000). "Oil Economics", Mosul, Dar Al Kutub for Printing and Publishing.
Alnasrawi, A. (1994). The economy of Iraq: Oil, wars, destruction of development and prospects, 1950-2010
ALshammari, M. (2010). "Diagnosis of the Dutch disease and the foundations of reform of the rent economy in Iraq", Al-Ghari Journal of Economic and Administrative Sciences, University of Kufa, Iraq, Vol A, No. 15.
Al-Shammari, Nayef, Noura Al-Hossayan, Mariam Behbehani, (2018) "Diagnosing the curse of natural resources in Kuwait", Journal of Economic and Administrative Sciences.
Auty, R. (2001). "Resource abundance and economic development". Oxford: Oxford University Press.
Breihi F. (2011). "The Iraqi Economy Opportunities and Challenges Analytical Study of Economic Indicators and Human Development", Journal of the Baghdad College of Economics, Baghdad University No. 27.
Breihi, A. (2012). "International Financial Economy and Monetary Policy", Hammurabi Center for Research and Strategic Studies.
Chen, Y.C., Rogoff, K. (2003), Commodity currencies, Journal of International Economics vol 60(1), pp. 133-60.
Chen , et al .(2013). "Exchange rate and oil price: asymmetric adjustment ". Taylor & Francis. http://dx.doi.org/10.1080/13504851.2013.770118
Corden, W. M., & Neary, J. P. (1982). Booming sector and de-industrialisation in a small open economy. The economic journal, 92(368), 825-848.
Corden, W. M. (1984). Booming sector and Dutch disease economics: survey and consolidation. oxford economic Papers, 36(3), 359-380.