İbrahim Hüseyni, Miraç Eren
,
and Ali Kemal Çelik / Montenegrin Journal of Economics, Vol. 13, No. 3 (2017), 63-7363 ‘
Examining the Relationship Among Economic Growth, Exports
and Total Productivity for OECD Countries Using Data
Envelopment Analysis and Panel Data Analyses
İBRAHİM HÜSEYNİ
1,
MİRAÇ EREN
2, and
ALI KEMAL ÇELİK
31Assistant Professor, Şırnak University, Faculty of Economics and Administrative Sciences, Department of Econom-ics, Şırnak, Turkey, e-mail: [email protected]
2 Assistant Professor, Ondokuz Mayıs University, Faculty of Economics and Administrative Sciences, Department of Economics, Samsun, Turkey, e-mail: [email protected]
3 Research Assistant, Ardahan University, Faculty of Economics and Administrative Sciences, Department of Quanti-tative Methods, Ardahan, Turkey, e-mail: [email protected]
A R T I C L E I N F O
A B S T R A C T
Received May 07, 2017Revised from June 29, 2017 Accepted August, 01 2017
Available online September 15, 2017
The main objective of this paper is to explore the relationship be-tween Total Factor Productivity (TFP) and economic growth and exports for OECD countries for the sample period 1990-2013. For this purpose, firstly, TFP values were calculated using data envel-opment analysis (DEA) for the corresponding countries within the availability of their labor force and fixed capital formation data for the relevant sample period. Secondly, several panel data analyses were performed to determine the impact of TFP values on economic growth and exports of OECD countries. Consequently, results reveal a statistically significant positive impact of TFP on both economic growth and exports for OECD countries.
JEL classification:
B23, C33, C44
DOI: 10.14254/1800-5845/2017.13-3.6 Keywords:
total factor productivity, data envelopment analysis, economic growth,
panel data analysis
INTRODUCTION
As economic growth plays a key role on individuals’ employment with ease and potential in-creases on individuals’ welfare in a country, economic growth is essentially considered as one of the most important macroeconomic goals for decision-makers. Economic growth generally refers to a real increase on GDP that implies the sum of all final good and services produced by domestic and foreign individuals in a country (Siegel, 2005). The relevant real increases are mostly deter-mined by capital stocks, labor force and TFP (Saygılı and Cihan, 2008). Economists concentrated on understanding the sources of economic growth have typically been discussed the debate under
Montenegrin Journal of Economics
Vol. 13, No. 3 (2017), 63-73İbrahim Hüseyni, Miraç Eren
,
and Ali Kemal Çelik / Montenegrin Journal of Economics, Vol. 13, No. 3, (2017), 63-7364
Neo-Classical Growth Theory. The corresponding theory purposes that capital stocks and popuıla-tion are considered as endogeneous variables and their impact regarding diminishing returns to scale decreases. Therefore, in Neo-Classical theory, exogeneous TFP variable is commonly adopted as the main determinant of long-term economic growth which also reflects technological develop-ment level (Solow, 1956).
The effective and efficient use of scarce resources for any country is considered as a key fac-tor for sustainable growth and a possible increase on welfare levels (Kara and Seyhan, 2016). For the Neo-Classical model, exports data of a country commonly were commonly used to represent exogeneous TFP variable in the existing literature. Many earlier studies ((Emery, 1967; Syron ve Walsh, 1968; Michaely, 1977; Balassa, 1978,1988; Tyler, 1981; Smith, 2000; Altıntaş ve Çetintaş, 2011; Korkmaz, 2014; Kumari ve Malhotra, 2015; Kaya ve Hüseyni, 2015) have found that exports have a positive impact on economic growth. On the other hand, some prior research calculates TFP values in line with “growth accounting” approach proposed by Solow (1956). The corresponding approach proposes that unexplained changes on economic growth are interpreted as technological advances, namely TFP, after increases on fixed capital formation and labor force factors are excluded (Kolsuz and Yeldan, 2014). Particularly, prior research regarding this ap-proach (Kim and Lau, 1994), Baier et al., 2002, Han et al., 2004, İsmihan and Metin-Özcan, 2006, Saygılı and Cihan, 2008, Adak, 2009, Ateş, 2013) also demonstrates there exists a statistically significant positive relationship between TFP and economic growth. However, the corresponding model is occasionally criticized as average annual data are utilized and coefficients of production function are assumptively calculated (Saygılı and Cihan, 2008).
This paper purposes to determine the relationship between TFP and economic growth and ex-ports for OECD countries for 1990-2013 sample period. This paper performs the DEA instead of growth accounting method to obtain TFP values. Moreover, the relationship between TFP and eco-nomic growth and exports were examined using panel data analyses. The remainder of the present paper is as follows. Second section introduces the data and the methodology and presents analy-sis results. The paper concludes with discussion of analyanaly-sis results and recommendations.
1. ECONOMETRIC METHOD AND DATA
This paper utilizes the annual data of OECD countries for the period between 1990 and 2013 expect for the data of Slovenia, Slovakia and Estonia as the relevant data are not available. Firstly, the data of total employed labor and fixed capital formation with re-spect to fixed costs in 2005 were considered as input variable and the data of GDP were considered as output variable. Hence, a DEA was performed to obtain TFP values for the corresponding OECD countries for 1990-2013 period. Secondly, the impact of TFP on eco-nomic growth was examined using the framework as the following:
EGRit = β0 + β1TFPit + β2İHRit + εit (1)
EGRit = β0 + β1TFPit + β2 GFCFit + εit (2)
EGRit = β0 + β1TFPit + β2 GFCFit + β3İHRit + εit (3)
In Equation (1)-(3), EGR indicates GDP growth data of OECD countries; İHR indicates exports; GFCF indicates fixed capital formation with respect to 2005 fixed costs; i indicates a country; t indicates time period (in years) and ε indicates error term. Furthermore, Equa-tion (4) formulates the impact of TFP on exports as follows:
TFPit = β0 + β1İHRit + εit (4)
İbrahim Hüseyni, Miraç Eren
,
and Ali Kemal Çelik / Montenegrin Journal of Economics, Vol. 13, No. 3 (2017), 63-7365 to use their production factors more efficiently.
1.1 Data Envelopment Analysis
DEA is a frequently-used nonparametric method that evaluates relative efficiency for a set of comparative certain mathematical programming models. (Førsund and Sarafoglou, 2002). The units of a DEA is commonly referred to decision making units (DMUs). DEA is particularly designed to assess efficiency using multiple inputs and outputs, while two models including constant returns to scale (CRS) and variable returns to scale (VRS) mod-els were proposed in 1978 and 1984, respectively. In recent years, two other advanced models such as the Additive model and Slacks-Based Measure of Efficiency (SBM) were also proposed (Cooper et al., 2011). The main purpose of DEA is to measure the efficiency of DMUs. Such DMUs are evaluated as inefficient when they are inefficiently operated or they have a disadvantageous status under certain conditions (Kutlar and Babacan, 2008). The efficiency was generally determined by obtaining a scale efficiency score and the un-derlying score is calculated by dividing CRS efficiency score to VRS efficiency score.
Many DEA models can be fitted regarding various purposes and assumptions. These models can mainly be divided into two main groups including input- and output-oriented models. Input-oriented models investigates how much degree inefficient DMUs should de-crease their inputs for any output level. Similarly, for any input component, output-oriented models seeks to determine how much degree inefficient DMUs should increase their out-put to become efficient DMUs. Alternatively, when neither of inout-put- nor outout-put-oriented models can be fitted, aggregate models can be performed. Consequently, input-oriented models seek to measure technical inefficiency by decreasing input use relatively in a fixed output level, whereas output-oriented models purpose to measure technical efficiency by increasing output use relatively in a fixed input level. The underlying two measures give the same value under CRS, while somewhat different values under VRS. Most of earlier stud-ies in the existing literature commonly perform input-oriented models as input value preemptively appears as a DMU. However, under fixed resources, several cases may be encountered that necessiate increasing outputs to their maximum values. In such circum-stances, ouput-oriented models would be more appropriate for the analysis. The decision of the orientation choice has a small impact on obtained efficiency scores (Coelli and Pe-relman, 2000).
When a DMU has a maximum value, its is regarded as a efficient unit. However, some-times all DMUs in the model may be efficient. In this circumstance, a super-efficiency model was proposed by Andersen and Petersen (1993) to rank all efficient DMUs. Super-efficiency models are performed when a DMU under evaluation is not included in the ref-erence set of original DEA models. Super-efficiency DEA model can also be fitted with re-spect to both CRS and VRS (Ebadi, 2012). In order ro avoid unfeasbility issue due to con-vexity constraint for VRS, the vector form of CRS model proposed by Andersen and Pe-tersen (1993) is as the following:
*
, ,mins s, es
(5)
İbrahim Hüseyni, Miraç Eren
,
and Ali Kemal Çelik / Montenegrin Journal of Economics, Vol. 13, No. 3, (2017), 63-73 66 1, 1, n o j j j o n o j j j o x x s y y s
(6)In Equations (5) and (6), all ’s are constrained variables to compensates ve s are
not negative;
> 0 indicates a classical regulatory element and e indicates a row vector which refers to 1 for all elements. The corresponding model is a member of input-oriented CCR model. Output-oriented form of this model has optimal ** 1
, *, *
s , and *
s components by dividing *(Andersen and Petersen, 1993).
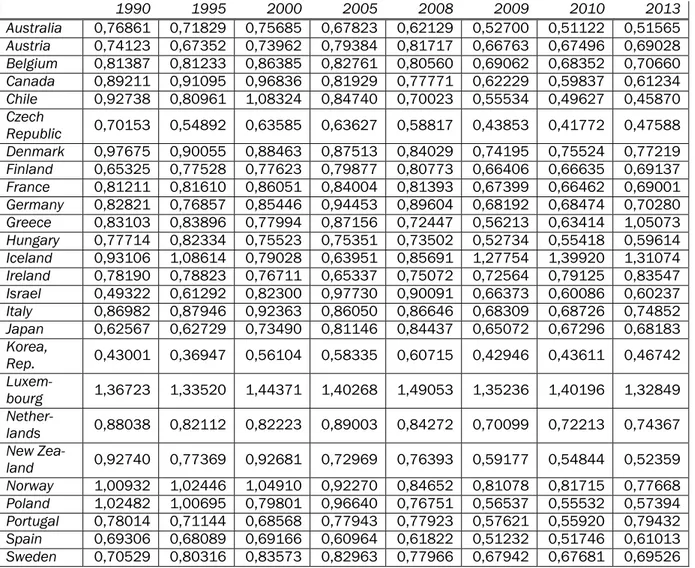
In this study, efficiency scores were calculated for employed labor, fixed capital for-mation and GDP values of each OECD countries between 1990 and 2013. A possible in-crease on relevant efficiency scores implies that this country uses employed labor, fixed capital formation and GDP factors more efficient. Table 1 presents efficiency scores for OECD countries for selected years.
Table 1. Efficiency scores for OECD countries
1990 1995 2000 2005 2008 2009 2010 2013 Australia 0,76861 0,71829 0,75685 0,67823 0,62129 0,52700 0,51122 0,51565 Austria 0,74123 0,67352 0,73962 0,79384 0,81717 0,66763 0,67496 0,69028 Belgium 0,81387 0,81233 0,86385 0,82761 0,80560 0,69062 0,68352 0,70660 Canada 0,89211 0,91095 0,96836 0,81929 0,77771 0,62229 0,59837 0,61234 Chile 0,92738 0,80961 1,08324 0,84740 0,70023 0,55534 0,49627 0,45870 Czech Republic 0,70153 0,54892 0,63585 0,63627 0,58817 0,43853 0,41772 0,47588 Denmark 0,97675 0,90055 0,88463 0,87513 0,84029 0,74195 0,75524 0,77219 Finland 0,65325 0,77528 0,77623 0,79877 0,80773 0,66406 0,66635 0,69137 France 0,81211 0,81610 0,86051 0,84004 0,81393 0,67399 0,66462 0,69001 Germany 0,82821 0,76857 0,85446 0,94453 0,89604 0,68192 0,68474 0,70280 Greece 0,83103 0,83896 0,77994 0,87156 0,72447 0,56213 0,63414 1,05073 Hungary 0,77714 0,82334 0,75523 0,75351 0,73502 0,52734 0,55418 0,59614 Iceland 0,93106 1,08614 0,79028 0,63951 0,85691 1,27754 1,39920 1,31074 Ireland 0,78190 0,78823 0,76711 0,65337 0,75072 0,72564 0,79125 0,83547 Israel 0,49322 0,61292 0,82300 0,97730 0,90091 0,66373 0,60086 0,60237 Italy 0,86982 0,87946 0,92363 0,86050 0,86646 0,68309 0,68726 0,74852 Japan 0,62567 0,62729 0,73490 0,81146 0,84437 0,65072 0,67296 0,68183 Korea, Rep. 0,43001 0,36947 0,56104 0,58335 0,60715 0,42946 0,43611 0,46742 Luxem-bourg 1,36723 1,33520 1,44371 1,40268 1,49053 1,35236 1,40196 1,32849 Nether-lands 0,88038 0,82112 0,82223 0,89003 0,84272 0,70099 0,72213 0,74367 New Zea-land 0,92740 0,77369 0,92681 0,72969 0,76393 0,59177 0,54844 0,52359 Norway 1,00932 1,02446 1,04910 0,92270 0,84652 0,81078 0,81715 0,77668 Poland 1,02482 1,00695 0,79801 0,96640 0,76751 0,56537 0,55532 0,57394 Portugal 0,78014 0,71144 0,68568 0,77943 0,77923 0,57621 0,55920 0,79432 Spain 0,69306 0,68089 0,69166 0,60964 0,61822 0,51232 0,51746 0,61013 Sweden 0,70529 0,80316 0,83573 0,82963 0,77966 0,67942 0,67681 0,69526
İbrahim Hüseyni, Miraç Eren
,
and Ali Kemal Çelik / Montenegrin Journal of Economics, Vol. 13, No. 3 (2017), 63-73 67 Switzer-land 0,75934 0,73883 0,75238 0,76420 0,80186 0,72901 0,70411 0,72186 Turkey 0,85438 0,83109 0,91379 0,85603 0,86534 0,71668 0,56537 0,56686 United Kingdom 1,04814 0,83593 0,96674 1,03792 1,12344 0,78739 0,76425 0,76844 United States 0,94174 0,83946 0,81271 0,81082 0,88701 0,75808 0,75929 0,77328As shown in Table 1, the US, Norway and Luxembourg have the highest efficieny scores, whereas efficiency scores drammatically decrease after 2008 Global Economic Crisis.
1.2 Panel Analysis
Panel data are obtained by combining repeated observations of DMUs such as individ-ual, household, and firms in a certain time period (Verbeek, 2008). As well as time series, panel data series should be stationary and relevant stationary tests should be performed for reliability (Tatoğlu, 2012). Unit root stationary tests are divided into first- and second-generation unit root tests with respect to the presence of cross-sectional dependence. First-generation unit root tests assume unit independency, namely, all units are equally affected by any shocks treated to a single unit. Furthermore, second-generation unit root tests assume that all units may not be equally affected by any shocks. Series which do not have cross-sectional dependence can be examined using various unit root tests including Hadri (2000), Levin, Lin and Chu ( 2002), Breitung ( 2005), Im, Pesaran and Shin ( 2003), and Maddala and Wu ( 1999), while these unit root tests may not provide reliable results in case of cross-sectional dependence issue. In such a circumstance, second-generation unit root tests including Taylor and Sarno (1998), Breuer, McNown and Wallace (2002), Peseran (2007), and Hadri and Kurozumi (2012) may be utilized that allow cross-sectional dependence across units of panels.
In order to test cross-sectional dependence for panel data, both time and cross-section dimension should be considered. When time dimension is greater than cross-section di-mension (T>N), Breusch and Pagan (1980) CDLM1 tests can be performed. In contrast, when time dimension is smaller than cross-section dimension (T<N) Pesaran (2004) CDLM2 tests can be utilized. However, Breusch and Pagan (1980) CDLM1 test may give biased results when group mean is equal to zero and unit mean is different from zero. Pesaran et al., (2008) proposed an adjusted LM test statistics including variance and mean to avoid this issue. Breusch and Pagan (1980) defines the LM test as the following:
1 1 2 n j i n i j ij T LM (7)In Equation (7), two-way correlation among error series is defined as follows:
1/2 1 2 2 / 1 1 2 1
T j jt T t it T t it jt ji ij e e e e (8)İbrahim Hüseyni, Miraç Eren
,
and Ali Kemal Çelik / Montenegrin Journal of Economics, Vol. 13, No. 3, (2017), 63-7368
In Equation (8), refers to error series obtained from each unit using ordinary least squares method for T observation when i = 1, …, N. However, prior Monte-Carlo simula-tions exhibit that Breusch and Pagan (1980) standard LM test may not be appropriate in case of N > T. Pesaran (2004) proposed CDLM2 test that overcomes this drawback by tak-ing the average of correlation coefficients among error terms. Hence, CDLM2 test can also be performed for large N and small T values (Baltagi, 2008). Cross-section dependence can be formulated as follows:
1 1 2 1 ) 1 ( 2 n j i n i j ij N N T CD (9)The LM test is adjusted by Pesaran et. al. (2008) when group mean is zero and unit mean is different from zero, as the following:
1 1 2 * * ( ) ) 1 ( 2 n j i n i j Tij Tij ij adj u K T N N T NLM LM
(10)The adjusted LM test gives more robust results than Pesaran (2004) CDLM2 when unit mean ( and variance ( are included in the test statistic when individual mean is different from zero (Pesaran et al., 2008). The test statistic is normally-distributed and the null and alternative hypotheses are as follows:
H0= There is no cross-section dependence among units.
H1= There exist a cross-section dependence among units.
When the underlying test statistic is greater than table value, H0 null hypothesis is
re-jected implying that there exists a cross-section dependence among units. On the contrary, when the test statistic is smaller than table value, it implies that there is no cross-section dependence among series of panel.
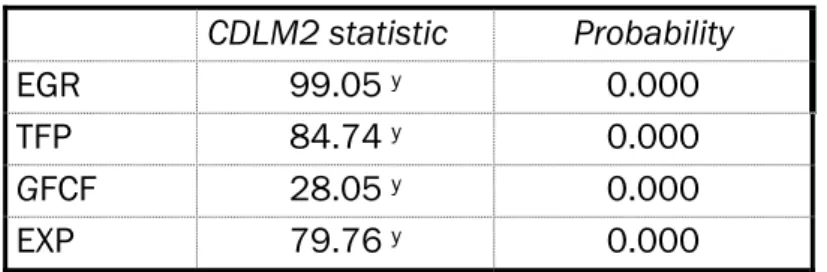
Since N > T, this paper utilized from CDLM2 test for cross-section dependence test of variables and Table 2 presents CDLM2 test results. As shown in Table 2, there exists a cross-dependence among variables since all probability values are smaller than 0.05 sig-nificance level.
Table 2. Cross-section dependence test results
CDLM2 statistic Probability
EGR 99.05 y 0.000
TFP 84.74 y 0.000
GFCF 28.05 y 0.000
EXP 79.76 y 0.000
İbrahim Hüseyni, Miraç Eren
,
and Ali Kemal Çelik / Montenegrin Journal of Economics, Vol. 13, No. 3 (2017), 63-7369 Due to the presence of cross-section dependence among variables, Peseran (2007) CADF unit root test was performed that allows cross-dependence among variables. CADF unit root test provides reliable output for both N > T and N < T cases. For the correspond-ing unit root test, test statistics are calculated as the followcorrespond-ing (Pesaran, 2007),
1/2 1 ' 1 2 1 ' ) , ( i i i i i i y M y y M y T N t (11) where,)
,
,
(
1
y
y
tM
τ =)
,
,
,
(
y
1y
2y
ty
)'
,
,
,
(
0 1 1 1
t ty
y
y
y
4 , ' 2 T y M yi iw i After CADF test statistic is calculated, CIPS value is calculated as follows:
n i T N t N CIPS 1 1 ( , )The obtained values are compared with critical values generated by Pesaran (2007). When CIPS value is greater than table value, H0 null hypothesis is rejected implying that
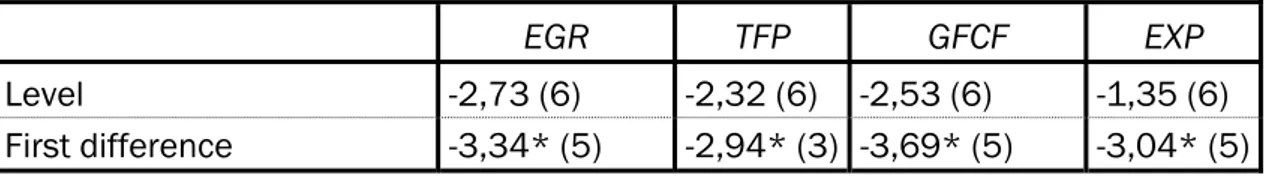
there is not unit root for the relevant variable (Pesaran, 2007). Table 3 presents CADF unit root test results in terms of stationary.
Table 3. CADF unit root test results for variables used in the model
EGR TFP GFCF EXP
Level -2,73 (6) -2,32 (6) -2,53 (6) -1,35 (6)
First difference -3,34* (5) -2,94* (3) -3,69* (5) -3,04* (5)
Table value calculated by Pesaran (2007) is -2.92 for constant trend model in 99% confidence level. Values in parantheses refer to the number of lags. * refers that the rele-vant variable is stationary. As shown in Table 3, all variables were found to be stationary in their first-difference as test statistics were greater than table values. The selection of tests for cointegration when variables are stationary in their first-differences depends on wheth-er the full model has cross-section dependence or not. When thwheth-ere is not cross-section dependence in a model, Johansen (1988), Kao (1999) and Pedroni (1999) cointegration tests provide reliable results. In contrast, when the model has a cross-section dependence second-generation unit roots tests such as Westerlund and Edgerton (2007) and Wester-lund (2008) provide more robust results that allow cross-section dependence.
İbrahim Hüseyni, Miraç Eren
,
and Ali Kemal Çelik / Montenegrin Journal of Economics, Vol. 13, No. 3, (2017), 63-7370
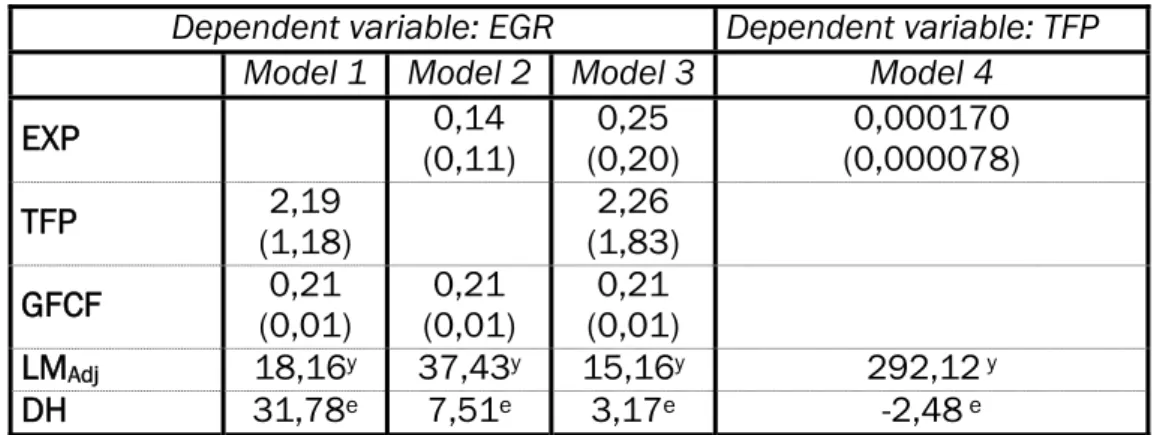
Table 4 presents co-integration and CCE estimation results for fitted models in the present study. As shown in Table 4, since LMadj values are greater than table value (1.65) in 5%
significance level, there exists a cross-section dependence for each of four models. Thefore, Westerlund (2008) second-generation unit root test was performed. Westerlund (2008) Durbin-h panel cointegration test assumes that autoregressive parameter is the same for all cross-section and when H0 null hypothesis is rejected, it implies that there
ex-ists a cointegration for all cross-sections under the assumption of normally-distributed se-ries (Westerlund, 2008; Göçer, 2013).
Table 4. Cointegration and CCE estimation results
Dependent variable: EGR Dependent variable: TFP Model 1 Model 2 Model 3 Model 4
EXP (0,11) 0,14 (0,20) 0,25 (0,000078) 0,000170
TFP (1,18) 2,19 (1,83) 2,26
GFCF (0,01) 0,21 (0,01) 0,21 (0,01) 0,21
LMAdj 18,16y 37,43y 15,16y 292,12 y
DH 31,78e 7,51e 3,17e -2,48 e
Values in parantheses are standard deviations. y refers to cross-section dependence for
the relevant variable; e refers that the relevant variable is cointegrated.
DH statistic in Table 4 implies that all four models are cointegrated. In this phase, all variables used in this study are ensured to be stationary in the same level and all models were found to be cointegrated. Hence, long-term coefficients were estimated using CCEMG method that allows cross-section dependence (Pesaran, 2006). However, since models have a cross-section dependence, ordinary least squares estimators will be biased. Pe-saran (2006) proposed an adjustment of this biased parameters for each units by includ-ing the average time of variables as an additional variable to the fitted model. When Model 1, 2 and 3 are simultaneously considered, results reveal that both exports and the effi-cient use of production factors, namely TFP, have a positive impact on economic growth. Model 3 considers the efficient use of export and production factors and results from Model 3 put forward that efficiency scores have a more influential impact on economic growth than exports. On the other hand, Model 4 purposes to explain whether exports pro-vide efficient use of production factors or not and findings from Model 4 indicates that exports have a positive impact on the efficient use of production factors. In the light of the corresponding results, it can be concluded that OECD countries have been encouraged to increase their efficiency by providing the transfer of exports to the fields where the effi-ciency of production factors were the highest.
İbrahim Hüseyni, Miraç Eren
,
and Ali Kemal Çelik / Montenegrin Journal of Economics, Vol. 13, No. 3 (2017), 63-7371
CONCLUSION
As one of the most important macroeconomic objectives, economic growth has a signif-icant role on individuals’ potential increases on their welfare and their employment. The most prominent resources of economic growth are regarded as fixed capital formation, employed labor and the efficient use of these factors, namely, TFP. However, since capital and labor force depend upon diminishing returns to scale, TFP is widely adopted as the most significant source of economic growth. The present study mainly examines the im-pact of TFP on economic growth and the imim-pact of exports on TFP of 30 OECD countries for the sample period 1990-2013. For this purpose, firstly, a DEA was performed by con-sidering labor force and capital data as input and GDP data as output variables and effi-ciency scores were calculated for each country under the selected sample period. Second-ly, panel data analyses performed in this study reveal that such efficiency scores have a statistically significant positive impact on economic growth of OECD countries. These find-ings are in line with existing studies concerning TFP within the framework of growth ac-counting.
The presence of positive impact of TFP on economic growth assures that decision-makers may consider TFP as a significant determinant for future economic growth policies. In this sense, future attempts to increase TFP values such as increasing human capital efficiency through qualitative and quantitative educational investments, by improving technological advances through a potential increase on research and development ex-penditures, by decreasing bureaucracy through an improvement on corporate structure may all positively contribute to an increase on economic growth. On the other hand, results of this study put forward that exports have a positive impact on the efficient use of produc-tion factors. This finding designates that the widely-adopted view about exports is also val-id for OECD countries for the sample period 1990-2013 as the underlying view states that exports prevent a waste of resources through the transfer of resources to the most effi-cient areas by means of absolute and/or comparative advantages. Therefore, future poli-cies on encouring exports over TFP may be considered to have a positive impact on eco-nomic growth of countries.
REFERENCES
Altıntaş, H., Çetintaş, H. (2011). "An econometric analysis of the relationships between economic growth, human capital and export in Turkey: 1970-2007", Erciyes University Journal of Faculty
of Economics and Administrative Sciences, Vol. 36, pp. 33-56.
Andersen, P, Petersen, N C. (1993), "A procedure for ranking efficient units in data envelopment analysis". Management science, Vol. 39, No. 10, pp. 1261-1264.
Anwer, M. S., Sampath, R. K. (1997), “Exports and Economıc Growth”, Western Agricultural
Eco-nomics Association Annual Meeting, Nevada.
Balassa, B. (1978), “Export and Economic Growth: Further Evidence”, Journal of Development
Economics, No. 5, pp. 181-189.
Balassa, B.(1988). “The Lessons of East Asian Development: an Overivew”, Economic
Develop-ment and Cultural Change, Vol. 36, No. 3, pp. S273-S290.
Charnes, A., Cooper, W. W, Rhodes, E. (1978), Measuring the efficiency of decision making units,
European journal of operational research, Vol. 2, No. 6, pp. 429-444.
Coelli, T., Perelman, S. (2000), "Technical efficiency of European railways: a distance function ap-proach". Applied Economics, Vol. 32, No. 15, pp. 1967-1976.
İbrahim Hüseyni, Miraç Eren
,
and Ali Kemal Çelik / Montenegrin Journal of Economics, Vol. 13, No. 3, (2017), 63-7372
Cooper, W. W., Seiford, L. M., Stone, K. (2007), Data Envelopment Analysis: A Comprehensive Text
with Models, Applications, References and DEA-Solver Software,: Springer.
Cooper, W. W., Seiford, L. M., Zhu, J. (2011), Data Envelopment Analysis: History, Models and
In-terpretations, Springer.
Dutt, S. D., Ghosh D. (1996), “The Export Growth-Economic Growth Nexus: a Causality Analysis”
The Journal of Developing Areas, Vol. 30, No. 2, pp. 167-182.
Ebadi, S. (2012). "Using a Super Efficiency Model for Ranking units in DEA", Applied Mathematical
Sciences, Vol. 6, No. 41, pp. 2043-2048.
Ekanayake, E.M. (1999), “Exports and Economic Growth in Asian Developing Countries :Cointegration and Error-Correction Models”, Journal of Economic Development, No. 44, pp. 43-56.
Emery, R. F. (1967), “The Relation of Export and Economic Growth”, Kyklos, No. 20, pp. 470-485. Farrell, Michael J. (1957). The measurement of productive efficiency. Journal of the Royal
Statisti-cal Society. Series A (General), Vol. 120, No. 3, pp. 253-290.
Førsund, F. R, Sarafoglou, N. (2002). "On the origins of data envelopment analysis". Journal of
Productivity Analysis, Vol. 17, No. 1-2, pp. 23-40.
Göçer, İ. (2013), "Sustainability of budget deficits in selected OECD countries: Panel co-integration analysis under cross-sectional dependence", Journal of Yaşar University, Vol. 30 No. 8, pp. 5086-5104.
Hock, T.W. (2010), “Exports, Domestic Demand, and Economic Growth in China: Granger Causality Analysis” Review of Development Economics, No. 3, pp. 625-639.
http://databank.worldbank.org/Data/Views/VariableSelection/SelectVariables.aspx?source =Global%20Economic%20Prospects
Kara, M. A., Seyhan, M. (2016), "The notion of productivity and the significance of productivity in firms: The sample of AKFA tea factory", International Journal of Academic Value Studies, Vol. 2, No. 4, pp. 161-169.
Kaya, V., Hüseyni, İ. (2015), "The sectoral structure of export and its impact on economic growth with respect to the distribution on countries: The case of Turkey", Atatürk University Journal of
Economics and Administrative Sciences, Vol. 29, No. 4, pp. 749-773.
Kaynak, M. (2011), Economic Growth Theories, Gazi Publishing, Ankara.
Kolsuz, G., Yeldan, A.E. (2014), Investigating the sources of economic growth in Turkish economy after 1980, Labour and Society, Vol. 40, No. 1, pp. 49-66.
Koopmans, T.C. (1951). Analysis of production as an efficient combination of activities. Activity
analysis of production and allocation, Vol. 13, pp. 33-37.
Kumari, D., Neena, M. (2015), "Export and Economic Growth in Select South Asian Countries: Cau-sality Analysis Based on Granger Test & VECM", Arthshastra: Indian Journal of Economics &
Research, Vol. 4, No. 4, pp. 21-36.
Kutlar, A., Babacan, A. (2008). "CCR efficiency-scale efficiency analysis for public universities in Turkey: A DEA application", Kocaeli University Journal of Social Sciences Institute, Vol. 15, No. 1, pp. 148-172.
Vol. 15, No. 1, pp. 148-172.
Michaely, M. (1977), “Export and Economic Growth: An Emprical Investigation”, Journal of
Devel-opment Economics, Vol. 4, pp. 208-212.
Pedroni, P. (1999), "Critical values for cointegration tests in heterogeneous panels with multiple regressors". Oxford Bulletin of Economics and statistics, Vol. 61, No. S1, pp. 653-670.
Pesaran, M H. (2006), "Estimation and inference in large heterogeneous panels with a multifactor error structure", Econometrica, Vol. 74, No. 4, pp. 967-1012.
Pesaran, M H. (2007), "A simple panel unit root test in the presence of cross‐section dependence".
Journal of Applied Econometrics, Vol. 22, No. 2, pp. 265-312.
Poveda, A. C. (2011), “Economic development and growth in Colombia: An empirical analysis with super-efficiency DEA and panel data models”, Socio-Economic Planning Sciences, Vol. 45, No. 4, pp. 154-164.
İbrahim Hüseyni, Miraç Eren
,
and Ali Kemal Çelik / Montenegrin Journal of Economics, Vol. 13, No. 3 (2017), 63-7373 main problems and potential growth rate for the sample of 1987-2007", Publication No. TÜ-SİAD-T/2008- 06/462, İstanbul.
Shirazi, N.S., Abdul, M. T.E. (2005), “Export-Led Growth Hypothesis: Further Econometric Evidence From South Asia”, The Developing Economies, No. XLIII-4, pp. 472–88.
Siggel, E., 2005), Development Economics: A Policy Analysis Aproach, Ashgate Publishing Compa-ny, Burlington.
Solow, R. M. (1956), “A Contribution to The Theory of Economic Growth”, The quarterly journal of
economics, Vol. 70, No. 1, pp. 65-94.
Syron, R. F., Walsh, M. (1968), “The Relation of Export and Economic Growth: A Note”, Kyklos, Vol. 21, No. 3, pp. 541-545.
Tatoğlu, F. Y. (2012), Advanced Panel Data Analysis with Stata application, Beta Publishing, İstan-bul.
Tatoğlu, F. Y. (2012a), Panel Data Econometric with Stata application, Beta Publishing, İstanbul. Tyler, W.G. (1981), “Growth and Export Expansion in Developing Countries: Some Emprical
Evi-dence”, Journal of Development Economics, No. 9, pp. 59-73.
Ullah, S., Zaman, B. U., Farooq, M., Javid, A. (2009), “Cointegration and Causality between Exports and Economic Growth in Pakistan”, European Journal of Social Sciences, Vol. 10, No. 2, pp. 264-272
Verbeek, M. (2008), A guide to modern econometrics, John Wiley & Sons.
Westerlund, J. (2008). "Panel cointegration tests of the Fisher effect", Journal of Applied
Econo-metrics, Vol. 23, No. 2, pp. 193-233.