Turkish Journal of Field Crops 2013, 18(2), 254-259
RESPONSE OF SIX OAT (Avena sativa L.) CULTIVARS TO NITROGEN
FERTILIZATION FOR AGRONOMICAL TRAITS
Hasan MARAL1, Ziya DUMLUPINAR2*, Tevrican DOKUYUCU3 and Aydin AKKAYA3 1
Karamanoglu Mehmetbey University, Ermenek Vocational School, Karaman, TURKEY. 2
Kahramanmaras Sutcu Imam University, Agricultural Faculty, Department of Agricultural Biotechnology, Kahramanmaras, TURKEY,
3
Kahramanmaras Sutcu Imam University, Agricultural Faculty, Department of Agronomy, Kahramanmaras, TURKEY
*Corresponding author: [email protected] Recieved: 10.07.2013
ABSTRACT
Nitrogen (N) is one of the most important and complex nutrients for the crop plants especially for grain yield and quality. Field trials were carried out in 2007-08 and 2008-09 growing years to investigate response of six oat cultivars (Seydisehir, Apak, Yesilkoy-330, Amasya, Checota and Yesilkoy-1779) to three N rates (0, 10 and 20 kg da-1) for agronomical traits. In the research the traits such as panicle number per m-2 (PN m-2), plant height (PH), grain number per panicle (GNP), grain weight per panicle (GWP), 1000-grain weight (1000-GW), grain yield (GY), biomass (BY) and harvest index (HI) were investigated. Results indicate that agronomical traits significantly differed for the years, cultivars and N rates, except PH for cultivars. Among the cultivars, Checota had the highest GWP, 1000-GW and GY (3.12 g, 38.5 g and 259.6 kg da-1 respectively), while
Seydisehir had the highest PN m-2 and BY (543 PN m-2 and 1666 kg da-1 respectively). Investigated traits were gradually increased with increasing of nitrogen rates. Checota cultivar had the highest GY, while Seydisehir cv. had the highest BY at 20 kg da-1 N rate.
Key words: Agronomical and morphological traits, Avena sativa L., nitrogen rates, oats
INTRODUCTION
Cereals for human nutrition are on the first place in the world and in our country. The oat plant in cereals for animal feed is also healthy and useful addition to the human diet (Barut, 2003; Peterson et al., 2005). In recent years, because of health benefit claims of oat diet, its importance is gradually increased and gave rise to breakfast, snacks, biscuits and baby foods industries (Aman and Graham, 1987; Dokuyucu et al., 2003; Peterson et al., 2005; Guler, 2011; Anttila et al., 2004; Maier et al., 2000).
Oat has been cultured for about 2000 years, and is used as animal feed and human food. As compared to wheat and barley, oat is more sensitive to environmental conditions and oat production has been rather limited world-wide due to its lower resistance to cold and drought as well as shattering, lodging, non-simultaneously maturing and increased yield of maize, wheat, and soybean (Unver et al., 1999; Buerstmayr, 2007). Limited researches on improvement of oat cultivars and its agronomy are the other factors on lower oat production.
Nitrogen fertilization in cereals accounts for significant proportion of the total input costs and may affect plant growth, development, grain yield and quality (Mohr et al., 2005). Nitrogen use efficiency (NUE) for cereal production is approximately 33% in the world. The unaccounted 67% costs a $15.9 billion annual N fertilizer loss. Nitrogen fertilizer loss is caused by gaseous soil de-nitrification, plant emission, surface runoff, volatilization and leaching (Raun and Johnson, 1999). Therefore, determination of optimum nitrogen fertilization level for oat production is also very important because of its relation to lodging and higher grain or biomass yield.
Nitrogen fertilization is still very complex and it is worth to research closely. Its effect is very different due to environmental factors (soil conditions, and climate especially rainfall) and genotype. Therefore, this research was aimed to determine the response of oat cultivars to different nitrogen fertilizations on yield components. The Data related with nitrogen use efficiency obtained from the same research was published by Maral et al. (2012). Therefore, data related with response of oat cultivars to nitrogen fertilization rates on yield components was evaluated in this paper.
MATERIALS AND METHODS
Plant material
Six oat genotypes (Apak, 1779, Yesilkoy-330, Checota, Seydisehir and Amasya) were evaluated for their response to nitrogen rates on agronomical traits.
Field trials
Field experiments were conducted in 2007-08 and 2008-09 cropping years in Kahramanmaras province of Turkey (East–Mediterranean Region of Turkey, located between 37° 53' N, 36° 58'
E and at 507 m altitude). Climate of the region is typical of Mediterranean climate and rainfall data for the experiment years and long-term are given in Fig. 1. The experiment was arranged in a randomized complete block design with three replications. Wheat plant was planted in previous years without fertilization to consume nitrogen amount in the
experiment sites. Some chemical and physical traits of experiment soils, sampled from 0-30 and 30-60 cm top soil are given in Table 1. According to soil analysis, experiment soils were loamy and alkaline, high in lime, adequate in phosphate and potassium and low in organic matter, while almost zero in nitrogen. Soil pH varied from 7.54 to 7.64. The experiments were planted on the date of 18 November 2007 in year one, while 18 November 2008 in the second year. Plot sizes were arranged as 6 x1.2 m with six plant rows in each plot. The planting rate was 350 seeds m-2. Besides different amount and application of N fertilization (0, 10 and 20 kg da-1), a certain amount (8 kg da-1) of phosphorus (P) was applied at planting. Nitrogen was applied twice, at planting and at tillering as top dressing on the dates of 10 March 2008 in year one and 19 February 2009 in year two. Herbicide (Tribenuron–Methyl 75%) was used for weed control, whereas there was no control for pests and diseases.
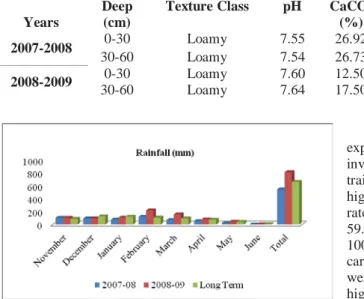
Table 1 Some physical and chemical properties of experiment soils Years
Deep (cm)
Texture Class pH CaCO3
(%) P2O5 (kg da-1) K2O (kg da-1) Organic Matter (%) 2007-2008 0-30 Loamy 7.55 26.92 4.80 40.10 1.85 30-60 Loamy 7.54 26.73 4.50 68.20 1.93 2008-2009 0-30 Loamy 7.60 12.50 4.60 45.80 1.20 30-60 Loamy 7.64 17.50 4.98 48.57 1.22
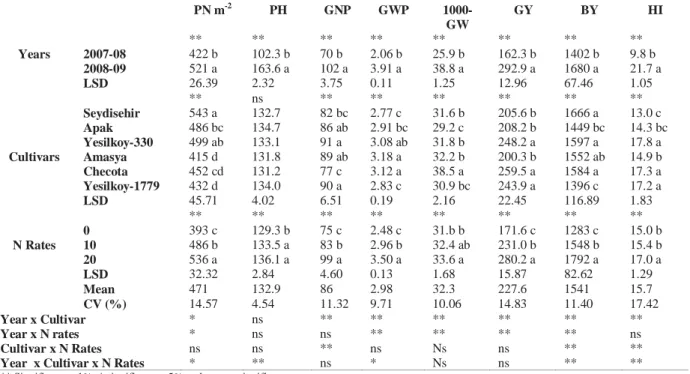
Figure 1 Rainfall data for the experiment years and long-term
for Kahramanmaras province.
Investigated traits
In the experiment, panicle number per m-2 (PN m-2), plant height (PH), grain number per panicle (GNP), grain weight per panicle (GWP), 1000-grain weight (1000-GW), grain yield (GY), biomass (BY), harvest index (HI) were measured.
Data Analysis
The data across two years were analyzed as a factorial design in randomized complete block design by ANOVA, and ranked by using the least significant difference (LSD) mean comparison test (SAS, 1999).
RESULTS AND DISCUSSION
Mean values of two years data belong to cultivars and nitrogen rates for PN, PH, GNP, GWP, 1000-GW, GY, BY and HI are given in Table 2.
Results show that the effect of climatic conditions in experiment years were significantly different for all investigated traits (Table 2). All values for investigated traits in the 2008-09 cropping year were significantly higher than in 2007-08 cropping year. Those increasing rates were 80% for GY, 19.8% for BY, 23.4% PN.m-2, 59.9% for PH, 45% for GNP, 89% for GWP, 49.8% for 1000-GW, and 121% for HI. The experiments were carried out in rainfed conditions. Therefore, these results were due to climatic changes between the years, especially higher rainfall in the second year (Fig. 1). The average grain yield of oat cultivars was 162.3 kg da-1 for first year and 292.9 kg da-1 for second year (Table 2). The great
difference between years for grain yield was due to climatic conditions especially total rainfall in the first year. The low precipitation from March to harvest in 2007 significantly limited the development of oat plant (Fig. 1). Oat grain yield was significantly increased with higher rainfall in January, February, March and April in the second year (Fig. 1). Mahler et al. (1994) reported that differences occur between the years in terms of grain yield was due to total rainfall and the distribution of rainfall during vegetation period.
Among the cultivars, the differences for investigated traits were significant (Table 2). As average of two years, the highest grain yield (259.5 kg da-1) was obtained from Checota cultivar. Grain yields of Yesilkoy-330 (248.2 kg da-1) and Yesilkoy-1779 (243.9 kg da-1) cultivars were also higher than the others and those cultivars were placed in to the same group with Checota cultivar (Table 2). These cultivars (Checota, 330 and Yesilkoy-1779) compared to the average yield of the other cultivars
were provided higher GY at the rate of 26.7%, 21.2% and 19.1%, respectively. As the average of two years, the lowest grain yield (200.3 kg da-1) was obtained from Amasya cultivar (Table 2). Other cultivars Seydisehir (205.6 kg da-1) and Apak (208.2 kg da-1) also were placed in the same group with Amasya cultivar (Table 2). The differences in yield among the genotypes grown in the
same environment were due to genetic influences. Similar results in agreement with our findings were reported by previous works (Yilmaz and Dokuyucu, 1994; Dokuyucu et al., 1997). Gebeyehou et al. (1982) reported great importance of genetic structure, while investigating ecological conditions and cultural practices.
Table 2 Average Data Belong to Investigated Traits
PN m-2 PH GNP GWP 1000-GW GY BY HI Years ** ** ** ** ** ** ** ** 2007-08 422 b 102.3 b 70 b 2.06 b 25.9 b 162.3 b 1402 b 9.8 b 2008-09 521 a 163.6 a 102 a 3.91 a 38.8 a 292.9 a 1680 a 21.7 a LSD 26.39 2.32 3.75 0.11 1.25 12.96 67.46 1.05 ** ns ** ** ** ** ** ** Cultivars Seydisehir 543 a 132.7 82 bc 2.77 c 31.6 b 205.6 b 1666 a 13.0 c Apak 486 bc 134.7 86 ab 2.91 bc 29.2 c 208.2 b 1449 bc 14.3 bc Yesilkoy-330 499 ab 133.1 91 a 3.08 ab 31.8 b 248.2 a 1597 a 17.8 a Amasya 415 d 131.8 89 ab 3.18 a 32.2 b 200.3 b 1552 ab 14.9 b Checota 452 cd 131.2 77 c 3.12 a 38.5 a 259.5 a 1584 a 17.3 a Yesilkoy-1779 432 d 134.0 90 a 2.83 c 30.9 bc 243.9 a 1396 c 17.2 a LSD 45.71 4.02 6.51 0.19 2.16 22.45 116.89 1.83 N Rates ** ** ** ** ** ** ** ** 0 393 c 129.3 b 75 c 2.48 c 31.b b 171.6 c 1283 c 15.0 b 10 486 b 133.5 a 83 b 2.96 b 32.4 ab 231.0 b 1548 b 15.4 b 20 536 a 136.1 a 99 a 3.50 a 33.6 a 280.2 a 1792 a 17.0 a LSD 32.32 2.84 4.60 0.13 1.68 15.87 82.62 1.29 Mean 471 132.9 86 2.98 32.3 227.6 1541 15.7 CV (%) 14.57 4.54 11.32 9.71 10.06 14.83 11.40 17.42 Year x Cultivar * ns ** ** ** ** ** ** Year x N rates * ns ns ** ** ** ** ns Cultivar x N Rates ns ns ** ns Ns ns ** **
Year x Cultivar x N Rates * ** ns * Ns ns ** **
** Significant at 1%, * significant at 5% and ns: not significant Panicle Number per m-2
(PN m-2
), Plant Height (PH, cm), Grain Number per Panicle (GNP), Grain Weight per Panicle (GWP, g), 1000- Grain Weight (1000-GW, g), Grain Yield (GY, kg da-1
), Biomass (BY, kg da-1
) and Harvest Index (HI, %).
Nitrogen rates (10 and 20 kg N da-1) when compared to control level (0 kg N da-1) significantly increased the all investigated traits. The lowest GY was obtained from control level as 171.6 kg da-1 and this value was increased to 231 kg da-1 at 10 kg N da-1 level. The highest GY was also obtained from 20 kg N da-1 level as 280.2 kg da-1.
Compared to control level, grain yield at the level of 10 and 20 kg N da-1 was increased at the rate of 34.6% and 63.2%, respectively. Lower precipitation caused to be lower of these increasing rates. It is possible to see this situation from regression analysis (Fig. 7). Previous works were also reported similar results indicating that increased GY values due to increased nitrogen rates (Rocquigny et al., 2004; Muurinen et al., 2007).
The mean of panicle number per m-2 (PN m-2), values
of the genotypes were found variable for years and the highest PN m-2 were obtained from Seydisehir cultivar with a number of 543 (Table 2). The lowest PN m-2 was obtained from Yesilkoy-330, Apak, Checota and Yesilkoy-1779 cultivars (499, 486, 452 and 432 respectively). The lowest PN m-2 was obtained from Amasya (415) cultivar (Table 2). Panicle number m-2 was
found different among the genotypes in Kahramanmaras conditions. Dumlupinar et al. (2011) and Browne et al. (2006) also reported significant differences among genotypes for PN m-2 which was similar with our results.
Panicle number m-2 were also increased with N fertilization, the highest value was obtained from 20 kg da-1 N rate with 536 panicle number m-2. Previous works were also reported similar results, indicating increased PN m-2 values with N fertilization (Peltonen-Sainio, 1997; Browne et al., 2006).
Oat genotypes were significantly varied for panicle number in year one, the lowest panicle number was obtained from the zero N rate except Seydisehir genotype, while gradually increased in the second year by increased N rates. The average panicle numbers per m-2 were also higher in year two when compared with year one due to higher precipitation in the second year (Table 1, Fig. 1 and 2). However, response of cultivars was different to nitrogen rates and climatically changes for PN m-2. This situation caused significant year x genotype x nitrogen rates interaction (Fig. 2).
Figure 2 Year x Genotype x N Rates interactions on panicle
number per m-2.
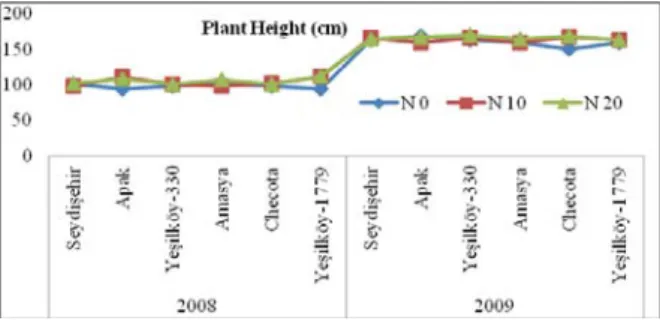
Plant height (PH) of cultivars varied between 131.2 cm and 134.7 cm (Table 2). The average plant height was 129.3 cm for the control plots. It was increased to 133.5 and 136.1 cm at 10 and 20 kg da-1 N rates, respectively (Table 2). Previous researchers were reported increasing in plant height by increased N fertilization, which supports our results (Shah et al., 2002; Rocquigny et al., 2004).
Plant heights of the oat plants were moderate in year one due to lower precipitation, while they had higher plant heights with higher precipitation in the second year (Fig. 1 and 3). Apak and Yesilkoy-1779 cultivars had the lowest plant height with 94 cm at zero N rate in year one (Fig. 3), while Checota cultivar had the lowest plant height with 150 cm at zero N fertilization in year two (Fig. 3). The significant differences on plant height in years were due to higher precipitation in year two (Fig. 1). This situation caused significant year x genotype x N rates interactions for plant height (Fig. 3).
Figure 3 Year x Genotype x N Rates interactions on plant
height.
Cultivars significantly varied (P<0.01) for grain number per panicle. Yesilkoy-330 and Yesilkoy-1779 cultivars had higher grain numbers (91 and 90 respectively) and those cultivars were placed in to the same group. The lowest GNP was obtained from Checota cultivar with a number of 77 (Table 2). In previous works similar results were reported, which is in agreement with our findings (Gecit and Sahin, 1999; Gul et al., 1999; Inan et al., 2005; Kara et al., 2007).
The effect of nitrogen doses on GNP was statistically significant (P <0.01). The average GNP was 75 in control plots, it was increased to 83 and 99 GNP at 10 kg da-1 and 20 kg da-1 N rates respectively (Table 2). N rates caused to increase GNP which was in agreement with findings of
previous works (Shah et al. 2002) and Browne et al. 2006 ).
Grain weight per panicle (GWP) varied for cultivars and N rates (P < 0.01). Among the cultivars higher GWP values were obtained from Amasya and Checota cultivars with 3.18 and 3.12 g respectively, while lower GWP values were obtained from Yesilkoy-330 and Apak cultivars with 3.08 and 2.91 g respectively. The lowest GWP was obtained from Seydisehir cultivar (Table 2). Similar results were reported from earlier studies in oat for GWP (Shah et al., 2002; Kara et al., 2007).
Average GWP of control plots was 2.48 g and it was increased to 2.96 and 3.50 g at 10 and 20 kg N da-1 rates respectively (Table 2). Increasing GWP with increased N fertilization was also reported by previous workers (Browne et al., 2006; Rocquigny et al., 2004).
The higher precipitation affected grain weight positively, in year one, the mean grain weight was 2.06 g while 3.91 g in year two (Fig. 1 and 4). The highest grain weight was obtained from Amasya cultivar with 2.59 g at 20 kg da-1 N rate. In the second experiment year, Yesilkoy-330 cultivar had the highest grain weight with 4.75 g at 20 kg da-1 N rate (Fig. 4). This different responses of cultivars to N rates and years caused significant year x genotype x N rate interactions for grain weight per panicle (Fig. 4).
Figure 4 Year x Genotype x N Rates interactions on grain
weight per panicle.
1000-grain weight (1000-GW) of cultivars varied between 29.2 and 38.5 g Checota, Amasya, Yesilkoy-330 and Seydisehir cultivars had 38.5, 32.2, 31.8 and 31.6 g 1000-GW respectively. Apak cultivar had the lowest 1000-GW with 29.2 g (Table 2). Previous oat researchers reported significant differences for 1000-GW among cultivars which supports our results (Shah et al, 2002; Gul et al., 1999; Inan et al., 2005). Nitrogen rates caused to increase 1000-GW. It was determined as 31.0 g for control plots. It was increased to 32.4 g and 33.6 g for 10 and 20 kg da -1 nitrogen rates.
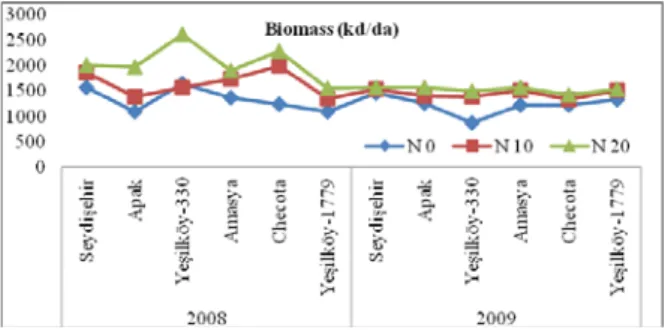
The highest biomass (1666 kg da-1) was obtained from Seydisehir cultivar. Yesilkoy-330, Checota and Amasya cultivars also had higher biomass values and were placed in the same group with Seydisehir cultivar. The lowest biomass was obtained from Yesilkoy-1779 cultivar with 1396 kg da-1 (Table 2). Different biomass values in oat
cultivars were indicated by earlier studies, which are supporting our work (Shah et al., 2002; Inan et al., 2005).
The average biomass yield in year one was lower than year two, however Yesilkoy-330 genotype had higher biomass yield in the first year than second year, despite lower precipitation in year one (Fig.1 and 5). Interestingly, Yesilkoy-330 had the highest harvest index at zero N rate in year two (Fig 6), while having the highest plant height with 170 cm at 20 kg da-1 N rate in year two (Fig. 3). The only explanation of this situation should be the lodging fact of the Yesilkoy-330 genotype.
Figure 5 Year x Genotype x N Rates interactions on biomass. Average biomass yield of the control plots was 1283 kg da-1 biomass yield. It was increased to 1548 and 1792 kg da-1 with 10 and 20 kg da-1 N fertilization, respectively (Table 2). Dawson et al. (2008) indicated that increasing of BY with increased N rates which is similar with our results.
Figure 6 Year x Genotype x N Rates interactions on harvest
index.
Figure 7 Regression analysis of GY by N doses Harvest index significantly varied for years, cultivars and N rates (P < 0.01). The highest harvest index was obtained from Yesilkoy-330 cultivar with 17.8%, however, harvest indexes of Checota, Yesilkoy-1779, Amasya and Apak cultivars were 17.3%, 17.2%, 14.9%, and 14.3%, respectively. Seydisehir had the lowest HI with13.0% (Table 2). Our results were in agreement with
Shah et al., (2002) and Inan et al., (2005) whom reported variations in cultivars for harvest index. The highest HI (17%) was obtained from 20 kg da-1 N rate. This followed by control and 10 kg da-1 N rates with similar HI values (15.4 and 15.0%, respectively, Table 2).
Harvest indexes of oat genotypes in year one were extremely low when compared to the year two (Fig. 6). The harvest index values in year one were ranked in 5 to 17%, while 14 to 29.95% in year two. Yesilkoy-330 genotype had the highest harvest index (29.95%) at zero N fertilization in year two. However, it had the highest plant height in year two (170 cm) at 20 kg da-1 N rate, but it could not have the highest biomass, which makes sense when related with the lodging fact of Yesilkoy-330 cultivar with higher precipitation and higher N rate.
CONCLUSION
Based on two years data, in the research, the highest grain yield was obtained from Checota. Yesilkoy-330 and Yesilkoy-1779 cultivars followed Checota cultivar. These cultivars may be preferred for oat production in the region. Compared to control plots, nitrogen rates increased oat grain yield at the rate of 34.6% and 63.2% at 10 and 20 kg da-1 N rates, respectively. Low average rainfall and sowing rate (350 seed m-2) caused to be limited of nitrogen effects for GY in this research. However, the relation among sowing rates, nitrogen rates and lodging should be taken attention to oat production fields.
ACKNOWLEDGEMENTS
This project was kindly supported by Scientific Research Council of Kahramanmaras Sutcu Imam University (Project code: 2007/4-6).
LITERATURE CITED
Aman, P. and H. Graham. 1987. Analysis of total and insoluble mixed-linked (1«3), (1«4)-ȕ-D-glucans in barley and oats. J. Agric. Fd. Chem. 35: 704-709.
Anttila, H., T. Sontag-Strohm, H. Salovaara. 2004. Viscosity of beta-glucan in oat products. Agric Food Sci. 13:80-87. Barut, A.A. 2003. The effect of sowing time and seed size on
yield and yield components in some oat types (Avena sativa L.): PhD thesis // Ankara University, Institute of Natural and Applied Science. – Turkey, pp. 114
Browne, R.A., E.M. White and J.I. Burke. 2006. Responses of developmental yield formation processes in oats variety, nitrogen, seed rate and plant growth regulator, and their relationship to quality. J. of Agron. Sci. 144 (6): 533-545. Buerstmayr, H., N. Krenn, U. Stephan, H. Grausgruber and E.
Zechner. 2007. Agronomic performance and quality of oat (Avena sativa L.) genotypes of worldwide origin produced under central European growing conditions. Field Crops Res. 101: 343-351.
Dawson, J.C., D.R. Huggins and S.S. Jones. 2008. Characterizing nitrogen use efficiency in natural and agricultural ecosystems to improve the performance of cereal crops in low-input and organic agricultural systems. Field Crops Res. 107: 89-101.
Dokuyucu, T., A. Akkaya, A. Nacar and B. Ispir. 1997. Investigation of some bread wheat cultivars for yield and phenological traits under Kahramanmaras conditions. Turkey II. Field Crops Congress. pp. 16-20 (in Turkish).
Dokuyucu, T., D. M. Peterson and A. Akkaya. 2003. Contents of antioxidant compounds in Turkish oats: simple phenolics and avenanthramide concentrations. Cereal Chemistry. 80 (5): 542-543.
Dumlupinar, Z., H. Maral, R. Kara, T. Dokuyucu and A. Akkaya. 2011. Evaluation of Turkish Oat Landraces Based on Grain Yield, Yield Components and Some Quality Traits. Turkish Journal of Field Crops Res. 16(2): 190-196. Gebeyehou, G., D.R. Knott and R.J. Baker. 1982. Relationships
among durations of vegetative and grain filling phases, yield components and grain yield in durum wheat cultivars. Crop Sci., 22(2): 287-290.
Gecit, H.H., and N. Sahin. 1999. Variation in some yield components at main stem and tillers of oat at various stages according to sowing density. Turkey III. Field Crops Congress. pp. 192-197 (in Turkish).
Gul, I., C. Akinci and M. Colkesen. 1999. Determination of
suitable oat cultivars for grain and herbage to be grown under Diyarbakir conditions. Symposium on problems and the solutions of cereal farming in Middle Anatolia. pp. 117-125(in Turkish).
Guler, M. 2011. Nitrogen and irrigation effect on grain ȕ-glucan content of oats (Avena sativa L.). AJCS 5(3):242-247. Inan, A.S., M.O. Ozbas and M.I. Cagirgan. 2005. Evaluation for
agronomic and quality traits of oat lines developed for food. Turkey VI. Field Crops Congress. pp. 1153-1155 (in Turkish).
Kara, R., Z. Dumlupinar, Y. Hisir, T. Dokuyucu, and A. Akkaya. 2007. Evaluation of the oat varieties for the yield components and grain yield under the Kahramanmaras conditions. Turkey VII. Field Crops Congress. pp. 121-125 (in Turkish).
Mahler, R.L., F.E. Koehler and L.K. Lutcher. 1994. Nitrogen source, timing of application and placement: effects on winter wheat production. Agron. J. 86: 637-642.
Maier, S.M., N.D. Turner and J.R. Lupton. 2000. Serum lipids in hypercholesterolemic men and women consuming oat bran and amaranth product. Cereal Chem. 77: 297-302.
Maral H. Z. DumlupÕnar, T. Dokuyucu and A.Akkaya, 2012. Impact of Genotype and Nitrogen Fertilizer Rate on Yield and Nitrogen Use by Oat (Avena sativa L.) in Turkey. Turkish Journal of Field Crops, 2012, 17(2):177-184. Mohr, R.M., C.A. Grant and W.E. May. 2005. N, P and K:
Fertilizer management for oats. Top Crop Manager. 5: 30. Muurinen, S., J. Kleemola and P. Peltonen-Sainio. 2007.
Accumulation and Translocation of nitrogen in spring cereal cultivars differing in nitrogen use efficiency. Agron. J. 99(2): 441-449.
Peltonen-Sainio, P. 1997. Great Yield and Plant Stand Structure of naked and hulled oat under different nitrogen fertilizer and seeding rates. Agron. J. 89(1): 140-147.
Peterson, D.M., D.M. Wesenberg, D.E. Burrup and C.A. Erickson. 2005. Relationships among agronomic traits and grain composition in oat genotypes grown in different environments. Crop Sci. 45: 1249-1255.
Raun, W.R. and G.V. Johnson. 1999. Improving nitrogen use efficiency for cereal production. Agron. J. 91 (3):357-363. Rocquigny, PJ., M.H. Entz, R.M. Gentile and S.C. Duguid.
2004. Yield physiology of a semi dwarf and tall oat cultivar. Crop Sci. 44: 2116-2122.
SAS, 1999. SAS Institute Inc., SAS/STAT® User's Guide, Version 8, SAS Institute Inc., Cary, NC. (1999).
Shah, W.A., J. Bakht, M. Shafi and M.A. Khan. 2002. Yield and yield components of different cultivars of wheat barley and oat under rainfed conditions. Asian J. of Plant Sci. 1(2): 148-150.
Unver, S., M. Atak and M. Kaya, 1999. The situation of cool
season cereals at the 75th anniversary of our republic.
Journal of Turkish Koop. Ekin. 3(8): 44-48 (in Turkish). Yilmaz, H.A. and T. Dokuyucu, 1994. Determination of high
yielding and suitable bread wheat genotypes for Kahramanmaras conditions. Turkey I. Field Crops Congress, pp. 303-306.