CONCENTRATION IN BANKING AND LENDING
CHANNEL OF MONETARY POLICY:
EVIDENCE FROM TURKEY
FADİME KARAKUŞ
112622003
ISTANBUL BILGI UNIVERSITY
GRADUATE SCHOOL OF SOCIAL SCIENCES
DEPARTMENT OF ECONOMICS
ASSOC. PROF. FATİH MACİT
i
ABSTRACT
Concentration in Banking and Lending Channel of Monetary Policy: Evidence from Turkey
The purpose of this research is to investigate the relationship between the concentration and the lending channel of monetary policy by looking at the Turkish banking sector for the period between 2006 and 2012. We use bank-level data for fourteen largest commercial banks which have share of more than 90% of total loans in Turkish banking sector. We analyze the concentration measurements for different balance sheet items including total assets and loans. We find that the level of concentration have not shown an important change for this relevant period. Our results provide consistent evidence that a rise in concentration in the banking sector weakens the bank lending channel, in turn, resulting in monetary policy to be less efficient and this works through the impacts on smaller and less capitalized banks.
ii
ÖZET
Bankacılıkta Yoğunlaşma ve Para Politikasının Kredi Kanalı: Türkiye Örneği
Bu çalışmanın amacı 2006-2012 yılları arasında Türkiye bankacılık sektöründeki yoğunlaşma ve kredi kanalı arasındaki ilişkiyi incelemektir. Türk bankacılık sektörünün kredi hacminin yüzde doksanından fazlasını oluşturan on dört büyük ticari bankanın verilerini kullandık. Aktif büyüklükleri ve kredileri içeren farklı bilanço tabloların kullanarak yoğunlaşma büyüklüklerini inceledik. Bu dönemde yoğunlaşmada önemli ölçüde değişiklik gözlemlenmemiştir. Bankacılıktaki yoğunlaşmanın artması kredi kanalının zayıflamasına ve sonuç olarak da para politikasının etkisinin azalmasına sebep olmaktadır, ayrıca küçük ve aktif kapasitesi az olan bankalar aracılığıyla bu kanalın çalışmakta olduğunu gözlemledik.
iii
ACKNOWLEDGEMENTS
I would first like to express my appreciation and gratitude to my thesis advisor Assoc. Prof. Fatih Macit for his help, motivation, knowledge and suggestions. This dissertation would not have been accomplished without the support of Fatih Macit.
I would also like to thank the jury members Asst. Prof. Serda Selin Öztürk and Assoc. Prof. İlyas Sözen.
I would also like to thank my friends, especially Esra Şimşek for her continued help and support.
Last but certainly not least, I would like to thank every member of my family and especially my father Veli Karakuş and my mother Sakine Karakuş for their support during my education life.
iv TABLE OF CONTENTS Title Page Approval page Abstract i Özet ii Acknowledgements iii Table of Contents iv List of Tables vi
List of Figures vii
Abbreviations viii
1 INTRODUCTION ... viii1
2 BANKING SECTOR and MONETARY POLICY IN TURKEY ... 2
2.1 Banking Sector ... Error! Bookmark not defined.2 2.2 Monetary Policy ... 9
3 LITERATURE REVIEW ... ..13
4 THE DATA and EMPIRICAL METHODOLOGY ... 18
v
4.1.1 Measures of Concentration ... 22
4.2 Methodology ... 24
5 ESTIMATION RESULTS and DISCUSSION ... 26
5.1 Estimation Results ... 26
7 CONCLUSION ... 31
vi LIST OF TABLES Table 2.1: ... 5 Table 4.1: ... 19 Table 4.2: ... 21 Table 5.1: ... 27 Table 5.2: ... 29 Table 5.3: ... 30
vii LIST OF FIGURES Figure 2.1: ... 3 Figure 2.2: ... 6 Figure 2.3: ... 7 Figure 2.4: ... 7 Figure 2.5: ... 8 Figure 2.6: ... 8 Figure 2.7: ... 9 Figure 2.8: ... 9 Figure 2.9: ... 11 Figure 2.10: ... 12 Figure 4.1: ... 22 Figure 4.2: ... 23
viii
ABBREVIATIONS
BRSA Banking Regulatory and Supervisory Program Agency CBRT Central Bank of the Republic of Turkey
GDP Gross Domestic Product IMF International Monetary Fund MPC Monetary Policy Committee
PSBR Public Sector Borrowing Requirement ROA Return on Assets
ROE Return on Equity
1
1 INTRODUCTION
A remarkable rise in concentration in the banking sector has been recently one of the significant characteristics of financial development in emerging economies.
An interesting topic for both bankers and policy makers has been whether the concentration in financial sector can affect the monetary policy decisions, and how its effects are related to the rest of the economy. However, there exists little research on the relationship between concentration in banking and the sensitivity of bank lending channel to monetary policy, with the exception of Adams and Amel (2005), and Abbasoğlu et. al (2007).
This work has attempted to fill this gap by studying the concentration in banking sector on the effectiveness of monetary policy, focusing our analysis on the transmission of monetary policy through bank lending channel. Our aim is to investigate whether concentration in the banking sector decreases or amplifies the effect of any changes in monetary policy on bank lending channel.
Banks play a substantial role in transmitting the impact of monetary policy transmission through the bank lending channel. If after a contractionary monetary policy, banks are not able to costlessly resort to non-deposit funding to balance the decline in reserves and access to loanable funds, so they are obliged to cut back their loan supply. As a consequence of this reduced loan supply, the cost of credit for bank-dependent firms increases
2
and the real economic activity is negatively affected. If borrowers lack the ability to resort to capital markets as an alternative source; this negatively affects employment, investment and output. The transmission of monetary policy through the bank lending channel works on the supply side of the loan markets, and amplifies the standard demand-based interest rate channel.
The main objective of this research is to investigate how the concentration in the banking sector affects the transmission of monetary policy through the bank lending channel. The paper is organized as follows. Section 2 presents general information on banking sector and monetary policy in Turkey. Section 3 reviews the literature on the lending channel of monetary policy and Turkish banking sector. Section 4 describes the data used and discusses the methodology. Section 5 presents the results together with the underlying reasons and the last section concludes the thesis.
2
BANKING SECTOR AND MONETARY POLICY IN
TURKEY
2.1 Banking Sector
Historically, the banking sector is the most dominant sector in the Turkish financial sector. The Turkish banking sector constitutes the majority of the sector with more than 85% of the total assets in the Turkish financial system. Other financial sector elements such as factoring, leasing sectors, insurance only constitute a very small proportion in the financial system.
3
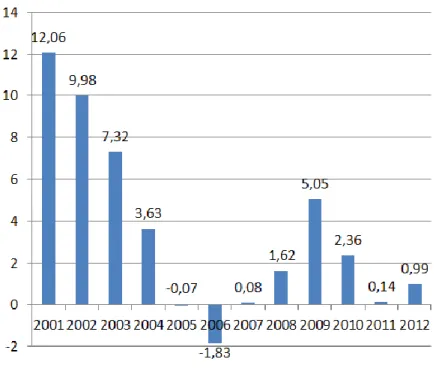
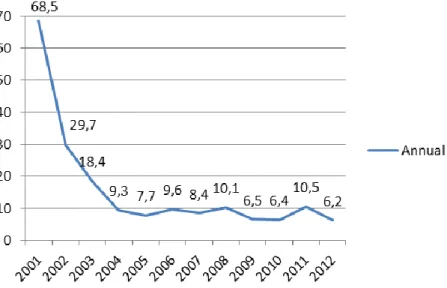
The 2001 financial crisis was a milestone for both Turkish economy and the Turkish banking sector. Prior to 2001, the Turkish economy was surrounded by an unstable macroeconomic environment characterized by high inflation and large budget deficits. The informal economy was quite large and income equality was unfair. As can be seen in Figure 2.1, in such an environment, the main duty of the banking sector was to finance these high budget deficits, because of high interest rates and the high level of public sector borrowing requirements. The legislation was weak, the regulatory system was under the influence of political powers, and many banks could not have enough capital to deal with financial crises. Banks were founded in order to make profits without concerning about the qualification of the bank management.
Figure 2.1: The ratio of public sector borrowing requirement (PSBR) to GDP, Association of Treasury Controllers
4
Banks with insufficient capital started to declare bankruptcy as a consequence of these weaknesses. Therefore, the banking sector needed to be restructured and the capital base of the banks needed to be strengthened. The trend in the banking sector changed from “opening more and more banks” to “good management” in order to obtain profits.
The Turkish Banking Regulation and Supervisory established in 2000 switched its fundamental objective from supervision to rehabilitation and restructuring. The main goals of the program executed by the BRSA were to reinforce the regulation and auditing of private banks, restructuring the public banks which have a large market share in the Turkish banking sector, resolving the banks transferred to the Saving and Deposit Insurance Fund (SDIF), and improving the quality of banking auditing. Public banks were no more an important cause to liquidity risk for the sector thanks to this program. The liquidation and restructuring of the banking sector reduced the expenses of the banking system because of alternative banking delivery channel strategies, i.e. telephone and internet banking. Furthermore, the mergers and acquisitions following the crises led to a decline in the number of banks, branches and employees (Table 2.1). The number of branches decreased from 6351 in 2002 to 6072 in 2003 and the number of employees decreased from 126.539 in 2002 to 124.030 in 2003. The number of banks dropped from 59 banks in 2002 to 49 by the end of 2007.
5 2002 2003 2004 2005 2006 2007 2008 Number of Banks 59 55 53 51 50 50 49 Number of Branches 6.351 6.078 6.219 6.537 7.296 8.117 8.722 Deposit Banks 6.169 6.046 6.186 6.220 6.898 7.653 8.203 Development and Investment Banks 34 32 33 25 42 42 48 Participation Banks 148 292 356 422 471 Number of Employees 126.539 124.030 127.944 138.724 150.793 167.760 177.175 Deposit Banks 118.321 118.603 122.592 127.851 138.426 153.212 161.483 Development and Investment Banks 5.688 5.427 5.352 5.126 5.255 5.361 5.378 Participation Banks 2.530 5.747 7.112 9.187 10.314 Table 2.1: Structural Indicators of the Banking Sector, 2008, BRSA Financial Markets Report
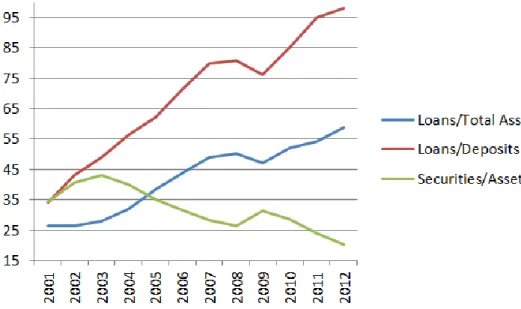
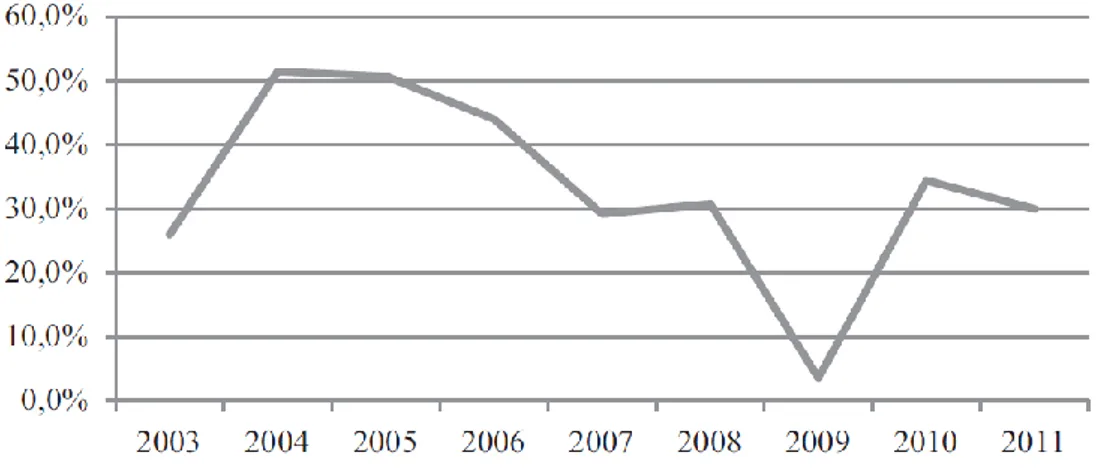
After the 2001 economic crisis, there was a substantial change in the macroeconomic environment and this resulted in important changes in the banking sector. The increased fiscal discipline of the government led to large reductions in budget deficits and, in turn, public sector borrowing requirement was substantially decreased. Therefore, the banking sector started to do its fundamental duty which is extending credit to the economy. Figure 2.2 shows that the ratio of loans to total assets was as low as 27% in 2001 and by the end of 2012 the ratio of loans to total assets has reached more than 50%. The loans were only 34% of total deposits in 2001 while the ratio of loans to total deposits has peaked to 98% by the end of 2012. Securities to total assets ratio decreased from 34.3% in 2001 to 20.8 in 2012.
6
Figure 2.2: Composition of balance sheet of the banking sector, Central Bank of the Republic of Turkey
The 2001 crisis also caught attention of foreign banks to take over the Turkish banks cheaply and obtain profits. After the crisis, there was a huge amount of foreign bank entry (Figure 2.3). The increasing per capita income and population, rapidly growing mortgage sector, the supervisory and regulatory reforms, and improving macroeconomic environment of Turkish economy were some of the reasons of foreign bank entry. Among these, the high growth potential of the Turkish banking sector was the most substantial reason of the attention of foreign banks. Foreign banks in the Turkish banking sector has a market share of about 45 in the total assets in 2012 when the stock market shares of foreign participation is included. Out of 48 banks, foreign banks have shares of thirty Turkish banks and they have a controlling stake in twenty four banks.
7
Figure 2.3: Foreign Capital in the Banking Sector (Billion TL), BRSA-CBRT
The Turkish banking sector underwent a new term which can be called as the growth period in 2004. The growth rate of Turkish economy was 9.3% while the world economy had a 5.1% growth rate in this year. The total assets of the Turkish banking sector have increased from 300 billion TL in 2004 to nearly 1,400 billion TL in 2012. The ratio of the assets reached to 97% in 2012 from 55% in 2004.
8
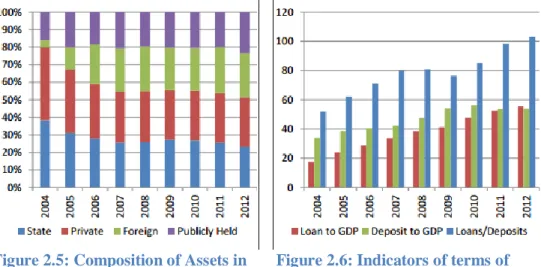
As can be seen in Figure 2.5, the assets share of public banks decreased from 38% to 23 in this relevant period. Only in three years, the share of foreigners in the asset size rose from 4% to 255. The deposits to GDP ratio reached to 54% by the end of 2012, although it was only 35% in 2004. The ratio of loans to GDP became 57%, whereas this ratio was just 20% in 2004. The loans to GDP ratio increased from 56% in 2004 to 104% in 2012 (Figure 2.6).
Figure 2.5: Composition of Assets in Figure 2.6: Indicators of terms of
Bank Ownership (%), BRSA-CBRT Intermediation Level of Banks and Financial Deepening (%),
BRSA-CBRT
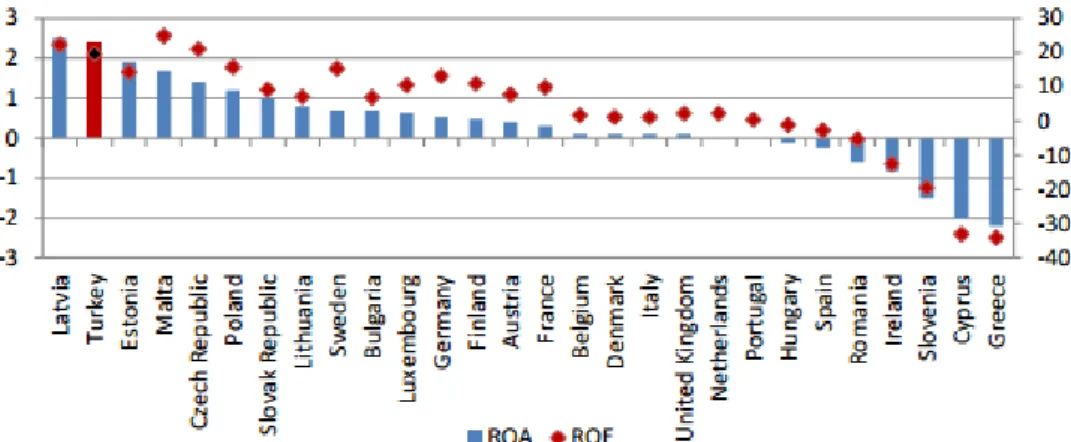
Turkish banks make more profits than the banks in many European countries. Figure 2.7 shows that only Malta, Latvia and Czech Republic banks recorded higher returns on equity (ROE) than Turkish banks. However, only Latvia banks have higher ratios than Turkish banks in terms of reurn on assets (ROA). It can be stated that Turkish banks became profitable in the growth period even during the global financial crisis.
9
Figure 2.7: Profitability Measures, 2012, IMF, Financial Soundnes Indicators
Turkish banks do not only make profits, but they are also sound and strong. Among other countries, Turkey is one of the very few countries which have high ratios with respect to the capital adequacy ratio (Figure 2.8). Along with being well-capitalized, Turkish banks have maintained their quality of assets during the global crisis period.
Figure 2.8: Capital Adequacy Ratios, 2012, IMF, Financial Soundnes Indicators
2.2 Monetary Policy
The large budget deficit in Turkish economy led to an economic turbulence during the 1990s. During the same period, public sector borrowing requirements were very high, reaching 6.8% of GDP on average. The
10
Central Bank of the Republic of Turkey mainly financed these enormous budget deficits by printing money. Therefore, the average inflation rate was 77.2% during this period.
The economic crisis in 2001 was a turning point for monetary policy in Turkey. After the 2001 crisis, Turkey started a new arrangement supported by IMF. Two major changes, with respect to the monetary policy approach, were implemented:
The fixed and heavily managed exchange rates regimes of the past were replaced by a flexible exchange rate regime in order to float exchange rates.
The CBRT implemented an explicit targeting regime.
The monetary policy of the CBRT has become more transparent since 2001 with many substantial reforms. Inflation targeting regime and free float exchange rate policy were adopted in February 2001. The new Central Bank Law was enacted in 2001. The main goal of the CBRT became achieving and maintaining price stability along with the legislation of the new law. The bank was able to determine on its own to choose the monetary policy that it would implement and whatever instrument that would use to ensure price stability. The short term interest rates became the main instrument of the monetary policy. The other change was that the bank could not extend credit to the treasury in order to finance budget deficits. The bank was no more allowed to purchase government securities in the primary market. Therefore the bank was substantially prevented from printing money in
11
order to finance budget deficit. These reforms led to a significant decline in the inflation rate in just a few years, and inflation rate was reduced to single digits by the end of 2004, as can be seen in Figure 2.9.
Figure 2.9: Annual Inflation Rates, TUIK
A new decision making board, the Monetary Policy Committee was also established with this law. The main task of the MPC is to formulate a strategy for monetary policy including setting policy rates and communicating the future monetary policy.
At the beginning of 2006, a full-fledged inflation targeting regime was adopted by the CBRT. The main policy instrument was the short term interest rates in order to keep the targeting inflation rate. When the global financial crisis of world economy hit the Turkish economy, the credit growth dropped substantially in 2009. The bank substantially decreased interest rates, and credit demand was boosted and a quick economic recovery from the global financial crisis was sustained because of this
12
expansionary policy. When an expansionary monetary policy was adopted by the CBRT, the lending channel of monetary policy became very active in the Turkish economy.
Figure 2.10: Annual Loan Growth of Commercial Banks, CBRT
The CBRT launched a new policy strategy which takes into account macrofinancial risks in the domestic economy posed by the global imbalances by the end of 2010. The new framework preserves the main goal of achieving and maintaining price stability while supporting financial stability as a complementary objective. Additional policy tools such as the interest rate corridor and reserve requirement ratios are also developed to deal with financial imbalances. These policies aimed at a sound economic growth. The measurements are taken in collaboration with other regulatory boards to avoid excessive credit growth, whereas policies are pursued to prevent excessive deviation of the exchange rate from economic fundamentals.
13
3 LITERATURE REVIEW
The literature on the bank lending channel starts with the seminal study of Bernanke and Blinder (1988). By using IS-LM theoretical model of the bank lending channel, they analytically show that monetary policy can affect directly the lending channel of monetary policy transmission. Apart from the money channel, where central banks have an impact on market rates through policy rate changes, the bank lending channel of monetary policy is directly related to monetary policy and loan supply. Especially, when the central bank raises the policy rate it mops up the bank reserves, where lower reserves leads to a decline in the deposit volume urging banks to reducing their loan portfolio, unless banks can offset the reduction in loanable funds. If bank loans cannot be replaced with other forms of finance, such as private bonds, monetary policy has an impact on the economy not only by the money channel but also by the lending channel.
Romer and Romer (1990) argue that banks‟ access to alternative sources of funds leads to monetary policy to have little effect on bank lending. However, Stein (1998) demonstrates that when banks have different sources of funding, the bank lending channel can still work.
Bernanke and Blinder (1992) demonstrate a relationship between the federal funds rate and the bank lending channel. They conclude that the effect of monetary policy on the investment of firms is not totally demand driven, it can be also explained by the supply side or the bank lending channel. Kashyap, Stein and Wilcox (1993) show that any change in monetary policy
14
leads to a shift in firms‟ external financing. They find that a monetary policy tightening causes a rise in commercial paper issuance and decrease in bank lending.
Kashyap and Stein (1995) investigated the existence of the bank lending channel using U.S. bank level data. They demonstrate that the banks size involves the positive and close interaction of banks‟ ability to increase nonreservable funds. Their estimations show that small banks reduce their loan portfolio more compared to large banks in response to a contractionary monetary policy.
Kashyap and Stein (1997) use concentration ratios in their analysis of the effectiveness of monetary policy in Europe. Three-firm and five-firm concentration ratios are used in both studies. Banks with higher concentration measures are less sensitive to reserve contractions, as they have access to alternative sources of financing.
Kashyap and Stein (2000) investigate the bank lending channel of monetary transmission for the U.S. commercial banks. Call Report data on a very large panel data set of American banks between the years 1976 and 1993 is used in order to investigate whether there are cross sectional differences in the ways in which banks react to monetary policy shocks. They conduct a two-step regression approach to estimate the impact of liquidity on loan growth and the effect of monetary policy on the liquidity of a bank. They show that bank lending channel exists and works primarily through smaller bank which do not have access to alternative forms of funding in the money
15
markets. Commercial and industrial loans are more affected by the monetary policy than other types of bank lending. Peek and Rosengren (1995) demonstrate that the reaction of banks to the monetary policy is affected by its capital to asset ratio. Kishan and Opiela (2000) find that small and undercapitalized banks show the largest reaction to changes in monetary policy and well-capitalized banks can easily substitute the contraction in deposits as they are perceived as less risky.
Adams and Amel (2005) study the relationship between competition in banking sector and the transmission mechanism of monetary policy through the bank lending channel using aggregate data for the U.S. from 1996 to 2002. They find that the impact of monetary policy on the bank lending channel is weaker in more concentrated rural markets than in less concentrated urban markets.
Olivero, Li and Jeon (2011) investigate the relationship between the competition and the lending channel of monetary policy using the data for commercial banks in 10 Asian and 10 Latin American countries in the years from 1996 to 2006. They demonstrate that an increase in competition in the banking sector weakens the lending channel of monetary policy. They also investigate how this relationship between consolidation and the lending channel of monetary policy is related to bank characteristics. Their results provide that the lending channel of monetary policy transmission is weakened as the degree of consolidation in the banking sector increases.
16
There are also numerous research papers on the Turkish banking sector. Şengönül and Willem (2005) use the methodology introduced by Kashyap and Stein (2000) for Turkish banking sector. They find that the transmission mechanism of the lending channel of monetary policy exists in Turkey and a tightening monetary policy decreases funding sources for loans, and, thus, bank lending to the private sector.
Brooks (2007) investigates the transmission mechanism of monetary policy during the May-June 2006 financial turbulence in Turkey and argues that in response to contractionary monetary policy, liquidity is an important variable for banks to determine their lending behavior. She considers bank lending under an inflation targeting framework and analyzes whether bank characteristics result in differential responses to monetary tightening. Her results show that banks responses significantly differ and liquidity is the most substantial variable to have an impact on banks‟ responses in Turkey for the relevant period.
Başçı , Özel and Sarıkaya (2007) analyze the monetary policy transmission by accounting for the change in the monetary policy regime in the aftermath of the February 2001 financial crisis. They find that low and stable inflationary environment resulting from the implementation of structural reforms after the 2001 have raised the significance of interest rate and credit channels in Turkey compared to pre-crisis period.
Abbasoğlu, Aysan, and Güneş (2007) analyze the concentration and competition in the post-crises Turkish banking sector in the years from 2001
17
to 2005. They show that for this relevant period the degree of concentration has increased and the level of competition has decreased in Turkish banking sector.
Aydın and Igan (2010) analyze the effect of monetary and fiscal policies on credit growth for the period between 2002 and 2008. They show that in response to tightening monetary policy, banks which are constrained according to liquidity show a larger reduction in their credit growth.
Catik and Karacuka (2011) investigate transmission mechanism of monetary policy through the credit channel under several inflationary environments in Turkish economy during the period from January 1986 to October 2009. They demonstrate that the lending channel of monetary policy transmission works only in the post-inflation targeting period and is especially weak in the low inflation regime.
Alper, Hulagu, and Keleş (2012) investigate whether monetary policy transmission can have an impact on the bank lending by changing banks‟ liquidity positions. The empirical results show that if monetary policy can affect the liquidity position of the banking sector, such a policy may be effective on changing on credit supply.
Macit (2012) studies the lending channel of monetary policy transmission for the Turkish banking sector in the period between 2006 and 2010 and examines whether banks‟ reactions to monetary policy change according to their ownership type. He finds that public banks show the smallest reaction to changes in monetary policy whereas foreign banks show the largest
18
reaction. In an another research paper, he also investigates whether there is a difference between in the reaction of commercial and participation banks to changes in monetary policy. His empirical results show that participation banks show larger responses to monetary policy.
Macit (2012) investigates the concentration and competition by looking at the Turkish banking sector from the period 2005 to 2010. He finds that the level of concentration has not shown a remarkable change during this time period whereas the degree of competition in the Turkish banking sector has decreased. Therefore, the reduction in competition can be explained as a negative effect of the entry restrictions.
4 THE DATA and EMPIRICAL METHODOLOGY
4.1 Data Description
The data uses quarterly data from the unconsolidated balance sheets of commercial banks that operated in the years between 2006 and 2012 in Turkey. The financial statements of commercial banks were obtained from the Bank Association of Turkey database. As used as a standard procedure in the literature, we proxy the financial strength using two capitalization measures (real assets and the equity capital to total assets) and a measurement of liquidity (the net loans to total assets ratio). The data also includes the growth rate of different types of loans for commercial banks. The level of liquidity for each bank is calculated as the ratio of net loans to total assets. The ratio of equity to total assets is a general measure used to analyze capital adequacy ratio of a bank. This ratio and real assets are
19
computed as the degree of capitalization of a bank. The assumption is that banks with well capitalized and more liquid assets are well prepared to prevent their loans from unexpected monetary shocks to deposits.
The number of banks in Turkey has been decreasing during this period as a consequence of the merger and acquisition activities and liquidation of some insolvent banks. The Turkish banking sector has three different types of banks according to ownership type: public banks, private banks, and foreign banks. Table 4.1 shows the numbers of banks in terms of their types of each year. There are totally six state-owned banks in each year, three of which are commercial and the others are non-depository. Since the number of state-owned banks remained same during this period, the decrease in the number of banks is attributed to the decrease in the number of privately-owned banks, especially the commercial banks. The number of foreign banks, however, only increased from 18 to 19.
2001 2002 2003 2004 2005 2006 2007 2008 2009 2010 2011 2012 Commercial 46 40 36 35 34 33 33 32 32 32 31 31 State-owned 3 3 3 3 3 3 3 3 3 3 3 3 Privately-owned 22 20 18 18 17 14 11 11 11 11 11 11 Foreign 15 15 13 13 13 15 18 17 17 17 16 16 Under SDIF 6 2 2 1 1 1 1 1 1 1 1 1 Non-depository 15 14 14 13 13 13 13 13 13 13 13 13 State-owned 3 3 3 3 3 3 3 3 3 3 3 3 Privately-owned 9 8 8 8 9 8 8 8 8 7 7 7 Foreign 3 3 3 3 1 2 2 2 2 3 3 3 Participation 6 5 5 5 4 4 4 4 4 4 4 4 Sector Total 67 59 55 53 51 50 50 49 49 49 48 48
Table 4.1: Number of Banks between 2001 and 2012, BRSA
Our data includes fourteen largest commercial banks according to their share in total loans; these banks have a share of more than 90% of total
20
loans. Of these banks, three are public, four are foreign and seven are private banks. Descriptive statistics for bank-specific control variables are shown in Table 4.2. The numbers reveal that for this time period, public banks attained the highest quarterly loan growth but with the smallest standard error. In terms of auto loan growth, foreign banks attained the largest growth rate. In terms of the equity to total assets ratio, it is clear that foreign banks are well capitalized, although public banks have less than average equity to total assets ratio. When one looks at the ratio of net loans to total assets, it is evident that public banks seem on average to be the most liquid and private banks are the least liquid.
22
4.1.1 Measures of Concentration
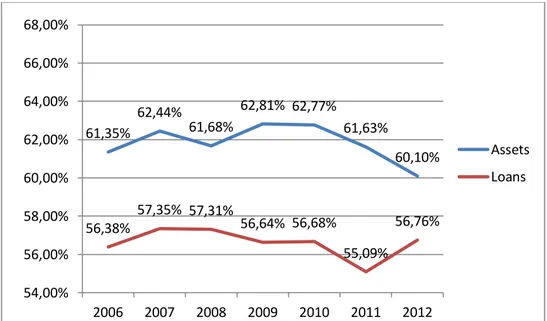
There are different ways of measuring banking concentration in the economic literature. The k-bank Concentration Ratio and the Herfindahl-Hirschman Index (HHI), the most commonly used measures, are used to measure the banking concentration in Turkey between the years 2006 and 2012. For this purpose we calculate CR5 ratios which measure the concentration ratios of the biggest 5 banks respectively according to the share of their assets in the total assets and loans of the banking sector. Figure 4.1 shows the results for CR5 ratios. It can be seen that the higher concentration ratio seems to be in assets. For total assets, the market share of the largest five banks has slightly decreased in the particular time period whereas the market share of the largest five banks has slightly increased for loans.
Figure 4.1: Market share of the largest five banks in terms of assets and loans, BRSA 61,35% 62,44% 61,68% 62,81% 62,77% 61,63% 60,10% 56,38% 57,35% 57,31% 56,64% 56,68% 55,09% 56,76% 54,00% 56,00% 58,00% 60,00% 62,00% 64,00% 66,00% 68,00% 2006 2007 2008 2009 2010 2011 2012 Assets Loans
23
The k-bank concentration ratio gives equal emphasis to the k leading banks, but ignoring many small banks in the market. Therefore we also calculate the HHI which is calculated as the sum of the squares of the market shares of banking institutions. Figure 4.2 shows the results for HHI values for assets and loans. For the interpretation of HHI, we apply the general rule that the HHI index less than 0.1 is characteristic of lowly concentrated markets; the HHI value between 0.1 and 0.18 means moderate level of concentration; the HHI index more than 0.18 indicates high market concentration. The higher value of HHI appears to be in assets like in concentration ratios. Both for total assets and total loans the HHI index takes a value less than 0.10 for all years between 2006 and 2012, indicating a non-concentrated market. There is no substantial change in HHI values for all years between 2006 and 2012.
24 Figure 4.2: HHI values for assets and loans
4.2 Methodology
The bank lending channel model that we estimate is given as follows:
(
)
(1)
where refers to the percentage change of the total loans for bank i at time t. The reason for using the growth rate of loans as the dependent variable instead of the loan volume was to avoid a change in monetary policy rate having a greater effect on loan volumes in greater markets. represents the change in the monetary policy instrument, since any change in monetary policy is supposed to have an influence on the loan supply of banks only in the next period. represents for the Herfindahl-Hirschman value at time t. The interaction term is intended to capture the marginal impact of banking concentration on the impacts of monetary policy changes on loan growth. refers to the error term.
0,0939 0,0954 0,0934 0,0976 0,0979 0,0949 0,0916 0,0838 0,0855 0,0857 0,0862 0,0869 0,0885 0,0874 0,0800 0,0820 0,0840 0,0860 0,0880 0,0900 0,0920 0,0940 0,0960 0,0980 0,1000 2006 2007 2008 2009 2010 2011 2012 Assets Loans
25
The variable GDP is the growth rate of real GDP, and it is included to control for changes in the demand for loans, and to isolate the effects of monetary policy on the supply side of the markets for loans. Thus, the coefficient on this variable is expected to be positive.
Using unconsolidated financial statements of commercial banks to analyze the monetary policy transmission allows us to better identify the supply-side credit channels of monetary policy transmission from the demand side interest rate channels. The response of loan supply to monetary policy shocks is expected to be different across banks with different characteristics and financial strength. To control for the impact of the financial strength in banks‟ balance sheets, we include bank specific variables which are , , referring to real assets, the ratio of equity to total assets, and the ratio of net loans to total assets, respectively.
In terms of bank size, the assumption is that bigger banks face lower external finance premia and find easier to isolate a shock to deposits by switching to alternative funding sources. In this study, we use real assets as a measurement of bank size.
The second measurement of financial strength is bank liquidity. It is calculated as the ratio of net loans to total assets. The higher this ratio indicates a bank is loaned up and its liquidity is low. The higher the ratio, the more risky a bank may be to higher defaults. The idea is that banks with more liquid balance sheets could be better prepared to insulate their loan supply from unexpected shocks to deposits.
26
The third measurement of financial strength is bank capitalization, computed as the share of equity capital in total assets. Banks with high capitalization tend to pay lower risk premia for uninsured debt financing, and should therefore also be better prepared to insulate their loan supply from unexpected shocks to reserves caused by a monetary policy tightening.
In panel data models, fixed and random effects estimations are the two most used estimation techniques. The random effects estimation treats in equation (1) as random, whereas the fixed effects estimation treats it as random. It should be assumed that and the other explanatory variables in the model are independent in order to be able to get consistent estimation results from the random effects model. I conducted the Hausman test, which tests whether the explanatory variables and are independent, in order to decide whether the model should be estimated with the fixed effects method or the random effects method. Since the random effects estimation is consistent only under the null hypothesis, and the fixed effects estimation is consistent both under the null hypothesis and the alternative hypothesis, rejecting the null hypothesis implies that the fixed effects estimation should be used. The Hausman test statistics can be computed as follows:
( ̂
̂
)
[ ̂
̂
]
( ̂
̂
) (2)
The test statistics have a chi-square distribution with degrees of freedom equal to the number of independent variables in the regression. From the estimation of fixed effects and random effects models, the value of the test statistics is calculated as 49.13 which is significantly higher than the critical
27
chi-square value. Thus, I rejected the null hypothesis and decided to use the fixed effects estimation.
5 ESTIMATION RESULTS and DISCUSSION
5.1 Estimation Results
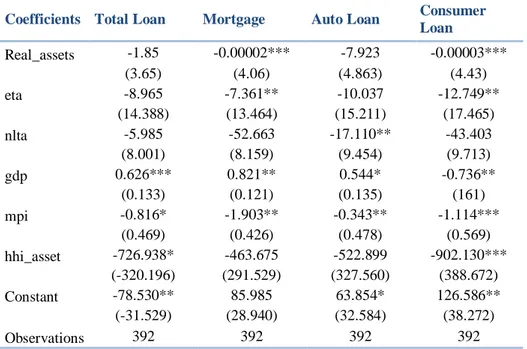
Table 5.1 shows the estimation results of equation (1) using fixed effects. Four different sets of loans are analyzed: total loans, mortgage, auto loans and consumer loans. The results for bank specific fixed effects are not reported here, but the F statistics related with the joint significance of these effects indicate that they are jointly significant under all alternative specifications. The F-statistics that test the overall explanatory power of the model are significant at the 1% level, and the R-squared of the regression, which is 0.37 under the baseline specification, shows that the model fits the data reasonably well.
First, I look at the results for bank-specific variables to see whether they affected the growth rate of loans commercial banks in Turkey. Following the related literature, three bank-specific variables are included in the model, namely- real assets, the ratio of equity to total assets, and the ratio of net loans to total assets. The coefficients on the three variables measuring the strength of banks‟ balance sheets show that loan growth varies across banks of different degrees of liquidity and capitalization. In all regressions, the coefficient on liquidity is shown to be statistically insignificant or unexpectedly negative. Under all specifications where was included in the model, the coefficients on the real assets are negative, implying that banks
28
with larger asset size tend to have a lower growth rate of loans. This result is consistent with the findings of Kishan and Opiela (2000) that small banks are the most responsive to changes in monetary policy. On the other hand, it can be thought that large banks have access to alternative sources of funding and so they should have had higher loan growth. In all regressions, the coefficients on the measure of the monetary policy are negative and significant as expected, which indicates that the growth rate of loans falls when a country‟s central bank tightens its monetary policy. The effect is the largest when the dependent variable is mortgage and smallest in the regression on auto loans. Not surprisingly, the coefficient on the GDP growth rate is positive and significant, implying that the growth rate of bank loans is larger in a growing economy where the demand for loans is rising. Furthermore, the obtained positive and significant coefficient on the HHI index is negative, which suggests that increased concentration in the banking sector makes monetary policy weaker, reducing its impact on the supply of credit.
As reported in Table 5.1, the transmission mechanism of the monetary policy is shown to be affected by the different characteristics of banks, which is an important property of the bank lending channel. These results show that as concentration in banking increases, monetary policy transmission through the bank lending channel decreases, and that this works particularly through the effects on smaller and less capitalized banks. This is consistent with the predictions of the bank lending channel, banks that are more financially constrained find it more difficult to fully substitute
29
with alternative sources of funding the loanable funds lost due to a tightening monetary policy. Therefore, banks need to cut back their loan supply more than other banks in response to a monetary policy tightening.
Table 5.1: Estimation Results for Loan Notes: The numbers in parentheses denote standard errors of the coefficients.
* The statistical significance at the 10% level. ** The statistical significance at the 5% level. *** The statistical significance at the 1% level.
The level of market concentration and change in that level have the expected negative effects on the growth rate of loans in all four regressions, and the effects are really high. The effect is largest when the dependent variable is consumer loan growth and smallest when the dependent variable is mortgage. To be more specific, a 1% increase in the concentration in the banking sector can be expected to generate a 902% decline in quarterly loan growth.
Coefficients Total Loan Mortgage Auto Loan Consumer
Loan Real_assets -1.85 -0.00002*** -7.923 -0.00003*** (3.65) (4.06) (4.863) (4.43) eta -8.965 -7.361** -10.037 -12.749** (14.388) (13.464) (15.211) (17.465) nlta -5.985 -52.663 -17.110** -43.403 (8.001) (8.159) (9.454) (9.713) gdp 0.626*** 0.821** 0.544* -0.736** (0.133) (0.121) (0.135) (161) mpi -0.816* -1.903** -0.343** -1.114*** (0.469) (0.426) (0.478) (0.569) hhi_asset -726.938* -463.675 -522.899 -902.130*** (-320.196) (291.529) (327.560) (388.672) Constant -78.530** 85.985 63.854* 126.586** (-31.529) (28.940) (32.584) (38.272) Observations 392 392 392 392
30
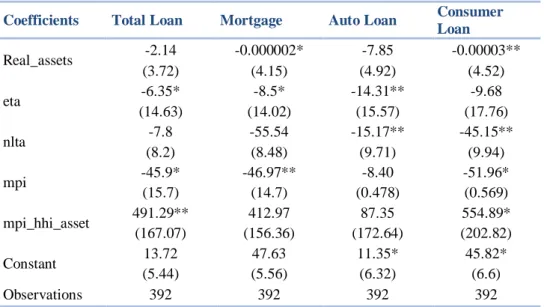
Coefficients Total Loan Mortgage Auto Loan Consumer
Loan Real_assets -2.14 -0.000002* -7.85 -0.00003** (3.72) (4.15) (4.92) (4.52) eta -6.35* -8.5* -14.31** -9.68 (14.63) (14.02) (15.57) (17.76) nlta -7.8 -55.54 -15.17** -45.15** (8.2) (8.48) (9.71) (9.94) mpi -45.9* -46.97** -8.40 -51.96* (15.7) (14.7) (0.478) (0.569) mpi_hhi_asset 491.29** 412.97 87.35 554.89* (167.07) (156.36) (172.64) (202.82) Constant 13.72 47.63 11.35* 45.82* (5.44) (5.56) (6.32) (6.6) Observations 392 392 392 392
Table 5.2: Estimation Results for Different Types of Loan
Notes: The numbers in parentheses denote standard errors of the coefficients.
* The statistical significance at the 10% level. ** The statistical significance at the 5% level. *** The statistical significance at the 1% level.
We include mpi*hhi_asset our sample in order to check differences in the bank lending and structural results. Table 5.2 show the results for sets of regressions using our four measures of growth rate of loans as the dependent variables. We find that the coefficients of interest have the same signs and roughly same magnitudes as in the previous regressions. In all cases, the coefficients on the monetary policy indicator are still negative and significant. However, the coefficients on the interaction term of monetary policy and banking concentration are positive and statistically significant. The effect is largest when the dependent variable is consumer loan and smallest when the dependent variable is auto loan. This positive sign suggests that banking concentration weakens the transmission mechanism of monetary policy through the bank lending channel. An increased level of
31
concentration in the Turkish banking sector is shown to reduce the impact of monetary policy transmission.
To sum up, our regression results show that the bank lending channel of monetary policy transmission is weaker in more heavily concentrated banking sectors, and it works through the impacts on smaller and less capitalized banks.
6 CONCLUSION
In this research, we examined how changes in concentration in the banking sector affects the transmission of monetary policy through the bank lending channel in Turkey by looking at the period covering the years from 2006 to 2012. We looked at how the quarterly loan growth of commercial banks changed in response to a monetary policy shock and investigated whether there was a difference between different types of loans. This topic is very interesting when the global financial crises are resulting in significant concentration in the banking sector, and when monetary policy is being generally used to deal with economic recessions. Thus, it is important to examine the concentration evolved in the banking sector during this period.
First of all, I look at total assets and loans to measure the concentration in banking and find that there has not been a remarkable change in concentration measurements for this time period. It is found that total assets have a larger level of concentration than loans. We also find that both for
32
total assets and loans, the HHI index take values less than 0.10 for all years between 2006 and 2012, implying a non-concentrated sector.
Secondly, with focusing on the bank lending channel, we presented evidence that banking concentration is inversely related to the effectiveness of monetary policy. An increased level of concentration in Turkish banking sector is shown to reduce the impact of monetary policy transmission. This is especially true for banks of smaller size and lower capitalization.
We leave for future work the study of impacts of changes in other specific forms of market framework that happen together with a rise in the level of concentration. Among these, some of the most important changes are considered to be changes in bank ownership type, efforts of privatization and increased presence of participation and foreign banks.
33
BIBLIOGRAPHY
Abbasoğlu, O. F., Aysan A. F., and Gunes A. (2007). Concentration, competition, efficiency and profitability of the Turkish banking sector in the post-crises period.
Adams, R. M., and Amel, D. F. (2005). The effects of local banking market structure on the bank-lending channel of monetary policy. Division
of Research & Statistics and Monetary Affairs, Federal Reserve Board.
Alper, K., Hulagu, T., and Keles, G. (2012). An empirical study on liquidity and bank lending. Central Bank of the Republic of Turkey Working
Paper, 4.
Aydin, B., and Igan D. (2011). Bank lending in turkey: Effects of monetary and fiscal policies. IMF Working Papers, 1-31.
Akın, G. G., Aysan, A. F., and Yıldıran, L. (2009). Transformation of the Turkish financial sector in the aftermath of the 2001 crisis. Turkey
and the Global Economy: Neo-Liberal Restructuring and Integration in the Post-Crisis Era, 73.
Aysan, A. F., and Ceyhan, A. P. (2010). Efficiency of Banking in Turkey before and after the Crises. Banks and Banks System, Vol.5-2, 179-198.
Aysan, A. F., and Ermişoğlu, E. (2013). Turkey‟s Capital Market and Banks: Recipe for Survival in Recessionary Times.
Banking Regulation and Supervision Agency (2001). “Towards a Sound Turkish Banking Sector”.
Banking Regulation and Supervision Agency (2007). “Structural Developments in Banking”, No:2.
Banking Regulation and Supervision Agency “Financial Markets Report”. various issues.
Başçı, E., Özel Ö. and Sarıkaya Ç. (2007). The monetary transmission mechanism in Turkey: new developments. Research and Monetary
Policy Department Working Paper, No. 07/04. The Central Bank of
34
Bernanke, B. S., and Blinder, A. S. (1988). Credit, money, and aggregate demand. American Economic Review, 78(2), 435-39.
Bernanke, B. S., and Blinder, A. S. (1992). The federal funds rate and the channels of monetary transmission. American Economic Review, 82(4), 901-921.
Bikker, J. A., and Haaf, K. (2002). Competition, concentration and their relationship: An empirical analysis of the banking industry. Journal
of Banking & Finance, 26(11), 2191-2214.
Brooks, P. K. (2007). The Bank Lending Channel of Monetary Transmission: Does it Work in Turkey?. IMF Working Paper 07/272.
Central Bank of the Republic of Turkey, „Financial Stability Report‟, various issues.
Çatik, A. N., and Karaçuka, M. (2012). The bank lending channel in Turkey: Has it changed after the low-inflation regime?. Applied
Economics Letters, 19(13), 1237-1242.
Kashyap, K., Stein, J.C., (1995). The impact of monetary policy on bank balance sheets. Carnegie-Rochester Conference Series on Public
Policy, 42(1), 151-195.
Kashyap, A. K., and Stein, J. C. (1997). Monetary policy and bank lending in Monetary policy (pp. 221-261). The University of Chicago Press. Kashyap, K., and Stein, J.C., (2000). What do a million observations on
banks say about the transmission of monetary policy? American
Economic Review, 90(3), 407-428.
Kashyap, A. K., Stein, J. C., & Wilcox, D. W. (1993). Monetary policy and credit conditions: Evidence from the composition of external finance (No. w4015). National Bureau of Economic Research. Kishan, R.P., and Opiela, T.P. (2000). Bank size, bank capital, and the bank
lending channel. Journal of Money, Credit and Banking, 32(1), 121-41.
Macit, F. (2012). Does Bank Ownership Affect the Credit Channel of Monetary Policy?. Applied Economics Quarterly (formerly: Konjunkturpolitik), 58(2), 139-151.
35
Macit, F. (2012). Who responds more to monetary policy, conventional banks or participation banks?. Journal of Economics Finance and
Administrative Science, 17(33), 10-14.
Macit, F. (2012). Recent evidence on concentration and competition in Turkish banking sector. Theoretical and Applied Economics, 8(8), 19.
Olivero, M. P., Li, Y., and Jeon, B. N. (2011). Competition in banking and the lending channel: Evidence from bank-level data in Asia and Latin America. Journal of Banking & Finance, 35(3), 560-571. Olivero, M. P., Li, Y., and Jeon, B. N. (2011). Consolidation in banking and
the lending channel of monetary transmission: Evidence from Asia and Latin America. Journal of International Money and
Finance, 30(6), 1034-1054.
Peek, J., and Rosengren, E. (1995). Bank regulation and the credit crunch. Journal of Banking & Finance, 19(3), 679-692.
Romer, C. D., and Romer, D. H. (1990). New evidence on the monetary transmission mechanism. NBER Working Paper, (R1500).
Stein, J. C. (1998). An adverse selection model of bank asset and liability management with implications for the transmission of monetary policy (No. w5217). National Bureau of Economic Research.
Şengönül, A. and Willem T. (2005). The Effect of Monetary Policy on Bank Lending in Turkey. Applied Financial Economics, vol. 15(13), pp. 931-934.