ISSN 2324-805X E-ISSN 2324-8068 Published by Redfame Publishing URL: http://jets.redfame.com
The Turkish Adaptation of the Mathematical Resilience Scale:
Validity and Reliability Study
Nejla Gürefe1, Veysel Akçakın1
1
Usak University, Faculty of Education, Mathematics Education, Usak, Turkey
Correspondence: Nejla Gürefe, Usak University, Faculty of Education, Mathematics Education, Usak, Turkey. E-mail: [email protected]
Received: February 5, 2018 Accepted: March 1, 2018 Online Published: March 6, 2018 doi:10.11114/jets.v6i4.2992 URL: https://doi.org/10.11114/jets.v6i4.2992
Abstract
Persistent in mathematical studies is an important element allowing students to be successful in their STEM careers, and there is a need for affective measurement instruments to assess persistence in mathematics in spite of problems. For this reason, this study aims to adapt the Mathematical Resilience Scale developed to assess resilience, which is described as having a positive attitude towards mathematics, to Turkish. The fitness of the factor structure of the scale consisting of three factors was investigated using the confirmatory factor analysis. The reliability of the scale and its factors was assessed using the Cronbach’s Alpha reliability coefficient. The reliability value was found to be .92, .80, .76, and .87 for the value factor, the struggle factor, the growth factor, and the entire scale, respectively. The confirmatory factor analysis validated the factor structure of the scale, and the second-level confirmatory factor analysis was performed to show that the factors of the scale were components of resilience. As a result, it was found that the resilience consisted of three components, namely value, struggle, and growth, and the scale was capable of measuring mathematical resilience of undergraduate students validly and reliably.
Keywords: mathematical resilience, STEM, confirmatory factor analysis, undergraduate students 1. Introduction
Affective traits are just as important as cognitive traits in learning. Indeed, there has been a considerable increase in research interest in non-cognitive traits such as resilience in education (Duckworth, Peterson, Matthews, and Kelly, 2007; Yeager and Dweck, 2012). Psychological resilience has been intensively studied in the literature; however, mathematical resilience studies have emerged as a new approach (Rivera and Waxman, 2011; Yeager and Dweck, 2012). Resilience is the ability to respond positively in the face of a difficulty (Luthar, Cicchetti, and Becker, 2000), the ability to adapt and tackle difficulties (Joseph, 1994), and the ability to cope with problems in everyday life (Allen, Hurtes and Stevens, 1999). Psychological resilience, on the other hand, is the process of achievement or adaptation (Hunter, 2001), the ability to compose oneself in problematic situations (Garmezy, 1991), the ability to cope with a disaster and successfully overcome difficulties (Wagnild and Young, 1993), and the ability to achieve successful adaptation in case of attack, threat, trauma, stress, difficulty, or distress (Masten and Coatsworth, 1998). Psychological resilience usually involves attaining positive results in spite of risks of any nature. Psychological resilience is not only a personality trait that safeguards people from a variety of negative effects, it is also a protective factor that leads to development of attitudes and skills which lead individuals to success under challenging life conditions and mitigate possible effects of circumstances that pose external risks (Beauvais and Oetting, 1999). This protective factor is defined as a state of mind which mitigates or eliminates the negative effect of being at risk or facing challenges, helps individuals adapt successfully, and enhances competence (Masten, 1994; Terzi, 2006). The concept of mathematical resilience has been introduced in the literature utilizing definitions made for psychological resilience.
Mathematical resilience is defined as the ability to persevere when faced with difficulties, work collaboratively with peers, possess the language skills needed to express one’s understandings or lack of it, and withstand learning-related difficulties (Johnston-Wilder and Lee, 2010), and the ability to have a positive outlook in spite of difficulties (Yeager
This study has been presented at the 1st International Education Research and Teacher Education Congress, Usak, Turkey.
and Dweck, 2012). When those who have mathematical resilience experience the negative stimuli, they respond by functioning optimally rather than develop anxiety (Kooken, Welsh, McCoach, Johnson-Wilder, and Lee, 2013). As can be understood from the definitions, mathematical resilience considers perseverance in the face of problems, in other words, it emerges in case of certain challenges. Students sometimes may believe that they cannot learn mathematics; they may experience mathematics anxiety during an exam or in classroom (Chamberlin, 2010; Hembree, 1990; Richardson and Suinn, 1972). Rather than a learning difficulty, Reynolds (2003) addresses mathematics anxiety as a feeling which puts individuals in a position that is difficult to cope with, and states that many students suffer from this feeling. Similarly, studies show that students avoid mathematics due to this feeling (Hembree, 1990), adopt a negative attitude towards learning mathematics (Bessant, 1995), and have reduced success in mathematics as a result (Alkan, 2011; Ma, 1999; Rounds and Hendel, 1980; Tobias, 1991). It is reported in the literature that only individuals with lower mathematics anxiety are more eager in difficult mathematical studies, show more persistence in the face of obstacles, and set higher goals (Pajares and Kranzler, 1995; Schunk, 1989). In some studies, such individuals are described as being unyielding, which allows them to become successful in challenging and difficult situations (Öğülmüş, 2001; Gürgan, 2006). Also, these individuals with high mathematical resilience usually have high self-respect and are aware of their skills and capacities (Gordon, 1996; Margalit, 2003), have a tough personality (Howard and Johnson, 2000), successfully cope with problems (Jew, Green, and Kroger, 1999), have improved problem-solving skills (Rak and Patterson, 1996; Masten, 2001). Johnston-Wilder and Lee (2010) and Yeager and Dweck (2012) emphasize that mathematical resilience, which ensures students persevere when faced with difficulties in mathematics, is quite important in achievement in mathematics, while Alva (1991) notes that students with high mathematical resilience in spite of possibly challenging situations in school. Efficient teaching and learning applications require the participation of both socially and mentally competent individuals. This is only possible by raising students who can strive in difficult and challenging situations (Kırımoğlu, Yıldırım, and Temiz, 2010). This has increased the need for individuals with high resilience. Studies report that psychological resilience is a learnable characteristic (Beardslee and Podorefsky, 1998). In this sense, it is possible to say that mathematical resilience is also learnable.
Mathematical resilience can increase students’ active participation in the classroom by improving their motivation and allow them to better understand the material in short-term, while it enhances students’ persistence in taking higher-level mathematics courses and focusing on a career in science, technology, engineering, and mathematics (STEM) in long-term (Johnston-Wilder and Lee, 2010). When learning mathematics, students encounter difficulties to varying degrees, and they are expected to have a certain level of mathematical resilience to overcome such difficulties (Kooken, Welsh, McCoach, Johnston-Wilder, and Lee, 2016). While some students keep studying in spite of their failure in mathematics, while others exhibit the opposite behavior. There is a need for approaches which encourage more students from all skill levels to be more persistent in mathematics. STEM is an approach which encourages students directly, allow them to achieve their dreams, and experience what they learn in various learning environments (Yıldırım, 2013). Today, we need productive and creative individuals who make inquiries in branches of science related to STEM, rather than individual who memorize formulas or place numbers in equations (Read, 2013). By making connections between real life problems and subject contents (Moore, Stohlmann, Wang, Tank, and Roehrig, 2013), individuals with sufficient competence in STEM solve problems, direct criticisms, and assess what they have learned on a logical basis (Yıldırım, 2013). Those who aim to achieve success in STEM fields are expected to tackle many challenges (Kooken et al., 2016). A successful career in STEM requires advanced mathematical knowledge (Johnston-Wilder and Lee, 2010). It is noted that affective traits such as motivation, belief, attitude, and resilience are important to take these advanced mathematical courses and persevere in this path (Ma, 2006) and such affective traits are significant predictors of improved cognitive activities and success (Buff, Reusser, Rakoczy, and Pauli, 2011; Ma and Kishor, 1997). In this sense, studies investigating affective traits such as mathematical resilience are of great importance (Yeager and Dweck, 2012). We believe that this study will contribute to the literature by guiding educators in terms of understanding characteristics which are indicators of mathematical resilience and determining student expectations for success and sustainability in mathematics at all levels. Also, since it is not possible to measure mathematical resilience directly, there is a need for reliable measurement tools to assess students’ mathematical resilience. For this reason, this study aims to achieve a Turkish adaptation of the Mathematical Resilience Scale developed by Kooken et al. (2016) to measure mathematical resilience of university students. We believe that this scale will serve as a guide to distinguish individuals who have reduced mathematics engagement particularly in the face of difficulties and understand them better, as well as taking various measures to improve their mathematical resilience.
2. Method
2.1 Research Design
The cross-sectional survey model was employed for the adaptation of the scale. Within the framework of the cross-sectional survey model, which measures variables only once (Fraenkel and Wallen, 2006), mathematical resilience levels of the undergraduate students were determined via their answers to the scale items.
2.2 Participant Characteristics
The participants of the study were 834 undergraduate students attending faculties of education and engineering in a university located in the Aegean Region of Turkey during the 2016-2017 academic year. These students were selected using the purposive sampling method from departments reflective of STEM such as Elementary School Mathematics Teaching, Science Teaching, Classroom Teaching, Social Studies Teaching, Computer and Computer Technologies Teaching, Civil Engineering, and Mechanical Engineering. 54.4% (n=454) of the students were female and 45.6% (n=380) were male. 74.8% (n=624) of the students were from the faculty of education, 25.2% (n=210) were from the faculty of engineering. While 23.3% (n=194) of the students were 1st grade, 28.5% (n=238) were 2nd grade, 24.1% (n=201) were 3rd grade, and 24.1% (n=201) were 4th grade.
2.3 Data Collection Tool: The Mathematical Resilience Scale
The original form of the Mathematical Resilience Scale developed by Kooken et al. (2016) consists of twenty-four items and three factors. The three factors of the scale, “value, struggle and growth”, were translated as “değer, mücadele and gelişim”, respectively, in accordance with opinions of experts in Turkish language and mathematics teaching. The value factor includes eight items, the struggle factor includes nine items, and the growth factor includes seven items. Explanations about these factors can be found below:
The Value Factor: This factor relies on the expectancy-value theory which suggests that when students believe that mathematics is valuable, they will be more motivated and interested in mathematics (Chouinard, Karsenti, and Roy, 2007). In other words, the value that students place on studying mathematics is closely related to their current or future goals, and seen as a significant predictor of success (Deci, Vallerand, Pelletier, and Ryan, 1991). If students value mathematics and careers which require mathematics, they will be more persistent in the face of difficulties (Kooken et al., 2016).
The Struggle Factor: This factor relies on Bandura’s (1989) theory of human agency. The theory explains individuals’ capacity to use their control on their own thinking processes, motivation, and actions. Struggle refers to the fact that students sometimes need to make a lot of effort to learn mathematics. Because the difficulty of mathematics cannot be explained as personal incompetence. Actually, to struggle is not an unusual thing in mathematics. It is possible to say that even extraordinary mathematicians have to work very hard to learn and solve mathematical problems, and make mistakes in the process (Kooken et al., 2016).
The Growth Factor: This factor depends on the idea that individuals can improve their mathematical knowledge (Dweck, 2000; Yeager and Dweck, 2012). This factor depending on works of Dweck (2000) explains that students who have the growth mindset seek challenges and develop strategies to overcome difficulties. Students who have the growth mindset believe that they can learn much more when they study mathematics (Dweck, 2000). On the other hand, students with the fixed mindset tend to avoid activities which result in difficulties and thus gain less.
Kooken et al. (2016) found that the reliability coefficient was 0.94 for the value factor, 0.73 for the struggle factor, and 0.83 for the growth factor. The 7-point Likert scale is answered as “Strongly Agree”, “Agree”, “Somewhat Agree”, “Neutral”, “Somewhat Disagree”, “Disagree”, and “Strongly disagree”. Six items of the scale are negative and inversely scored. A high score achieved in the scale indicates that the individual is mathematically resilient.
2.4 Data Analysis
Psychometric properties of the scale were tested for construct validity and reliability. The Confirmatory Factor Analysis (CFA) was carried out to detect the construct validity of the scale. In scale adaptation studies in different cultures, it is recommended to begin directly with CFA to determine the factor pattern of the scale in the target culture. However, if the CFA does not validate the model for the factors in the scale’s original form or fitness indices are not high, the Exploratory Factor Analysis may be necessary, too, in order to determine the factor pattern in the target culture (Çokluk, Şekercioğlu, and Büyüköztürk, 2010). The Exploratory Factor Analysis was not used in this study since the model for the factors in the scale’s original form was validated. Cronbach’s Alpha internal consistency coefficient and McDonald’s Omega coefficients were used to determine the internal consistency coefficients of the entire scale and its factors. Also, item-total test correlations were calculated.
3. Results
3.1 Language Equivalence
First of all, Janice Kooken, the researcher who developed the original scale, was contacted via e-mail in order to receive permission for Turkish adaptation of the study. The original form in English was translated to Turkish by two researchers with doctorate degrees in mathematics teaching independently, thus the draft form was created. Opinions of two faculty members specializing in psychology and another researcher specializing in mathematics teaching were received in cases where a consensus could not be reached between the researchers regarding the translation. In the next
stage, the Turkish version of the scale was checked by a faculty member specializing in foreign languages and then two faculty members specializing in Turkish language, and necessary changes were made. Hambleton’s (1993) test adaptation method was employed to achieve language equivalence. This method considers cultural adaptation rather than a word-for-word translation. The test adaptation method was used in this study, and the consistency between original items and translated items was assessed and translated items were revised for fitness to Turkish culture by expert researchers.
Especially the translation of the word “resilience” caused discrepancies in the process of achieving language equivalence. This word was translated as “sağlamlık” and “dayanıklılık” by the experts. A literature review showed that there was no consensus on the Turkish equivalent of the word. “Resilience” was translated as “yılmazlık” by Öğülmüş (2001) and Gürgan (2006), as “kendini toparlama gücü” by Terzi (2006), as “sağlamlık” by Karaırmak (2007), and as “dayanıklılık” by Taşğın and Çetin (2006). Basım and Çetin (2010) determined the Turkish equivalent of the word to be “dayanıklılık” in a survey study. Considering this reference, we translated the word “resilience” as “dayanıklılık” in our study as well.
3.2 Construct Validity
CFA was used to test whether or not the data fitness of the model suggested for the construct validity of the scale was suitable for Turkish.
3.3 Confirmatory Factor Analysis
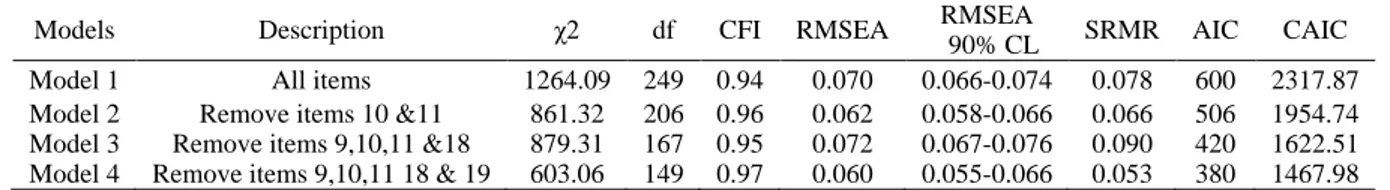
The model-data construct of the scale in a Turkish sample was examined using the CFA. First of all, CFA was performed for all items, and items 10 and 11 were removed from the analysis since they yielded a factor load of 0.00 and 0.12, respectively. The resulting goodness of fit indices can be seen in Table 1 as Model 1. The analysis was repeated after removing items 10 and 11. The covariance matrix was re-calculated before each repetition. Similarly, items 9 and 18 were removed from the analysis due to low factor load (0.25). These results can be seen in Table 1 as Model 2. After re-establishing the covariance matrix, CFA was repeated, and item 19 was removed from the analysis due to low factor load (0.17). These findings can be seen in Table 1 as Model 3. The analysis was repeated after re-calculating the covariance matrix, and the analysis was ended since all factors showed high factor load and low error variance. The findings obtained from this analysis can be seen in Table 1 as Model 4.
Table 1. Model Fit indices
Models Description χ2 df CFI RMSEA RMSEA
90% CL SRMR AIC CAIC Model 1 All items 1264.09 249 0.94 0.070 0.066-0.074 0.078 600 2317.87 Model 2 Remove items 10 &11 861.32 206 0.96 0.062 0.058-0.066 0.066 506 1954.74 Model 3 Remove items 9,10,11 &18 879.31 167 0.95 0.072 0.067-0.076 0.090 420 1622.51 Model 4 Remove items 9,10,11 18 & 19 603.06 149 0.97 0.060 0.055-0.066 0.053 380 1467.98 The CFI index was used since sample size and degree of freedom must be considered in assessment of model fitness (Şimşek, 2007). Also, the Akaike Information Criteria (AIC) (Akaike, 1974) and the Consistent AIC (CAIC) (Bozdogan, 1987) were used. While a higher value indicates better fitness for CFI, a lower value indicates a better model for AIC and CAIC. CAIC was developed due to the sensitivity of AIC to the degree of freedom (Şimşek, 2007). After examining indices shown in Table 1, model 4 was decided to be a better model compared to others.
The chi-square value obtained in the first CFA was significant (p<.01). Since chi-square is affected by the sample size, it is necessary to assess the value obtained by dividing the chi-square value by the degree of freedom (Çokluk, Şekercioğlu, and Büyüköztürk, 2010). Accordingly, the X2/sd value showed an acceptable fitness (X2/sd=603, 06/149=4.04). Other goodness of fit values was GFI=0.92, AGFI=0.89, CFI=0.97, NFI=0.96, NNFI=0.96, IFI=0.97, RMSEA=0.060, and SRMR=0.053. Compared to goodness of fit values in Tabachnick and Fidell’s (2013) study, it was determined that GFI, AGFI, NFI, NNFI, RMSEA, and SRMR values in this study showed acceptable fitness, while CFI and IFI values showed excellent fitness. These values indicate that the three-factor model obtained in CFA was validated. Non-standardized CFA factor loads found in the first CFA can be seen in Table 2. The path diagram and standardized factor loads found in CFA are shown in Figure 1.
Table 2. Non-Standardized CFA results
DFA Non-standardized
Items I II III σ2 (E) R2 t value Item-total test
correlations Value Explained variance 34.51 % Reliability (α=.92 ω=.92)
1 1.32 0.89 0.66 30.63 .767** 2 1.35 0.66 0.73 35.32 .778** 3 1.22 1.13 0.57 26.89 .620** 4 1.33 0.81 0.69 31.86 .748** 5 1.27 0.79 0.67 30.21 .750** 6 1.09 1.08 0.52 22.55 .698** 7 1.01 2.19 0.32 17.66 .493** 8 1.02 1.08 0.49 22.27 .665**
Struggle Explained variance 10.86% Reliability (α=.80 ω=.79)
12 0.98 1.02 0.48 20.75 .541** 13 0.97 0.96 0.49 20.94 .561** 14 0.86 1.17 0.38 17.73 .484** 15 0.84 1.92 0.27 14.31 .380** 16 0.98 1.11 0.47 20.83 .590** 17 0.89 1.88 0.30 15.35 .432**
Growth Explained variance 12.75% Reliability (α=.76 ω=.77)
20 1.28 1.64 0.50 20.11 .511**
21 1.10 2.27 0.35 15.61 .344**
22 1.17 2.25 0.38 15.99 .391**
23 1.29 2.34 0.42 17.25 .405**
24 1.08 2.22 0.35 15.43 .409**
Total Explained variance 58.11% Reliability (α=.87 ω=.94) **p<.01
The Cronbach’s Alpha was calculated for the Mathematical Resilience Scale and its factors. As shown in Table 2, the Cronbach’s Alpha was 0.92 for the value factor, 0.80 for the struggle factor, 0.76 for the growth factor, and 0.87 for the entire scale. Since factor loads of the scale were not even and showed a congeneric property, the Mcdonald’s Omega (ω) reliability value was calculated as well. The Mcdonald’s Omega (ω) reliability value was found to be 0.92 for the value factor, 0.79 for the struggle factor, 0.77 for the growth factor, and 0.94 for the entire scale. The fact that these values were greater than 0.7 indicates high reliability (Nunnally and Bernstein, 1994). Based on these findings, it is safe to say that the scale and its factors had adequate reliability. Also, high and positive item-total test correlations were indicators of the scale’s consistency and additivity.
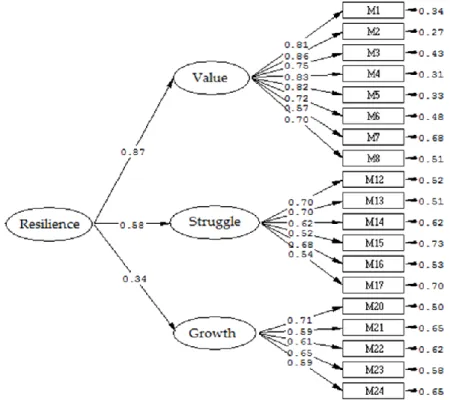
t values are significant at .01 level if greater than 2.56 (Çokluk, Şekercioğlu, and Büyüköztürk, 2010). Table 2 shows t values obtained in CFA. In this context, the resulting t values were found to be significant at .01 level. It was observed that all t test values obtained in the first-level CFA were significant at .01 level, and varied from 14.31 and 35.32. This finding can be considered as another indicator of the sufficient sample size for the factor analysis as well (Byrne, 2012). The first-level CFA showed that the scale was suitable for the Turkish language. Then, the second-level CFA was performed to show that the factors were the components of the resilience implicit variable seen as the superstructure. The results of the second-level CFA and the path diagram can be seen in Figure 2.
Figure 2 shows the hierarchical structure found in the second-level CFA. It was seen that value, struggle, and growth factors were components of resilience. The impact of value as a factor of resilience was 0.87, followed by struggle with 0.58, and growth with 0.34. By taking the square of each impact value, it was calculated to what degree each factor explained resilience as percentage. Value was found to explain 75% of resilience, followed by struggle with 34%, and growth with 11%. This result is similar to the original scale. Based on this finding, we can say that value was the most effective factor, while growth was the least effective factor. First- and second-level CFA results can be seen in Table 3.
Figure 2. Second-level CFA path diagram
Table 3. First- and Second-level CFA Results
Fit indices First-level DFA Second-level DFA
X2/df 603.06/149=4.04 603.06/149=4.04 GFI 0.92 0.92 AGFI 0.89 0.89 CFI 0.97 0.97 NFI 0.96 0.96 NNFI 0.96 0.96 IFI 0.97 0.97 RMSEA 0.060[0.055;0.066] 0.060[0.055;0.066] SRMR 0.053 0.053
As shown in Table 3, adding second-level relations did not cause a change in the fitness. This may be considered as an evidence for the second-level CFA (Şimşek, 2007). In other words, goodness of fit indices were identical both in the first-level and the second-level CFA. t values obtained in the second-level CFA for value, struggle, and growth components which form the resilience superstructure can be seen in Figure 3.
Figure 3. t test values for the Mathematical Resilience Scale and its factors
t values shown in Table 3 were found to be significant at .01 level. This result indicates that value, struggle, and growth factors were significant predictors of resilience. It was concluded that the implicit variable of resilience could explain the implicit variables of value, struggle, and growth. The correlation between the factors was also assessed, and a significant correlation was found between value and struggle at .462 level, between value and growth at .220 level, and between struggle and growth at .116 level (p<.01).
4. Discussion and Conclusion
In this study, the Mathematical Resilience Scale developed by Kooken et al. (2016) was adapted to Turkish by testing for validity and reliability. The test adaptation method was used to achieve language equivalence, and the scale was translated from English to Turkish based on opinions from language experts. The scale was tested for validity and reliability. The construct validity was assessed for validity, and the internal consistency coefficients were calculated for reliability. The construct validity of the scale was confirmed with CFA, items 9, 10, 11, 18, and 19 were removed from the scale due to low factor load. The CFA showed a structure consisting of three factors, namely value, struggle, and growth, and 19 items. The value factor included eight items, whereas the struggle factor included six items, and the growth factor included five items. Goodness of fit indices for the 19-item Turkish form of the scale showed that the scale was validated by the theoretical structure. CFA performed with 19 items in total yielded a CFI value of 0.97, an AIC value of 380, and an RMSEA value of 0.60. While the CFI value in this study was higher than the CFI value (0.911) found in the study performed by Kooken et al. (2016), AIC (637.08) and RMSEA (0.063) were lower. In this sense, it can be said that CFA results showed better fitness.
The reliability of the scale and its factors was assessed using Cronbach’s Alpha and McDonald’s Omega reliability coefficients. The Cronbach’s Alpha internal consistency value was 0.92 for the value factor, 0.80 for the struggle factor, 0.76 for the growth factor, and 0.87 for the entire scale. The Mcdonald’s Omega (ω) reliability value was found to be 0.92 for the value factor, 0.79 for the struggle factor, 0.77 for the growth factor, and 0.94 for the entire scale. These values indicate that the scale and its factors had adequate reliability. In the study performed by Kooken et al. (2016), the Cronbach’s Alpha internal consistency coefficient was found to be 0.94 for value, 0.73 for struggle, and 0.83 for growth. Reliability coefficients in both studies can said to be similar. All findings obtained in this study showed that the adapted scale could be used as a valid and reliable measurement instrument to assess mathematical resilience of students. This scale can be used to distinguish students who are likely to maintain studying mathematics in spite of all challenges and difficulties. STEM programs in universities expect students to be resilient in mathematics as well (Kooken et al., 2016). In their studies, Kooken et al. (2013) and Johnston-Wilder, Brindley, and Dent (2014) found mathematical resilience of STEM students to be higher compared to students from other fields. The struggle factor in particular significantly contributes to determination of characteristics which ensure the individual will persevere in mathematics. Results obtained in previous studies show that students who take STEM courses have higher struggle scores compared to those who do not (Kooken, et al. 2016). This adapted scale can be used to assess mathematical resilience of university students. Based on findings obtained using this scale, applications necessary to improve mathematical resilience, mathematical computation skills, and mathematical achievement levels of students can be carried out (Johnston-Wilder and Lee, 2010). Also, the scale can be used to reveal effectiveness of education by assessing whether or not teaching approaches in use lead to an improvement in mathematical resilience.
There is no study, to the best of our knowledge, in the Turkish literature on Mathematical Resilience. Hence, we believe that the adaptation of this scale will contribute to the literature. The adaptation of this scale was performed with university students, and it was demonstrated that the scale was valid and reliable for university students. Also,
mathematics knowledge is the necessary since the year of childhood (Papadakis, Kalogiannakis and Zaranis, 2016). Thus, the validity and reliability studies of the scale can be examined for other learning levels such as kindergarten, primary, middle and high school.
References
Akaike, H. (1974). A new look at the statistical model identification. IEEE Transactions on Automatic Control, 19, 716-723. https://doi.org/10.1109/TAC.1974.1100705
Alkan, V. (2011). Etkili matematik öğretiminin gerçekleştirilmesindeki engellerden biri: kaygı ve nedenleri. Pamukkale Üniversitesi Eğitim Fakültesi Dergisi, 29(29), 89-107.
Allen, L. R., Hurtes, K., & Stevens, B. (1999). Making an impact. Cure for antisocial behavior found. Parks & Recreation, 34(11), 68-77.
Alva, S. A. (1991). Academic invulnerability among Mexican-American students: the importance of protective resources and appraisals. Hispanic Journal of Behavioral Sciences, 13, 18–34.
https://doi.org/10.1177/07399863910131002
Bandura, A. (1989). Human agency in social cognitive theory. American Psychologist, 44, 1175–1184. https://doi.org/10.1037/0003-066X.44.9.1175
Basım, H. N., & Çetin, F. (2010). Yetişkinler için psikolojik dayanıklılık ölçeğinin güvenirlik ve geçerlilik çalışması. Türk Psikiyatri Dergisi, 22, 1-13.
Beardslee, W., & Podorefsky, D. (1988). Resilient adolescents whose parents have serious affective and other psychiatric disorders. American Journal of Psychiatry, 145(1), 63-69. https://doi.org/10.1176/ajp.145.1.63
Beauvais, F., & Oetting, E. R. (1999). Drug Use, Resilience, and Myth of the Golden Child. In M. D. Glantz ve J. L. Johnson (Eds.) Resilience and Development: Positive Life Adaptations (101-107). New York: Kluwer Academic / Plenum Publishers.
Bessant, K. C. (1995). Factors associated with types of mathematics anxiety in college students. Journal for Research in Mathematics Education, 26(4), 327–325. https://doi.org/10.2307/749478
Bozdogan, H. (1987). Model selection and Akaike’s Information Criterion (AIC): the general theory and its analytical extensions. Psychometrika, 52, 345-370. https://doi.org/10.1007/BF02294361
Buff, A., Reusser, K., Rakoczy, K., & Pauli, C. (2011). Activating positive affective experiences in the classroom: “Nice to have” or something more? Learning and Instruction, 21, 452-466.
https://doi.org/10.1016/j.learninstruc.2010.07.008
Byrne, B. (2012). Structural equation modeling with AMOS: Basic concepts, applications, and programming, Newyork, NY: Taylor & Francis
Chamberlin, S. A. (2010). A review of instruments created to assess affect in mathematics. Journal of Mathematics Education, 3(1), 167–182.
Chouinard, R., Karsenti, T., & Roy, N. (2007). Relations among competence beliefs, utility value, achievement goals, and effort in mathematics. British Journal of Educational, Psychology, 77, 501–517.
https://doi.org/10.1348/000709906X133589
Çokluk, Ö., Şekercioğlu, G., & Büyüköztürk, Ş. (2010). Sosyal bilimler için çok değişkenli istatistik: SPSS ve Lisrel uygulamaları, Ankara: Pegem.
Deci, E., Vallerand, R., Pelletier, L., & Ryan, R. (1991). Motivation and education: The self-determination perspective. Educational Psychologist, 26, 325–346. https://doi.org/10.1080/00461520.1991.9653137
Duckworth, A. L., Peterson, C., Matthews, M. D., & Kelly, D. R. (2007). Grit: perseverance and passion for long-term goals. Journal of Personality and Social Psychology, 92, 1087. https://doi.org/10.1037/0022-3514.92.6.1087 Dweck, C. (2000). Self-theories: Their role in motivation, personality and development. Lillington NC: Psychology
Press, Taylor & Francis.
Fraenkel, J. R., & Wallen, N. E. (2006). How to design and evaluate research in education. New York: McGraw-Hill. Garmezy, N. (1991). Resiliency and vulnerability to adverse developmental outcomes associated with poverty.
American Behavioral Scientist, 34, 416–430. https://doi.org/10.1177/0002764291034004003
Gordon, K. (1996). Resilient Hispanic youths' self- concept and motivational patterns. Hispanic Journal of Behavioral Sciences, 18, 63-73. https://doi.org/10.1177/07399863960181007
Gürgan, U. (2006). Grupla psikolojik danışmanın üniversite öğrencilerinin yılmazlık düzeylerine etkisi. Yayımlanmamış Doktora Tezi. Ankara Üniversitesi Eğitim Bilimleri Enstitüsü, Ankara.
Hableton, R. K. (1993). Translating the achievement tests for use in cross-national studies. European Journal of Psychological Assessment, 9(1), 57-58.
Hembree, R. (1990). The nature, effects, and relief of mathematics anxiety. Journal for Research in Mathematics Education, 21(1), 33–46. https://doi.org/10.2307/749455
Howard, S., & Johnson, B. (2000). What makes the difference? Children and teachers talk about resilient outcomes for children "at risk". Educational Studies, 26(3), 321-339. https://doi.org/10.1080/03055690050137132
Hunter, A. J. (2001). A Cross-cultural Comparison of Resilience in Adolescents. Journal of Pediatric Nursing, 16, 172-179. https://doi.org/10.1053/jpdn.2001.24180
Jew, C., Green, K. E., & Kroger, J. (1999). Development and Validation of a Measure of Resiliency. Measurement ve Evaluation in Counseling ve Development, 32(2), 75-90.
Johnston-Wilder, S., & Lee, C. (2010). Developing mathematical resilience. Berea Conference Paper, University of Warwick, UK. Retrieved from http://oro.open.ac.uk/24261/2/3C23606C.pdf
Johnston-Wilder, S., Brindley, J., & Dent, P. (2014). A survey of mathematics anxiety and mathematical resilience among existing apprentices, London: Gatsby Charitable Foundation. (Online) http://wrap.warwick.ac.uk/73857 Joseph, J. M. (1994). The resilient child: Preparing today’s youth for tomorrow’s world. New York: Plenum.
Karaırmak, Ö. (2007). Investigation of personal qualities contributing to psychological resilience among earthquake survivors: A model testing study. Unpublished Doctoral Dissertation, Middle East Technical University, Ankara. Kırımoğlu, H., Yıldırım, Y., & Temiz, A. (2010). İlk ve ortaöğretim okullarında görev yapan beden eğitimi ve spor
öğretmenlerinin yılmazlık düzeylerinin incelenmesi (Hatay ili örneği), Niğde Üniversitesi Beden Eğitimi ve Spor Bilimleri Dergisi, 4(1), 88-97.
Kooken, J., Welsh, M. E., Mccoach, D. B., Johnson-Wilder, S., & Lee, C. (2013). Measuring mathematical resilience: an application of the construct of resilience to the study of mathematics. In: American Educational Research Association (AERA) 2013 Annual Meeting: Education and Poverty: Theory, Research, Policy and Praxis, 27 April -1 May 2013, San Francisco, CA, USA.
Kooken, J., Welsh, M. E., McCoach, D. B., Johnston-Wilder, S., & Lee, C. (2016). Development and validation of the mathematical resilience scale. Measurement and Evaluation in Counseling and Development, 49(3), 217-242. https://doi.org/10.1177/0748175615596782
Luthar, S., Cicchetti, D., & Becker, B. (2000). The construct of resilience: A critical evaluation and guidelines for future work. Child Development, 71, 543–562. https://doi.org/10.1111/1467-8624.00164
Ma, X. (1999). A meta-analysis of the relationship between anxiety toward mathematics and Achievement in mathematics. Journal for Research in Mathematics Education, 30(5), 520–540. https://doi.org/10.2307/749772 Ma, X. (2006). Cognitive and affective changes as determinants for taking advanced mathematics courses in high
school. American Journal of Education, 113, 123-149. https://doi.org/10.1086/506496
Ma, X., & Kishor, N. (1997). Assessing the relationship between attitude toward mathematics and achievement in mathematics: A meta-analysis. Journal for the Research in Mathematics Education, 28, 26–47. https://doi.org/10.2307/749662
Margalit, M. (2003). Resilience model among individuals with learning disabilities: Proximal and distal influences. Learning Disabilities Research & Practice, 18, 82–86. https://doi.org/10.1111/1540-5826.00062
Masten A. S. (2001). Resilience process in development. American Psychologist, 56(3), 227-238. https://doi.org/10.1037/0003-066X.56.3.227
Masten, A. (1994). Resilience in individual development: Successful adaptation despite risk and adversity. In M. C. Wang ve E. W. Gordon (Eds.), Educational resilience in inner-city America: Challenges and Prospects (3-25). Hillsdale, NJ: Lawrence Erlbaum.
Masten, A. S., & Coastworth, J. D. (1998). The development of competence in favorable and unfavorable environments: Lessons from research on successful children. American Psychologist, 53(2), 205-220. https://doi.org/10.1037/0003-066X.53.2.205
engineering in K-12 STEM education. In J. Strobel, S. Purzer, & M. Cardella (Edt.), Rotterdam, the Netherlands: Sense Publishers.
Nunnally, J. C., & Bernstein, I. H. (1994). Psychometric theory (3rd Edition). New York: McGraw-Hill.
Öğülmüş, S., (2001). Bir kişilik özelliği olarak yılmazlık. I. Ulusal Çocuk ve Suç: Nedenler ve Önleme Çalışmaları Sempozyumu, 29-30 Mart, Ankara.
Pajares, F., & Kranzler, J. (1995). Self-efficacy beliefs and general mental ability in mathematical problem-solving. Contemporary Educational Psychology, 20, 426-443. https://doi.org/10.1006/ceps.1995.1029
Papadakis, S., Kalogiannakis, M., & Zaranis, N. (2016). Improving Mathematics Teaching in Kindergarten with Realistic Mathematical Education. Early Childhood Education Journal, 45, 369.
https://doi.org/10.1007/s10643-015-0768-4
Rak, C. F., & Patterson, L. E. (1996). Promoting resilience in at-risk children. Journal of Counseling and Development, 74(1996), 368-373. https://doi.org/10.1002/j.1556-6676.1996.tb01881.x
Read, T. (2013). STEM can lead the way: Rethinking teacher preparation and policy. http://www.cslnet.org/wp-content/uploads/2013/07/STEMCanLeadTheWayReport.pdf, Erişim Tarihi: 15 Eylül2017
Reynolds, J. M. (2003). The Role of Mathematics Anxiety in Mathematical Motivation: A Path Analysis of the Cane Model. Unpublished Doctoral Dissertation. The College of Education at the University of Central Florida Orlando, Florida.
Richardson, F., & Suinn, R. (1972). The Mathematics Anxiety Rating Scale: Psychonometric data. Journal of Counseling Psychology, 19(6), 551-554. https://doi.org/10.1037/h0033456
Rivera, H., & Waxman, H. (2011). Resilient and nonresilient Hispanic English language learners’ attitudes towards their classroom learning environment in mathematics. Journal for Education for Students Placed at Risk, 16, 185–200. https://doi.org/10.1080/10824669.2011.585100
Rounds, J. B., & Hendel, D. D. (1980). Measurement and dimensionality of mathematics anxiety. Journal of Counseling Psychology, 27, 138-149. https://doi.org/10.1037/0022-0167.27.2.138
Schunk, D. H. (1989). Self-efficacy and achievement behaviors. Educational Psychology Review, 1, 173-208. https://doi.org/10.1007/BF01320134
Şimşek, Ö. F. (2007). Yapısal eşitlik modellemesine giriş: Temel ilkeler ve Lisrel uygulamaları, Ankara: Ekinoks. Tabachnick, B. G., & Fidell, L. S. (2013). Using multivariate statistics. Boston: Pearson.
Taşğın, E., & Çetin, F. Ç. (2006). Ergenlerde major depresyon: Risk etkenleri, koruyucu etkenler ve dayanıklılık. Çocuk ve Ergen Ruh Sağlığı Dergisi, 13(2), 87-94.
Terzi, Ş. (2006). Kendini toparlama gücü ölçeğinin uyarlanması: Geçerlik ve güvenirlik çalışmaları. Türk Psikolojik Danışma ve Rehberlik Dergisi, 3(26), 77-86.
Tobias, S. (1991). Going Beyond Math Anxiety. College Teaching, 39, 91-93. https://doi.org/10.1080/87567555.1991.10532434
Wagnild, G. M., & Young, H. M. (1993). Development and psychometric validation of the Resilience Scale. Journal of Nursing Measurement, 1, 165–178.
Yeager, D., & Dweck, C. (2012). Mindsets that promote resilience: When students believe that personal characteristics can be developed. Educational Psychologist, 47, 302–314. https://doi.org/10.1080/00461520.2012.722805
Yıldırım, B. (2013). Amerika, AB Ülkeleri ve Türkiye’de STEM Eğitimi, in 22rd National Congress of Educational Sciences. Ulusal Eğitim Bilimleri Kurultayı Osmangazi Üniversitesi.
Copyrights
Copyright for this article is retained by the author(s), with first publication rights granted to the journal.
This is an open-access article distributed under the terms and conditions of the Creative Commons Attribution license which permits unrestricted use, distribution, and reproduction in any medium, provided the original work is properly cited.