Contents lists available atScienceDirect
Fuel
journal homepage:www.elsevier.com/locate/fuel
Full Length Article
The e
ffects of Fe
2
O
3
based DOC and SCR catalyst on the exhaust emissions of
diesel engines
Ibrahim Aslan Resitoglu
a,⁎, Kemal Altinisik
b, Ali Keskin
c, Kasim Ocakoglu
daDepartment of Automotive Technology, Mersin University, Technical Sciences Vocational School, TR-33343 Mersin, Turkey bDepartment of Mechanical Engineering, Selcuk University, Engineering Faculty, TR-42030 Konya, Turkey
cDepartment of Automotive Engineering, Cukurova University, Engineering and Architecture Faculty, TR-01330 Adana, Turkey dDepartment of Energy Systems Engineering, Faculty of Technology, Tarsus University, 33400 Tarsus, Turkey
A R T I C L E I N F O Keywords: Hematite Diesel engine Pollutant emissions DOC SCR A B S T R A C T
The effects of Fe2O3based DOCs (Diesel Oxidation Catalyst) and SCR (Selective Catalytic Reduction) catalysts on
the exhaust emissions of diesel engine were investigated in this experimental study. The investigated catalysts, Al2O3– TiO2/CeO2/Fe2O3(ATCF) and Al2O3– Nb2O5/CeO2/Fe2O3(ANCF), were produced with impregnation
method and aged for 6 h at 600 °C. FE-SEM (Field Emission Scanning Electron Microscopy), XRD (X-Ray Diffraction), XRF (X-Ray Fluorescence) and BET (Brunauer-Emmett-Teller) Surface Area analyzes were carried out to determine the specifications of catalysts. The catalytic performances of the DOCs were tested for the oxidation of CO, HC, PM, NO while SCR catalysts were tested for SCR of NOxusing NH3. An individual exhaust
system was built up and mounted to the engine for tests of catalysts. An electronic control system and a software were developed to control the SCR system. After the completion of experimental setup, catalysts placed inside the exhaust system were subjected to the engine tests to determine their effects on the exhaust emissions. Tests were carried out under actual working conditions with a single cylinder direct injection diesel engine. In con-clusion, the catalysts made significant decrease in pollutant emissions while brake specific fuel consumption (BSFC) increased slightly. ANCF released better conversion efficiency in all pollutant emissions compared to the ATCF. Maximum decreases in CO, HC and NOxemissions, which are resulted from ANCF catalyst, were obtained
at a rate of 83.51%, 80.83% and 80.29% respectively.
1. Introduction
Serious environmental and health problems that caused by air pol-lution have become a common problem not only in developing coun-tries but also around the world[1]. Pollution emissions such as CO, HC, NOx and PM in vehicles used in the transport industry have contributed significantly to the air pollution, and governments have focused on the need to reduce these pollutants[2,3]. Compression ignition (CI) engines have a greater contribution to the air pollution, especially for NOxand
PM emissions, due to their widespread use compared to spark-ignition (SI) engines.[4–6]. Pollutants from CI engines caused air pollution are carcinogenic to humans [7,8]. Many technologies (exhaust gas re-circulation, electronic controlled fuel injection, crankcase ventilation, etc.) have been developed to control the pollutant emissions from CI engines. However, these technologies could not reduce the pollutant emissions to the values determined by the standards such as Euro, Tier, Japan etc.[2]. It is possible to meet the strict emission limits with the
exhaust aftertreatment systems (EAS)[9]. The use of EAS in vehicles reduces pollutant emissions completely or at a high rate. The most of EAS used in diesel engines are Diesel Oxidation Catalysts (DOC), Diesel Particulate Filter (DPF) and Selective Catalytic Reduction (SCR)[3]. Each system can be used alone, or combined to increase conversion efficiency of pollutant emissions[10,11].
The DOC is used to remove CO and HC emissions at a high rate, shortly after the exhaust manifold (Eqs. (1.1) and (1.2)) [12,13]. In addition, the DOC transforms the NO in NO2forms to enhance the
ef-ficiency of the DPF and SCR system (Eq.(1.3))[11].
+ → CO 1/2O2 CO2 (1.1) + → + C H3 6 9/2O2 3 CO2 3H O2 (1.2) + → NO 1/2 O2 NO2 (1.3)
Exhaust gas temperature is very important factor in DOC conversion efficiency. The oxidations of HC and CO need a temperature called
https://doi.org/10.1016/j.fuel.2019.116501
Received 24 July 2019; Received in revised form 1 October 2019; Accepted 23 October 2019
⁎Corresponding author.
E-mail address:[email protected](I.A. Resitoglu).
Available online 06 November 2019
0016-2361/ © 2019 Elsevier Ltd. All rights reserved.
“light off temperature”. This temperature depends on the exhaust gas and catalyst type. Platinum (Pt) has conventionally been the preferred catalyst recently for DOC while Palladium (Pd) and Rhodium (Rh) have been used as alternative catalysts to Pt[3]. However, these materials are in the precious metal group and cause an increase in the cost of catalyst.
The DPF is used as afilter to eliminate PM emissions in exhaust gas. The DPF is generally made of Silicon Carbide (SiC) [12]. To ensure filtration, each cell is blocked regularly at the end. This blocked cell does not allow the exhaustflow and direct it into porous substrate wall to be gone out from DPF byfiltering PM emissions. However the porous substrate wall becomes plugged in the long run. To avoid this situation, DPF must be regenerated at certain time intervals. Particles in the cell are burned at the high temperatures with active or passive regeneration [3].
The NOxformation in the exhaust gas can be removed by a
re-ductant in the SCR system[6]. While, different reductants have been reported such as alcohol, hydrocarbons, hydrogen, etc.; Ammonia (NH3) showed better performance as a reductant in SCR [14,15]. To
prevent NH3from burning at the high exhaust temperatures, ammonia
is obtained from urea solution in vehicular applications[16]. The re-actions occurred in the SCR systems are given in Eqs.(1.4)–(1.8) [17].
→ + (NH ) CO2 2 NH3 HNCO (thermolysis) (1.4) + → + HNCO H O2 NH3 CO (hydrolysis)2 (1.5) + + → + 4NO 4NH3 O2 4 N2 6 H O2 (1.6) + + → + 2NO 2NO2 4NH3 4N2 6H O2 (1.7) + → + 6NO2 8NH3 7N2 12H O2 (1.8)
As soon as the urea solution is sprayed over the exhaust gas, ther-molysis and hydrolysis reaction occur to release NH3.[15,18]. After
thermolysis and hydrolysis, the reactions of NOxwith urea can occurs in
three different ways (Eqs.(1.6)–(1.8)) according the state of NO:NO2
rate. The reaction at the Eq.(1.7), between the reactions, has the most conversion efficiency due to high conversion rate [18]. The most
common type of SCR catalyst used in mobile applications is V2O5-WO3/
TiO2 structures because of its high thermal stability and conversion
efficiency[6,18,19]. However, the toxicity of vanadium-based catalyst may be detrimental for environment and human health[19].
In this experimental study, hematite, found as widely in nature and had a high catalyst effect in addition of its low cost was investigated as an alternative base material in DOC and SCR catalyst. Titanium, cerium, and niobium complex were added in the catalyst solution to increase the activation. Catalysts were tested under actual working conditions with a single cylinder direct injection diesel engine. The effect of Hematite-based catalysts on not only pollution emissions but also on BSFC, excessive air factor (λ), O2, CO2and exhaust gas
tem-perature was investigated experimentally.
2. Material and methods
2.1. Preparation of the catalysts
Theflow diagram of catalyst production is illustrated inFig. 1. Two different catalysts as Al2O3 – TiO2/CeO2/Fe2O3 (ATCF) and Al2O3–
Nb2O5/CeO2/Fe2O3(ANCF) were produced by impregnation method.
The cordierite (2Al2O3-5SiO2-2MgO) monolith, which constitutes the
main structure, was obtained commercially as Ø103x55 mm and 400 cpsi with square mesh. The hematite (Fe2O3) sol-gel was prepared
ac-cording to the previously published method[20]. To achieve two dif-ferent coating solutions of catalysts,first the hematite (Fe2O3) solution
was prepared and the additive catalyst was doped in hematite solution. Fe(NO3)3x9H2O (Merck) and CH3(CH2)7CH = CH(CH2)7COOH (oleic
acid) were used to obtain hematite structure. Cerium (III) acetate hy-drate and Titanium (IV) oxide (Alfa Aesar) were separately diffused at a rate of 3% in hematite solution to create the first (ATCF) solution. Niobium (V) chloride (Aldrich) as a rate of 3% of hematite solution and Cerium (III) acetate hydrate as twice as Niobium (V) chloride were mixed and doped in the hematite solution to form second (ANCF) so-lution. The main cordierite structures were doped into the solutions. After impregnation, each sample was dried in the drying furnace at Nomenclature
A Cordierite (2Al2O3-5SiO2-2MgO)
Al2O3 Aluminum Oxide
ANCF Al2O3– Nb2O5/CeO2/Fe2O3
ATCF Al2O3– TiO2/CeO2/Fe2O3
BET Brunauer-Emmett-Teller BP Brake Power (kW)
BSFC Brake Specific Fuel Consumption (g/kWh) C3H6 Propene
CaO Calcium Oxide CeO2 Cerium Dioxide
CI Compression Ignition CO Carbon Monoxide CO2 Carbon Dioxide
DOC Diesel Oxidation Catalyst DPF Diesel Particulate Filter EAS Exhaust Aftertreatment Systems ER Engine Results without Catalyst
Fe Iron
FE-SEM Field Emission Scanning Electron Microscopy Fe2O3 Iron (III) Oxide (Hematite)
H2O Water
HC Hydrocarbon
HNCO Isocyanic Acid K2O Potassium Oxide
MgO Magnesium Oxide
NaO Sodium Monoxide Nb2O5 Niobium Pentoxide (NH2)2CO Urea NH3 Ammonia NO Nitrogen Oxide NO2 Nitrogen Dioxide NO3 Nitrate NOx Nitrogen Oxides O2 Oxygen P2O5 Phosphorus Pentoxide Pd Palladium PM Particulate Matter Pt Platinum Rh Rhodium
SCR Selective Catalytic Reduction SI Spark Ignition
SiC Silicon Carbide SiO2 Silicon Dioxide
SO3 Sulphur Trioxide
TiO2 Titanium Dioxide
ULSD Ultra Low Sulphur Diesel V2O5 Vanadyum Pentoksit
WO3 Tungsten Trioksit
XRD X-Ray Diffraction XRF X-Ray Fluorescence λ Excessive Air Factor
120 °C for 12 h and sintered at 600 °C for 6 h. Finally, two pieces of ATCF and ANCF were produced and tested as DOC and SCR catalyst. Catalysts in smaller thickness were also produced to determine catalyst specifications.
2.2. Analysis of the catalysts
FE-SEM (Field Emission-Scanning Electron Microscope), XRD (X-ray diffraction), XRF (X-ray fluorescence) and BET (Brauner – Emmett – Teller) analyzes were carried out to determine the pore structure, mi-croanalysis and crystal structure, chemical structure and the surface area of catalysts, respectively. The model of FE-SEM, BET, XRD and XRF devices were Zeiss/Supra 55, Quantachrome Nova-e, LECO/CHNS – 932, Rigaku-Smartlab, X-ray powder diffractometer and Rigaku- ZSX Primus II WD-XRF, respectively. Catalysts were pulverized by milling for BET, XRD and XRF analyzes. In addition, pellet of each sample was prepared for XRF analyzes. 10 g of powder samples and 4 g of cellulose were mixed in a pot. The prepared mixtures were pressed at 36 MPa to form pellets. The resulting pellets were analyzed after standing at 100 °C for 12 h in the oven.
2.3. Control of the SCR systems
The amount of NOx in exhaust gas and the exhaust gas velocity are two major factors to determine the urea solution sprayed on exhaust gas. Furthermore, exhaust gas temperature is considered to prevent urea decomposition in catalyst at low exhaust temperature and the self-ignition of NH3at high exhaust temperature.
In experimental set-up, an electronic control system was developed to control the spraying of urea solution according to the exhaust velo-city and NOxamount. The total of intake air and fuel formed the
ex-haust gas flow rate.Fig. 2shows block diagram of electronic control developed for the SCR system.
Continental UniNOx sensor, P-CAN USB, power supply, control
chart, connection sockets, Pt-200 temperature sensor were used to provide electronic control of SCR. The communication between NOx
sensor, microprocessor and pump was realized with CAN J1939 pro-tocol, while serial communication was provided with the temperature
sensors. The urea solution was pumped from the urea tank to the nozzle and then injected into the gas pipe before the SCR catalyst.
2.4. Experimental setup
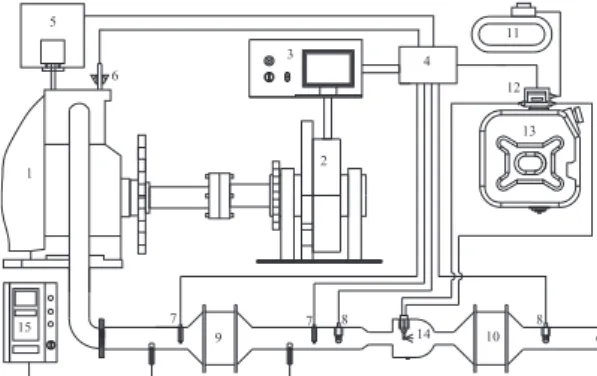
The drawing of experimental setup is given inFig. 3. A single cy-linder, four stroke, water cooled, direct injection Kirloskar TV1 diesel engine with a displacement of 661 cm3, a compression ratio 18/1,
1500 rpm maximum speed and 5 kW maximum power was used in the tests. The load was established on the engine by an eddy current dy-namometer. A transmitter was used before intake manifold to de-termine the intake airflow rate. The urea pump and injector operated as pneumatic were mounted to a compressor having 6–8 bar compressed air. A Bosch BEA-350 exhaust gas analyzer was used to measure the upstream and downstream DOC of CO, HC, PM, CO2, O2 and NO.
Table 1shows the specifications of the emission gas analyzer. The tests were performed to determine the effect of DOC and SCR catalyst on the exhaust emissions. Also BSFC andλ of engine were analyzed in tests. Each of ATCF and ANCF catalyst was tested as DOC and SCR catalyst. Before the measurements, the test engine was run for 15 min to reach active temperature of both the engine and DOC. The catalysts were tested at constant engine speed (1500 d/d) with 3 Nm range between 6 and 24 Nm and 0.47 kW range between 0.94 and 3.77 kW to see the effect of catalysts on the exhaust gas. The relation between engine power output and torque is presented inFig. 4. Ultra Low Sulphur Diesel (ULSD) was used in tests to prevent sulphur poi-soning. The properties of diesel fuel used in test and EN590 standard for diesel fuel are given inTable 2. It is shown in Table that all specifica-tions of diesel fuel are appropriate for EN590 standards.
2.5. Exhaust gas content of diesel engine with and without catalysts This section gives the content of emissions in exhaust gas with and without catalyst. The exhaust gas content of non-catalyst engine is named as “ER”. CO, HC, CO2, O2, exhaust gas temperature, smoke
emission, NO and NOxvalues of exhaust gas with catalysts and without
catalyst are presented inFig. 5.
Compared to the ER values, the use of catalyst led to an increase in CO values at the engine output (pre-catalyst). This is because the use of catalyst increases fuel consumption and enriches the mixture. HC emissions pre-ANCF increased slightly at low torques (6–12 Nm), and decreased at high torques while HC emissions pre-ATCF showed a de-crease trend in all torques compared to ER values. This situation can be explained with the low HC conversion efficiency of ANCF at low tor-ques in theFig. 9. CO2emission and O2content in exhaust gas showed
converse effect with the use of catalyst. The CO2emissions increased,
while O2 content decreased compared to ER values. A significant
Fig. 1. Flow diagram of catalysts production.
change was not obtained in exhaust temperature and Smoke emissions differed from ER values especially at high torques. NO and NOx
emis-sions showed an increasing trend in general compared to ER values.
3. Results and discussion 3.1. The properties of catalysts
The morphology of the prepared catalysts was determined by the Field emission-scanning electron microscopy (FE-SEM). The FE-SEM images of catalysts are given in the scale of 10μm and 1 μm inFig. 6. FE-SEM images generally showed the organizations in catalysts as
nano-sized. As seen in the images catalyst’s surface has a porous structure on a scale of 10μm. Homogenous coating was realized inside the pores on a scale of 1μm. It is observed that the pores were com-pletely covered. This showed that a good ground was prepared for the catalyst works.
The XRD graph of catalysts is given inFig. 7. XRD results support the FE-SEM analysis results. According to the calculations, the crystal-lite size of the samples is around 40 nm for intensity peak (1 0 0) at 2θ ≅ 10,4°. The cordierite substrate, called the graphite A, was used as template. The XRD results show that the crystallite structure of the samples is the cordierite and it has hexagonal structure with the space group of P6/mcc (1 9 2). The XRD peaks shifted to a lower angle for the ATCF and ANCF samples under the influence TiO2, CeO2and Nb2O5
and also, the peak intensity was increased by doping of TiO2/CeO2/
Fe2O3and Nb2O5/CeO2/Fe2O3, respectively. Thus, we can report that
Nb2O5is more effective than TiO2in increasing the crystallite structure.
The BET surface area of catalysts and the results of XRF analysis performed to determine the element ratio in the catalyst are given in Table 3. In results, Al2O3and SiO2had biggest ratio since these
struc-tures constituted the main form of catalysts. The CeO2 ratios in the
ATCF and ANCF catalyst were measured as 0.045% and 0.174% re-spectively. ANCF had Nb2O5complex at a rate of 0.086%. The total
coating elements except for the main structural elements were 3.469% and 2.068% for ATCF and ANCF catalysts, respectively.
BET surface areas of the ATCF and ANCF catalysts were quantified as 44.649 m2/g and 50.104 m2/g respectively. Compared to the main
structure (A), the BET surface areas of the ATCF and ANCF catalysts were considerably reduced due to penetrating of catalyst materials in pores and sintering of catalyst structures.
3.2. BSFC andλ results
Catalysts adapted to the exhaust pipe led to increase in BSFC (Fig. 8). Besides ATCF and ANCF catalyst, BSFC values of a blank cor-dierite monolith (A) was added in Figure. The insertion of a blank cordierite monolith raised increase of BSCF up to 15.51%. The average BSFC increase was 13.60%, 6.30% and 5.12% for A, ATCF and ANCF catalyst, respectively. The reason for the increase in the BSFC can be explained by the backpressure produced by limiting the exhaust gas passage. Compared to ATCF and ANCF, the high BSFC of A resulted from absence of catalyst and catalytic activity.
λ tended to decrease with the use of catalysts. The maximum re-duction inλ was achieved as 10.81% in the ATCF catalyst at 18 Nm. While the engineλ value was 1.4 at maximum engine torque, the use of ATCF and ANCF catalyst led the λ to decrease to 1.3 and 1.38, re-spectively. In all tests performed, the increase in engine torque caused the decrease inλ. The increase in engine torque led to the enrichment of air/fuel mixture and the decrease ofλ. Considering all engine tor-ques, the usage of ATF and APF catalysts led to the average reduction of 5.91% and 4.77%, compared to the ER.
λ depends on air/fuel ratio taken into the cylinder. The decrease in air/fuel ratio means that the enrichment of mixture decreases theλ, otherwise the increase in air/fuel ratio leads to increaseλ. Therefore, the increase of BSFC with the use of catalysts, caused to decrease in air/ fuel ratio andλ.
Fig. 3. A schematic representation of the experimental setup (1-Engine, 2-Dynamometer, 3-Control panel, 4-SCR control unit, 5-Fuel gauge, 6-Airflow meter, 7-Temperature sensor, 8-NOx sensor, 9-DOC, 10-SCR catalyst,
11-Compressor, 12-Pump, 13-Urea tank, 14-Injector, 15-Emission analyzer).
Table 1
Specifications of the Bosch BEA-350 exhaust gas analyzer.
Variables Measurement range Resolution
CO 0–10% 0.001% CO2 0–18% 0.01% HC 0–9999 ppm 1 ppm O2 0–22% 0.01% λ 0.5–9.999 0.001 NO 0–5000 ppm 1 ppm PM 0–10 m−1 0.01 m−1
Fig. 4. The relation between engine power output and torque.
Table 2
The properties of diesel fuel.
Fuel/Specifications Density at 15 °C (kg/m3) Calorific value (MJ/kg) Cetane number Viscosity kinematic at 40 °C (mm2/s) Flash Point (oC)
Diesel 841.53 45.27 53.67 2.71 63
3.3. Engine exhaust emission results
The conversion efficiency of CO and HC emissions is given inFig. 9. In general, ANCF showed better performance in CO and HC conversion compared to ATCF. The maximum conversion efficiency was obtained with the ANCF catalyst as 80.83% in HC conversion and 83.51% in CO conversion. ANCF catalyst led to a significant decrease in HC value with the reduction from 120 ppm to 23 ppm at 24 Nm. In low engine torque (6 and 9 Nm), the HC conversion efficiency of the ATCF was slightly higher than the ANCFs. The CO and HC conversions were averagely
46.03% and 55.92%, respectively, with the ATCF while 58.64% and 62.96% with the ANCF catalyst. The oxidation of CO and HC was in-creased in proportion to the increase in engine torque, which means that the exhaust temperature increases. The conversion efficiency of DOC depends largely on the temperature level of the DOC[12].
Increasing rate of CO2and reduction rate of O2 are presented in
Fig. 10. HC and CO molecules react with oxygen and consequently these reactions consist of CO2in DOC (Eqs.(1.1) and (1.2)). Hereby the O2
content in exhaust gas decreased while CO2increased after the DOC.
The increase rate of CO2and decrease rate of O2were changed to the
CO and HC conversion rate. Therefore, maximum CO2increase rates
and O2decrease rates of catalysts were obtained at the maximum
en-gine torque in which maximum HC and CO conversions were occurred. However, at low engine loads, since the exhaust gas temperature is low, the change in O2and CO2content of exhaust gas were slight.
Fig. 11displays the effect of catalyst on the exhaust gas temperature and smoke conversion efficiency. There was a linear relationship be-tween the engine torque and amount of the temperature increase. The oxidation of CO and HC caused an increase in the exhaust gas tem-peratures. Compared to the ATCF, the temperature increase of ANCF was higher since its high CO and HC conversion. At the maximum en-gine torque in which maximum conversion rate was occurred, increase in temperature of exhaust gas were obtained as 34.25 °C for ATCF and 49.35 °C for ANCF.
However, DOC is widely used to reduce CO and HC emissions, it may also have an effect to eliminate smoke emissions[13,15]. DOC led
Fig. 6. FE-SEM images of the catalysts a) ATCF (10μm), b) ATCF (1 μm) c) ANCF (10 μm) and d) ANCF (1 μm).
Fig. 7. XRD graph of A, ATCF and ANCF samples.
Table 3
BET surface area values and XRF analysis results.
A ATCF ANCF
BET Surface Area (m2/g) 114.230 44.649 50.104
Elements NaO 0.146 0.163 0.160 MgO 13.800 13.200 14.300 Al2O3 34.100 32.900 33.900 SiO2 50.300 48.500 48.100 P2O5 0.036 0.032 0.029 SO3 0.052 0.034 0.022 K2O 0.189 0.179 0.154 CaO 0.321 0.217 0.201 TiO2 0.249 0.445 0.204 Fe2O3 0.442 3.670 2.250 Nb2O5 – – 0.086 CeO2 – 0.045 0.174 WO3 0.312 0.585 0.429
to the decrease in smoke emissions. The maximum decrease was ob-tained with ANCF as 46.61% at 24 Nm. ATCF resulted in a 37.84% decrease in this torque.
Conversion of NO to NO2form improves DPF and SCR activity. DPF
efficiency is raised since NO2has more effective in converting PM than
oxygen. When the amount of NO2in NOxincreases, the SCR reactions
occur at a higher rate[13]. At the maximum engine torque, ATCF and ANCF catalysts raised the NO conversion to 62.24% and 76.08%
respectively. ANCF performed better than ATCF in NO conversion. At 24 Nm, 334 ppm conversion in NO emission was occurred with ANFC catalyst.
The use of ATCF and ANCF as a SCR catalyst significantly decreased NOxemissions (Fig. 12). The maximum decrease in NOxemissions was
obtained at the maximum engine torque, being 60.80% for ATCF and 80.29 for ANCF. The minimum NOx emission obtained after ANCF
catalyst was measured as 147 ppm with a reduction of 600 ppm at 24
Fig. 8. The effect of catalysts on BSFC and λ.
Fig. 9. The effect of catalysts on CO and HC emissions.
Fig. 10. The effect of catalysts on CO2emission and O2content.
Nm. Compared to the ATCF catalyst, higher NO conversion rates of the ANCF catalyst provided better activity in NOxconversion. Considering
all the engine torques, ATCF catalyst led to 40.75% conversion rate while ANCF converted a little more, averagely 53.45% of NOx
emis-sions. The conversion rate increased in direct proportion to the increase of engine torque. Since the chemical reactions are kinetically limited at lower temperatures, lower conversion efficiencies were obtained at low engine torques[18].
4. Conclusion
In this study, we focused on the preparation of hematite-based catalysts by impregnation method and their effects on exhaust emis-sions as DOC and SCR catalyst. Based on the analyzes of catalysts and engine tests, the following conclusions were obtained:
•
The pores of substrate were completely covered and a good ground was prepared for the catalyst works.•
The crystallite structure of the catalyst was a cordierite and had hexagonal structure with the space group of P6/mcc (1 9 2).•
Nb2O5was more effective than TiO2in increasing crystallitestruc-ture.
•
The CeO2rates in the ATCF and ANCF catalyst were 0.045% and0.174% respectively. ANCF had Nb2O5complex at a rate of 0.086%.
•
The penetrating of catalyst materials in pores and sintering of cat-alyst structures led to the decrease in surface area of ANCF and ATCF compared to the main structure.•
The use of DOCs and SCR catalysts caused conversion of CO, HC, smoke and NOxup to 83.51%, 80.83%, 46.61% and 80.29%,re-spectively.
•
Because of oxidation reactions in DOC, O2concentration in exhaustgas decreased while CO2emissions increased.
•
Catalyst use caused a slight increase in the BSFC of the engine and somewhat reductions in theλ values were observed.Declaration of Competing Interest
The authors declare that they have no known competingfinancial interests or personal relationships that could have appeared to influ-ence the work reported in this paper.
References
[1] Pietikainen M, Valiheikki A, Oravisjarvi K, Kolli T, Huuhtanen M, Niemi S, et al. Renewable Energy 2015;77:377–85.
[2] Guo J, Ge Y, Hao L, Tan J, Li J, Feng X. Atmos Environ 2014;99:1–9. [3] ResitogluİA, Altinisik K, Keskin A. Clean Techn Environ Policy 2015;17:15–27. [4] Carslaw DC, Beevers SD, Tate JE, Westmoreland EJ, Williams ML. Atmos Environ
2011;45:7053–63.
[5] Ma Y, Zhu M, Zhang D. Appl Energy 2013;102:556–62.
[6] Shan W, Liu F, He H, Shi X, Zhang C. Catal Today 2012;184:160–5. [7] Kumar P, Pirjola L, Ketzel M, Harrison RM. Atmos Environ 2013;67:252–77. [8] Garcia-Perez J, Fernandez-Navarro P, Castello A, Lopez-Cima MF, Ramis R, Boldo E,
et al. Environ Int 2013;51:31–44.
[9] Lopez JM, Jimenez F, Aparicio F, Flores N. Transp Res Part D 2009;14:1–5. [10] Stepanek J, Koci P, Plat F, Marek M, Kubicek M. Comput Chem Eng
2010;34:744–52.
[11] Hauff K, Tuttlies U, Eigenberger G, Nieken U. Appl Catal B 2012;123–124:107–16. [12] Zheng M, Banerjee S. Appl Therm Eng 2009;29:3021–35.
[13] Zhu L, Cheung CS, Zhang WG, Fang JH, Huang Z. Fuel 2013;113:690–6. [14] Hamada H, Haneda M. Appl Catal A 2012;421–422:1–13.
[15] Vallinayagam R, Vedharaj S, Yang WM, Saravanan CG, Lee PS, Chua KJE, et al. Atmos Environ 2013;80:190–7.
[16] Baleta J, Vujanovic M, Pachler K, Duic N. J Cleaner Prod 2015;88:280–8. [17] Can F, Courtois X, Berland S, Seneque M, Royer S, Duprez D. Catal Today
2015;257:41–50.
[18] Rauch D, Albrecht G, Kubinski D, Moos R. Appl Catal B 2015;165:36–42. [19] Pang L, Fan C, Shao L, Yi J, Cai X, Wang J, et al. Chin J Catal 2014;35:2020–8. [20] Ocakoglu K, Krupnik T, van den Bosch B, Harputlu E, Gullo MP, Olmos JDJ, et al.
Adv. Funct. Mater. 2014;24:7467–77.