RESEARCH
Rational diagnoses of diabetes: the
comparison of 1,5-anhydroglucitol with other
glycemic markers
Umit Yavuz Malkan
1*, Gursel Gunes
1and Ahmet Corakci
2Abstract
Diabetes mellitus (DM) is a frequently encountered disease with important morbidity and mortality. The aim of this study is to document the importance of 1,5-anhydroglucitol (1,5-AG) for the diagnosis of prediabetes and DM, as well as to compare the 1,5-AG with other glycemic markers in order to understand which one is the better diagnostic tool. Between April 2012 and December 2012, 128 participants enrolled in the study. Participants were split into five groups that are IFG, IGT, IFG+IGT, diabetic and control groups by their OGTT results. The diagnostic value of markers was compared by ROC (receiver operating characteristic) method. The mean serum 1,5-AG levels in the diabetic group (33.38 nmol/ml) were lower than, IFG (59.83 nmol/ml), IGT (54.44 nmol/ml), IFG+IGT (51.98 nmol/ml) and control groups (73.24 nmol/ml). When analyzed in the total study population serum 1,5-AG levels did not differ by gender sig-nificantly. When analyzed in the total study population, 1,5-AG correlates inversely with age significantly (p = 0.036). In subgroup analysis, in the control group, serum 1,5-AG level was also inversely correlated with age (p = 0.087). The best marker for the diagnosis of prediabetes and DM was fasting plasma glucose (FPG). 1,5-AG was not found to be effective for the diagnosis of DM. This study, contributes to our knowledge of the efficiency and cut-off values of 1,5-AG for the diagnosis of prediabetes and DM. In future, there is a need for larger studies with more standardized and commonly used measurement methods for 1,5-AG, in order to evaluate the efficiency of 1,5-AG for the diagnosis of prediabetes and DM.
Keywords: 1,5-Anhydroglucitol, Glycated hemoglobin, Fructosamine, Prediabetes, Diabetes mellitus, Diagnosis
© 2015 Malkan et al. This article is distributed under the terms of the Creative Commons Attribution 4.0 International License (http://creativecommons.org/licenses/by/4.0/), which permits unrestricted use, distribution, and reproduction in any medium, provided you give appropriate credit to the original author(s) and the source, provide a link to the Creative Commons license, and indicate if changes were made.
Background
Diabetes mellitus (DM) is a syndrome which insulin function or secretion or both impaired (Arrellano-Valdez et al. 2014). Prediabetes is the state between the normal blood glucose level and DM. The mechanism of predia-betes is insulin resistance and pancreatic beta cell dis-function (Pour and Dagogo-Jack 2011). Prediabetes is a risk for DM and cardiovascular disease (Twigg et al.
2007). Prediabetes has two basic types. One of them is IFG (impaired fasting glucose) and the other is IGT (glu-cose intolerance). In present fasting glu(glu-cose, randomly plasma glucose with DM symptoms and 75 g OGTT
is widely used for the diagnosis of DM. In 2009, ADA (American Diabetes Association) stated that HbA1c (glycated hemoglobin) could be used for DM diagno-sis (International Expert Committee 2009). Glycated hemoglobin shows the average plasma glucose levels for the past 2–3 months. It is an advantage that fasting is not required for measurement of the glycated hemo-globin (McCance et al. 1994). Some authors suggests the use of the glycated hemoglobin in DM diagnosis (Kim et al. 2011; Saudek and Brick 2009), whereas the other do not agree this idea because of the low sensitivity lev-els of glycated hemoglobin (Selvin et al. 2009; Malkani and Mordes 2011). Fructosamine is created by the non-enzymatic glicolization of serum proteins such as albu-mine. Fructosamine shows the average plasma glucose of past 1–3 weeks. Glycated hemoglobin is more widely used for to measure plasma glucose levels; however
Open Access
*Correspondence: [email protected]
1 Department of Internal Medicine, School of Medicine, Ufuk University,
Ankara, Turkey
fructosamine is superior to glycated hemoglobin in some conditions like hemoglobinopathy which glycated hemoglobin could be mistaken (Armbruster 1987; Koch
1996). HOMA-IR is actually used for to detect the insu-lin resistance (Yang et al. 2013). In some conditions that glycated hemoglobin can be wrong, that other indicators such as 1,5-anhydroglucitol (1,5-AG) is suggested to be used. 1,5-AG is a monosaccaride that exists in food. It is filtrated through kidneys and absorbed by renal tubules. The glucose afinity of proximale tubules is higher than the afinity to 1,5-AG. Because of this reason in the hyper-glisemic state when glycosuria occurs, the reabsorption of 1,5-AG decreases and it is excreted by urine. So, the levels of plasma 1,5-AG decreases when the blood glu-cose level increases (Homa and Majkowska 2010; Stickle and Turk 1997). 1,5-AG shows the glucose levels of past 10–14 days (Stettle et al. 2008). In some studies 1,5-AG suggested as an indicator of blood glucose levels (Umeda et al. 1991). There are also some studies that suggest 1,5-AG can be used as a tool for DM diagnosis (Shah et al.
2009; Frattali and Wolf 1994)
Aim
The aim of this study is to document the importance of 1,5-AG in the diagnosis of prediabetes and DM and com-pare 1,5-AG with glycated hemoglobin, fructosamine, fasting glucose and HOMA-IR in order to understand which one is the better diagnostic tool.
Methods
The study is carried out in Ufuk University Dr.Rıdvan Ege Hospital in the city of Ankara, Turkey. Between April 2012 and December 2012, 128 patients who were performed 75 g OGTT, involved in study. The patients were joined the study from policlinics of internal medi-cine and endocrinology. The criteria to join the study were being 25 year old or older and having indication for OGTT. The exclusion criteria were, pregnancy, kidney disease (creatine levels 3 mg/dl or higher), liver disease, malabsorption syndromes, usage of steroids, polygala, tenuifolia, senega, alpha-glucosidase inhibitors, anemia, DM diagnosis before, usage of antidiabetic drugs and history of gastrectomy. This study is a cross-sectional analysis of an observational study. Ufuk University ethical board approval has been received. All participants gave informed consent. All of the ethical considerations have been strictly followed in accordance with the Helsinki declaration. All of the measurements were performed within a few days after the indication for OGTT. Par-ticipants who agreed to attend study gave blood samples between hours 08.00–09.00 after minimum 10 h of fast-ing. 75 g OGTT was performed and the patients were divided into 5 groups according to OGTT World Health
Organization (WHO) criteria which were IFG, IGT, IFG+IGT, DM and control groups. From fasting glucose samples Glycated hemoglobin, fructosamine, total cho-lesterol, LDL, HDL, trigliseride, BUN, creatinine, CBC, AST, ALT, albumine, total protein, sedimentation, fast-ing insulin, fastfast-ing c-peptide levels were detected. Blood samples from each patient taken for 1,5-AG levels had stored at −83 cantigrat degree for the analysis day with ELISA method. Each patients arterial blood pressure were measured and demographic data were recorded. Waist circumference measurement executed from half of distance between inferior costa and spina iliaca ante-rior supeante-rior. Body mass index and HOMA-IR (fasting plasma glucose (FPG) (mg/dl) × fasting plasma insulin (μ/ml)/405) were calculated for each participant. The pancreas B cell function were calculated with the for-mula of 360 × fasting plasma insulin (μ/ml)/FPG (mg/ dl) −63 %. The analysis of blood samples were performed at Ufuk University Dr. Rıdvan Ege Hospital Biochemis-try Department Laboratuary. Glycated hemoglobin was measured with “Agilent 1100 Series” with “High Pressure Likid Chromatography” method whereas fructosamine was measured with “Cobas Integra 400 Plus” with spec-trophotometric method. BUN, creatinine, HDL, LDL, trigliseride, total cholesterol, albumine, total proteine blood samples were detected with “Cobas Integra 800” with spectrophotometric method. The analysis of plasma samples for glucose levels were executed with hexoci-nase method by “Cobas Integra 800”. 1,5-AG is measured with “Cusabio Human 1,5-anhydroglucitol ELISA Kit” by “DSX Automated Elisa System” machine.
Statistical analyses
Statistical analyzis executed with “IBM SPSS Statistics 20” programme. Firstly the distribution type of data ana-lyzed. Data which showed normal distribution patern analyzed with ANOVA or T Test methods and results were presented as mean ± standard deviation. The dual comparison of the data which showed normal distrubu-tion, TUKEY method was used. Data which did not show normal pattern were analyzed with Cruscal-Wallis or Mann–Whitney U methode and results were presented as mean and 95 % confidence interval. Dual comparison of data which do not showed normal pattern executed with “Bonferroni corrected Mann–Whitney U” methode. Spearman corelation analyzes performed to investigate serum 1,5-AG and other variables. In the comparison of the power of the diagnostic tools, ROC (Receiver Oper-ating Characteristics) curve is used. Threshold level of the diagnostic tools determined as the point in the ROC curve which is closest to sensitivity value 100 % and false positive value 0 %. HOMA-IR calculated as “FPG (mg/dl) × fasting insulin (μU/ml)/405” and HOMA-B
calculated as “360 x fasting insulin (μU/ml)/(FPG (mg/ dl)-63)”. Statistical significance point set to p < 0.05.
Results
Between April 2012 and December 2012, 128 participants who applied to endocrinology or internal medicine clin-ics of Ufuk University Dr. Rıdvan Ege Hospital, enrolled in this study. All participants had indication for 75 g OGTT and gave informed consent. Mean age of partici-pants were 53.0 ± 12.2. 48 participant (37.5 %) were male, 80 participant (62.5 %) were female. IFG, IGT, IFG+IGT groups together evaluated as “prediabetic group”. Con-trol group has the most participant with 38 people. Mean age of participants was highest in diabetic group. Distri-bution of participant according to gender was not sig-nificantly different between groups. Data of participants were described in Table 1. We investigated the 1,5-AG levels of participants in control, prediabetes, DM groups. 1,5-AG levels of prediabetic group was higher than dia-betic group (p = 0.039). Also, 1,5-AG levels were higher in control group than prediabetic group (p = 0.064). We examined fructosamine and glycated hemoglobin levels in control, prediabetic and diabetic groups. Mean plasma glycated hemoglobin levels were higher in prediabetes group than control group (p < 0.001). Also, plasma gly-cated hemoglobin levels in DM group were higher than prediabetes group (p < 0.001). Mean serum fructosa-mine levels were higher in prediabetes group than con-trol group (p = 0.013). Also, mean serum fructosamine levels were higher in DM group than prediabetes group (p = 0.003). We investigated the difference of plasma 1,5-AG levels according to gender. There is no significant difference of blood 1,5-AG levels according to gender (p = 0.813). We investigated the 1,5-AG levels according to age. In the total study population 1,5-AG levels found inversly related to age (p = 0.036). In subgroup analysis, the most significant inverse correlation of 1,5-AG and age found in control group (p = 0.087). When genders were separetely analyzed, in female cases the inverse correla-tion between age and 1,5-AG was significant (p = 0.035), however in male cases this correlation was not significant (p = 0.637). We examined the relationship between 1,5-AG and 2 h plasma glucose levels however we did not find any significant relationship between 1,5-AG and 2 h plasma glucose. Then, we evaluated and compared the FPG, glycated hemoglobin, fructosamine, 1,5-AG and HOMA-IR in diagnosis of prediabetes. Participants who underwent OGTT evaluated according to WHO criteria. 68 cases labelled as prediabetes. Table 2 shows the comparison of FPG, HbAac, fructosamine, 1,5-AG and HOMA-IR as a diagnostic tool in prediabetes. FPG has the largest area under curve. Glycated hemoglobin, fructosamine, HOMA-IR and 1,5-AG follows FPG
respectively. Fructosamine and HOMA-IR had the same area under curve. Optimal threshold value for diagnostic tools in prediabetes diagnosis provides 72.1 % sensitiv-ity, 86.6 % specificity for FPG. The other values listed in Tables 2 and 3. We evaluated and compared the FPG, gly-cated hemoglobin, Fructosamine, 1,5-AG and HOMA-IR for the diagnosis of DM. Participants who underwent OGTT evaluated according to WHO criteria. 22 cases labelled as DM. Table below shows the comparison of FPG, HbAac, fructosamine, 1,5-AG and HOMA-IR as a diagnostic tool in DM. FPG has the largest area under curve. Glycated hemoglobin, fructosamine, HOMA-IR and 1,5-AG follows FPG respectively. Area under curve of 1,5-AG remained below of the reference line (Fig. 1). The other values listed in Tables 2 and 3. We evaluated and compared the FPG, glycated hemoglobin, fructosa-mine, 1,5-AG and HOMA-IR in diagnosis of glucose intolerance (DM+prediabetes). Participants who under-went OGTT evaluated according to WHO criteria. 22 cases labelled as DM and 68 cases labelled as DM. Table 2
shows the comparison of FPG, HbAac, fructosamine, 1,5-AG and HOMA-IR as a diagnostic tool in DM and pre-diabetes. FPG has the largest area under curve. Glycated hemoglobin, fructosamine, HOMA-IR and 1,5-AG fol-lows FPG respectively. The other values listed in Tables 2
and 3.
Discussion
Early diagnosis in prediabetes and DM can reduce the mortality and morbidity of the disease. The reference test for the diagnosis of prediabetes and DM is OGTT according to the WHO recommendations. For screeen-ing of glucose intolerance, 2 h post-OGTT glucose level is used. Fasting condition of the patient is needed for the OGTT and FPG tests. For this reason applica-tion of these methods can be challenging for doctor and patient. Also if the patient is not in fasting condition, it is required to come to hospital for a second time, thus making the situation tiring and expensive. Therefore, alternative diagnostic tools which do not reguire fast-ing condition, may be preferred. Glycated hemoglobin, fructosamine, 1,5-AG are diagnostic tools which do not reguire fasting (Shah et al. 2009). Many studies have investigated the role of the 1,5-AG in DM. In some stud-ies, the efficiency of 1,5-AG found higher than glycated hemoglobin whereas more studies suggests glycated hemoglobin is better because 1,5-AG has wide range of normal distrubution. As a result, the role of 1,5-AG in diagnosis of DM remained uncertain (Robertson et al.
1993; Shirasaya et al. 1999; Yamanouchi et al. 1991; Yamanouchi et al. 2001).
In many reports, it is found that there is a statisti-cally significant inverse relationship between plasma
1,5-AG level and post OGTT second hour plasma glu-cose (Yamanouchi et al. 1988; Goto et al. 2011). However in our study we did not find any relationship between plasma 1,5-AG and post OGTT second hour glucose lev-els. The cause of this can be explained by the relatively low number of participants in our study in comparison to the other studies. There are some studies that investi-gates the role of 1,5-AG in the diagnosis of DM and pre-diabetes. Our study has similarities and differences from these studies. Firstly in our study, the mean plasma 1,5-AG levels were found higher in control group than pre-diabetic group. Also the 1,5-AG levels were found higher in prediabetic group than diabetic group (Shirasaya et al.
1999; Won et al. 2009). In many other studies it is sug-gested that the normal distribution range of 1,5-AG is
so wide that it limits the usage of 1,5-AG in DM screen-ing (Robertson et al. 1993; Yamanouchi et al. 1991; Won et al. 2009). Similarly, 1,5-AG has distributed in a wide range in our study, thus with the additive effect of limited case numbers we did not get statistical significance. The importance of the glisemic markers in diagnosis can be investigated many ways. Selectivity index or ROC curve method can be used (Koch 1996; Shirasaya et al. 1999; Yamanouchi et al. 1991; Goto et al. 2011). We preferred the ROC curve in our study. In a study conducted by Yamanouchi et al. selectivity index was used to investi-gate the most important marker in DM diagnosis. 1,5-AG was found as the best marker, glycated hemoglobin and fructosamine followed it respectively (Yamanouchi et al.
1991). In another study, the most important markers
Table 1 Data of participants
Data which do not show normal pattern analyzed with Cruscal-Wallis or Mann–Whitney U methode and results were shown mean and 95 % confidence interval. Dual comparison of data which do not showed normal pattern executed with “Bonferroni corrected Mann–Whitney U” methode. Near data (×) plot put to indicate which group was significantly different against other group. (1. Groups named with numbers as: Control group 1, IFG group 2, IGT group 3, IFG+IGT group 4, and DM group 5). (2. Fasting insulin value was not significant in any comparison)
* Data which showed normal distribution patern analyzed with ANOVA or T Test methode and results showed as mean ± standard deviation. The dual comparison of the data which showed normal distrubution, TUKEY methode is used
Groups (1) CONTROL (n = 38) (2) IFG (n = 24) (3) IGT (n = 23) (4) IFG + IGT (n = 21) (5) DM (n = 22) p value
Age *(4,5)*50.1 ± 9.0 *(4,5)*48.5 ± 13.2 *(5)*51.6 ± 11.5 *(1,2)*57.4 ± 11.5 *(1,2,3)*60.3 ± 13.4 0.002 Gender (M/F) 14/24 7/17 10/13 8/13 9/13 0.881 Fasting PG (mg/dl) *(2,4,5)*89.2 (87.0–91.4) *(1,3,5)*106.0 (103.7,108.4) *(2,4,5)*91.9 (89.8–94.0) *(1,3,5)*107.0 (104.7–109.4) *(1,2,3,4)*128.2 (108.1–148.3) <0.001 30.min PG (mg/dl) *(2,4,5)*150.2 ± 27.4 *(1,5)*175.1 ± 39.9 *(4,5)*153.7 ± 28.7 *(1,3,5)*183.3 ± 23.2 *(1,2,3,4)*215.9 ± 60.6 <0.001 60.min PG (mg/dl) *(2,3,4,5)*142.9 ± 41.0 *(1,4,5)*182.4 ± 49.5 *(1,5)*185.7 ± 36.1 *(1,2,5)*209.9 ± 29.4 *(1,2,3,4)*275.3 ± 68.0 <0.001 90.min PG (mg/dl) *(3,4,5)*117.3 ± 30.2 *(3,4,5)*140.3 ± 33.5 *(1,2,5)*173.3 ± 36.5 *(1,2,5)*195.9 ± 30.4 *(1,2,3,4)*282.3 ± 87.3 <0.001 120.min PG (mg/dl) *(3,4,5)*100.6 (93.5–107.8) *(3,4,5)*113.9 (105.5–122.3) *(1,2,5)*160.7 (153.3–168.2) *(1,2,5)*169.3 (162.2–176.4) *(1,2,3,4)*261.7 (220.0–303.5) <0.001 HbA1c (%) *(2,4,5)*5.29 ± 0.48 *(1,4,5)*5.79 ± 0.41 *(4,5)*5.63 ± 0.57 *(1,2,3,5)*6.22 ± 0.86 *(1,2,3,4)*6.72 ± 0.99 <0.001 Fructosamine (µmol/l) *(5)*227.2 (221.2– 233.3) 238.0 (228.0–248.0) *(5)*229.6 (219.3–239.9) 248.1 (233.4–262.8) *(1,3)*269.1 (240.9–297.4) <0.001 1,5-Anhydroglucitol (nmol/ml) 73.2 (27.5–118.9) 59.8 (39.4–80.1) 54.4 (32.1–76.7) 51.9 (34.6–69.3) 33.3 (22.2-44.5) 0.189 Total cholesterol (mg/dl) 196.0 ± 37.6 193.2 ± 36.4 199.2 ± 32.0 204.2 ± 29.6 192.0 ± 35.2 0.783 LDL (mg/dl) 123.0 ± 29.8 119.6 ± 32.9 126.7 ± 22.7 128.2 ± 25.4 116.9 ± 31.2 0.664 HDL(mg/dl) 47.1 ± 13.7 50.2 ± 13.5 42.1 ± 13.7 52.1 ± 18.2 44.4 ± 11.6 0.124 Triglyceride (mg/dl) 134.2 (113.3–155.2) 125.3 (100.5–150.1) 175.3 (130.1–220.5) 139.7 (101.2–178.2) 168.7 (125.7–211.8) 0.380 Fasting insulin (µu/ml) 15.00 (9.73–20.27) 16.27 (13.19–19.36) 11.54 (8.92–14.16) 15.51 (12.70–18.33) 14.31 (11.58–17.04) 0.030 Fasting c-peptide (ng/ml) 3.44 (2.92–3.97) 3.80 (3.10–4.51) *(5)*2.98 (2.54–3.42) 3.44 (3.08–3.81) *(3)*3.76 (3.43–4.09) 0.021 HOMA-IR *(2,4,5)*3.37 (2.10–4.63) *(1,3)*4.28 (3.43–5.13) *(2,4,5)*2.63 (2.02–3.25) *(1,3)*4.10 (3.35–4.86) *(1,3)*4.55 (3.47–5.63) <0.001 HOMA β *(5)*208.1 (149.1– 267.2) 136.7 (111.4–162.0) 144.1 (113.4–174.7) 127.9 (104.3–151.6) *(1)*93.1 (73.3–112.9) <0.001 Systolic BP (mmHg) 122.1 (117.4–126.7) 127.0 (115.6–138.5) 124.7 (116.3–133.2) 129.5 (120.1–138.9) 124.0 (117.1–131.0) 0.809 Diastolic BP (mmHg) 78.2 (75.1–81.4) 79.5 (74.0–85.0) 78.6 (73.2–84.1) 80.1 (74.2–86.0) 74.5 (69.8–79.2) 0.598 Mean BP (mmHg) 92.8 ± 10.7 95.4 ± 17.0 94.0 ± 14.4 96.6 ± 14.5 91.0 ± 11.0 0.670 Height (cm) 162.9 ± 7.8 164.8 ± 8.1 164.6 ± 9.5 162.6 ± 7.9 162.0 ± 9.7 0.748 Weight (kg) 74.8 ± 14.7 84.2 ± 17.6 72.4 ± 13.8 78.5 ± 17.0 79.0 ± 16.7 0.099 Body mass index *(2,4,5)*26.2 ± 5.2 *(1,3)*30.9 ± 5.7 *(2,5)*26.6 ± 4.4 *(1)*29.6 ± 6.1 *(1,3)*30.2 ± 7.1 0.004 Waist circumference (cm) 91.0 ± 12.2 97.9 ± 10.6 88.3 ± 10.4 92.8 ± 13.6 94.0 ± 11.9 0.069
found as FPG, 1,5-AG, glycated hemoglobin, and fruc-tosamine respectively (Shirasaya et al. 1999). In a differ-ent study the most important markers in DM screening found as glycated hemoglobin followed by 1,5-AG, FPG and HOMA-IR (Koch 1996). In our study the area under curve of 1,5-AG was lower than reference line so it is not suitable to use it as a marker of diagnosis of DM. In our study the most important marker was found as FPG in diagnosis for prediabetes, DM and glucose intolerance. The FPG is an important diagnostic tool in DM and it should be preferred as first test in screening of prediabe-tes and DM. In our study glycated hemoglobin was found
as best marker for prediabetes and DM diagnosis, which does not require fasting state. Recently, glycated hemo-globin is suggested as a marker of DM which could be used alone because of the improvements in standardi-zation of measurement techniques. Our study supports this issue, as we found Glycated hemoglobin as the sec-ond valuable marker in the DM diagnosis. In our study, 1,5-AG did not found as valuable a diagnostic marker in DM and it was found as the least valuable marker in prediabetes and glucose intolerance. The small number of samples compared to the wide distribution range can be the reason for that finding. In a study, the efficiency of 1,5-AG, glycated hemoglobin and fructosamine in pre-diabetes and DM compared with optimal threshold lev-els (Shirasaya et al. 1999). Optimal threshold levels were decided as the point on the ROC curve which is near-est to 100 % sensitivity and 0 % false positivity. Accord-ing to this, when 104 nmol/ml was taken as threshold for 1,5-AG, 83.8 % sensitivity and 84.6 % specificity val-ues were obtained for type 2 DM diagnosis. When 5.6 % was taken as threshold for glycated hemoglobin, 83.8 % sensitivity and 79.4 % specificity values were obtained for type 2 DM diagnosis. When 256 µmol/l was taken as threshold for fructosamine, 70.3 % sensitivity and 79.9 % specificity values were obtained for type 2 DM diagnosis (Shirasaya et al. 1999). In the same study the thresholds were calculated for type 2 DM+IGT. When 134 nmol/ ml was taken as threshold for 1,5-AG, 62.7 % sensitivity and 61.0 % specificity values were obtained. When 5.4 %
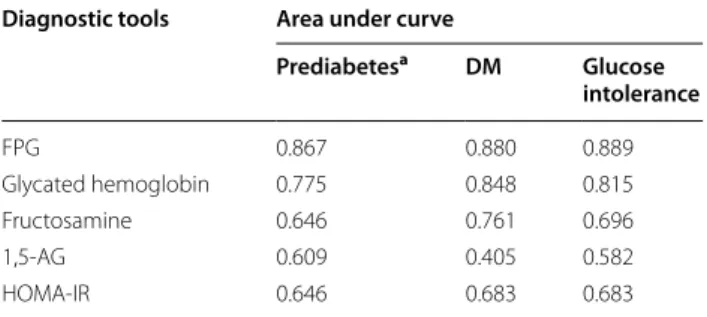
Table 2 Evaluation and comparison of FPG, glycated hemoglobin, fructosamine, 1,5-AG, HOMA-IR in prediabe-tes, DM and glucose intolerance diagnosis
Total study population (128 patients) was analyzed for the evaluation of the markers as a diagnostic tool for DM and glucose intolerance
a DM patients were excluded (106 patients were analyzed) for the evaluation of the markers as a diagnostic tool for Prediabetes
Diagnostic tools Area under curve
Prediabetesa DM Glucose intolerance FPG 0.867 0.880 0.889 Glycated hemoglobin 0.775 0.848 0.815 Fructosamine 0.646 0.761 0.696 1,5-AG 0.609 0.405 0.582 HOMA-IR 0.646 0.683 0.683
Table 3 The comparison of sensitivity and specificity of threshold values of diagnostic tools for prediabetes, DM and glu-cose intolerance diagnosis
Total study population (128 patients) was analyzed for the evaluation of the markers as a diagnostic tool for DM and glucose intolerance a Threshold value for each diagnostic tool calculated as the nearest point of ROC curve that sensitivity 100 %, false positivity is 0 % b DM patients were excluded (106 patients were analyzed) for the evaluation of the markers as a diagnostic tool for Prediabetes
Diagnostic tool Optimal threshold valuea Sensitivity Specificity
Prediabetesb FPG (mg/dl) 96.50 0.721 0.868 Glycated hemoglobin (%) 5.60 0.706 0.816 Fructosamine (µmol/l) 230.50 0.676 0.579 1,5-AG (nmol/ml) 38.79 0.618 0.711 HOMA-IR 3.00 0.618 0.684 DM FPG (mg/dl) 112.50 0.727 0.953 Glycated hemoglobin (%) 5.99 0.864 0.726 Fructosamine (µmol/l) 249.50 0.727 0.755 1,5-AG (nmol/ml) 30.97 0.591 0.443 HOMA-IR 3.21 0.818 0.585 Glucose intolerance FPG (mg/dl) 97.50 0.744 0.947 Glycated hemoglobin (%) 5.60 0.767 0.816 Fructosamine (µmol/l) 233.50 0.656 0.632 1,5-AG (nmol/ml) 33.22 0.633 0.658 HOMA-IR 3.00 0.678 0.684
was taken as threshold for glycated hemoglobin, 53.2 % sensitivity and 68.6 % specificity values were obtained. When 244 µmol/l was taken as threshold for fructosa-mine, 61.2 % sensitivity and 55.4 % specificity values were obtained (Shirasaya et al. 1999). In another study, thresh-olds of 1,5-AG, glycated hemoglobin, fructosamine were calculated by selectivity index (Yamanouchi et al. 1991). When 85.2 nmol/ml was taken as threshold for 1,5-AG, 84.2 % sensitivity and 93.1 % specificity values were obtained for DM diagnosis. When 6.2 % was taken as threshold for glycated hemoglobin, 67.5 % sensitivity and 92.7 % specificity values were obtained for DM diagno-sis (Yamanouchi et al. 1991). In a different study, in type 2 DM screening of insulin resistant subgroup, threshold level for 1,5-AG was taken as 103.56 nmol/ml which gives 96 % sensitivity and 88 % specificity values (Koch 1996). In the total study population, the threshold value of the glycated hemoglobin was taken as 5.7 % which gives 86 % sensitivity and 85 % specificity. In the total study popula-tion, the threshold value of HOMA-IR was taken as 7.9 which give 62 % sensitivity and 70 % specificity. Again in the total study population, the threshold value of FPG was taken as 104 mg/dl which gives 88 % sensitivity and 93 % specificity (Koch 1996). In our study we have inves-tigated markers for prediabetes, DM and glucose intoler-ance diagnosis. After the results, we understand 1,5-AG
is not a suitable marker for the diagnosis of DM. Also, the effectiveness of 1,5-AG was the lowest in the diagno-sis of prediabetes and glucose intolerance. These findings opposed the past studies in literature. There can be sev-eral reasons for this. Firstly, other studies demonstrated in much larger patient cohorts. Secondly, the plasma 1,5-AG has a wide normal distribution range and our patient cohort was relatively small for this wide distribution range. Thirdly, 1,5-AG measurement technic and equip-ments differs between studies. Lastly, all study partici-pants had an indication for OGTT testing which means that the control group was also selected in the basis of diabetes risk, thus explaining the weaker discriminatory results as compared to other studies. In our study all measurements were performed a few days after the indi-cation for OGTT. Therefore we have prevented our study data to be influenced from possible lifestyle changes by participants after hearing the indication for “diabetes testing”. In the literature there are different threshold levels of 1,5-AG for DM diagnosis. These values dif-fer between studies and there is no consensus on these values. Values in our study differ from other studies too. There could be several reasons for this. Firstly, there can be all reasons that are mentioned above (size of patient cohorts, wide distribution range, etc.). Secondly, plasma 1,5-AG levels could differ due to eating habits and race
(Herman et al. 2009; Koga et al. 2010). However there is no study about 1,5-AG for DM diagnosis in our country which we could refer. As a result, there is no consensus on 1,5-AG threshold levels for DM and prediabetes, and our study contributes literature by offering threshold val-ues for 1,5-AG in the diagnosis of DM, prediabetes and glucose intolerance.
To conclude, although there are several studies in the literature about the relationship between 1,5-AG and DM diagnosis; our study is the first study about this issue that is demonstrated in our country. Also, this is first study about in our country that is performed clinically and pro-spectively. In respect to this, our study may represent the threshold values of 1,5-AG in our country that can be referred by other studies that will be conducted future. The limitations of our study was the relatively small patient cohort compared to wide distribution range of 1,5-AG.
Authors’ contributions
All three authors read and approved the final manuscript. All authors have made substantial contributions to acquisition and interpretation of data; have been involved in drafting the manuscript; agree to be accountable for all aspects of the work in ensuring that questions related to the accuracy. All authors read and approved the final manuscript.
Author details
1 Department of Internal Medicine, School of Medicine, Ufuk University,
Ankara, Turkey. 2 Department of Endocrinology, School of Medicine, Ufuk
University, Ankara, Turkey.
Acknowledgements
This work is funded by Bilim Pharmaceuticals. The important contributions in the design of this study by Prof. Dr. Selda Demirtaş (Ufuk University, Medical Biochemistry Department) gratefully recognized by all.
Competing interests
The authors declare that there is no conflict of interests regarding the publica-tion of this paper.
Statement of human and animal rights
All procedures followed were in accordance with the ethical standards of the responsible committee on human experimentation (institutional and national) and with the Helsinki Declaration of 1975, as revised in 2008. Non-interventional clinical trial approval had taken from ethics committee of the Ufuk University.
Statement of informed consent
Informed consent was obtained from all patients for being included in the study.
Received: 25 March 2015 Accepted: 29 September 2015
References
Armbruster DA (1987) Fructosamine: structure, analysis, and clinical usefulness. Clin Chem 33(12):2153–2163
Arrellano-Valdez F, Urrutia-Osorio M, Arroyo C, Soto-Vega E (2014) A com-prehensive review of urologic complications in patients with diabetes. Springerplus 23(3):549
Frattali AL, Wolf BA (1994) 1.5-Anhydroglucitol: a novel serum marker for screening and monitoring diabetes mellitus? Clin Chem 40(11):1991–1993
Goto M, Yamamoto-Honda R, Shimbo T, Goto A, Terauchi Y, Kanazawa Y, Noda M (2011) Correlation between baseline serum 1,5-anhydroglucitol levels and 2-hour post-challenge glucose levels during oral glucose tolerance tests. Endocr J 58(1):13–17
Herman WH, Dungan KM, Wolffenbuttel BHR, Buse JB, Fahrbach JL, Jiang H, Martin S (2009) Racial and ethnic differences in mean plasma glucose, hemoglobin A1c, and 1,5-anhydroglucitol in over 2000 patients with type 2 diabetes. J Clin Endocrinol Metab 94(5):1689–1694
Homa K, Majkowska L (2010) Difficulties in interpreting glycated hemoglobin results. Polskie archiwummedycyny wewnetrznej 120(4):148–154 International Expert Committee (2009) International Expert Committee report
on the role of the A1C assay in the diagnosis of diabetes. Diabetes Care 32:1327–1334
Kim HJ, Choi EY, Park EW, Cheong YS, Lee HY, Kim JH (2011) The utility of glycated hemoglobin as a diagnostic criterion of diabetes. Korean J Fam Med 32:383–389
Koch B (1996) Glucose monitoring as a guide to diabetes management. Criti-cal subject review. Can Fam Physician 42(1142–6):1149–1152
Koga M, Murai J, Saito Hi, Mukai M, Kasayama S (2010) Habitual intake of dairy products influences serum 1,5-anhydroglucitol levels independently of plasma glucose. Diabetes Res Clin Pract 90:122–125
Malkani S, Mordes JP (2011) The implications of using Hemoglobin A1C for diagnosing diabetes mellitus. Am J Med 124(5):395–401
McCance DR, Hanson RL, Charles MA, Jacobsson LT, Pettitt DJ, Bennett PH et al (1994) Comparison of tests for glycated haemoglobin and fasting and two hour plasma glucose concentrations as diagnostic methods for diabetes. BMJ 308:1323–1328
Pour OR, Dagogo-Jack S (2011) Prediabetes as a therapeutic target. Clin Chem 57(2):215–220
Robertson DA, Alberti KG, Dowse GK, Zimmer P, Tuomilehto J, Gareeboo H (1993) Is serum anhydroglucitol an alternative to the oral glucose tolerance test for diabetes screening? The mauritius noncommunicable diseases study group. Diabet Med 10(1):56–60
Saudek CD, Brick JC (2009) The clinical use of hemoglobin A1c. J Diabetes Sci Technol 3(4):629–634
Selvin E, Zhu H, Brancati FL (2009) Elevated A1C in adults without a history of diabetes in the U.S. Diabetes Care 32:828–833
Shah S, Kublaoui BM, Oden JD, White PC (2009) Screening for type 2 diabetes in obese youth. Pediatrics 124:573
Shirasaya K, Miyakawa M, Yoshida K, Takahashi E, Shimada N, Kondo T (1999) Economic evaluation of alternative indicators for screening for diabetes mellitus. Prev Med 29:79–86
Stettle C, Stahl M, Allemann S, Diem P, Schmidlin K, Zwahlen M, Riesen W, Keller U, Christ E (2008) Association of 1,5-anhydroglucitol and 2-h postprandial blood glucose in type 2 diabetic patients. Diabetes Care 31:1534–1535
Stickle D, Turk J (1997) A kinetic mass balance model for 1,5-anhydroglucitol: applications to monitoring of glycemic control. Am J Physiol Endocrinol Metab 273:E821–E830
Twigg SM et al (2007) Prediabetes: a position statement from the australian diabetes society and australian diabetes educators association. MJA 186:461–465
Umeda F, Yamauchi T, Ishii H, Nakashima N, Hisatomi A, Nawata H (1991) Serum 1,5-anhydro-D-glucitol and glycemic control in patients with non-insulin-dependent diabetes mellitus. Tohoku J Exp Med 163:93–100 Won JC, Park CY, Park HS, Kim JH, Choi ES, Rhee EJ, Lee WY, Oh KW, Kim SW,
Park SW (2009) 1,5-Anhydroglucitol reflects postprandiyal hyperg-lisemia and a decreased insulinogenic index, even in subjects with prediabetes and well-controlled type 2 diabetes. Diabetes Res Clin Prac 84:51–57
Yamanouchi T, Akanuma H, Nakamura T, Akaoka I, Akanuma Y (1988) Reduc-tion of plazma 1,5-anhydroglucitol (1-deoxyglucose) concentraReduc-tion in diabetic patients. Diabetologia 31:41–45
Yamanouchi T, Akanuma Y, Toyota T, Kuzuya T, Kawai T, Kawazu S et al (1991) Comparison of 1,5-anhydroglucitol, Glycated hemoglobin and fructosa-mine for detection of diabetes mellitus. Diabetes 40:52–57
Yamanouchi T, Inoue T, Ogata E, Kashiwabara A, Ogata N, Sekino N, Yoshimura T, Ichiyanagi K, Kawasaki T (2001) Post-load glucose measurements in oral glucose tolerance tests correlate well with 1,5-anhydroglucitol, an indicator of overall glycaemic state, in subjects with impaired glucose tolerance. Clin Sci (Lond) 101:227–233
Yang Y, Wei RB, Xing Y, Tang L, Zheng XY, Wang ZC, Gao YW, Li MX, Chen XM (2013) A meta-analysis of the effect of angiotensin receptor blockers and calcium channel blockers on blood pressure, glycemia and the HOMA-IR index in non-diabetic patients. Metabolism 62(12):1858–1866