DETECTION OF EMPTY HAZELNUTS FROM FULLY DEVELOPED NUTS BY
IMPACT ACOUSTICS
Ibrahim Onaran
2, Berkan Dulek
2, Tom C. Pearson
1Yasemin Yardimci, A. Enis Cetin
2USDA-ARS Manhattan, Kansas, U.S.A.
1Bilkent University, Ankara, Turkey
2METU, Ankara, Turkey
3ABSTRACT
Shell-kernel weight ratio is the main determinate of quality and price of hazelnuts. Empty hazelnuts and nuts containing undeveloped kernels may also contain mycotoxin producing molds, which can cause cancer. A prototype system was set up to detect empty hazelnuts by dropping them onto a steel plate and processing the acoustic signal generated when kernels impact the plate. The acoustic signal was processed by five different methods: 1) modeling of the signal in the time domain, 2) computing time domain signal variances in short time windows, 3) analysis of the frequency spectra magnitudes, 4) maximum amplitude values in short time windows, and 5) line spectral frequencies (LSFs). Support Vector Machines (SVMs) were used to select a subset of features and perform classification. 98% of fully developed kernels and 97% of empty kernels were correctly classified.
1. INTRODUCTION
Hazelnuts are widely used in chocolate and flavored coffee production. The ratio of kernel weight to shell weight of bulk hazelnuts determines the price that a farmer receives from food processing plants. Empty hazelnuts and hazelnuts containing undeveloped kernels negatively affect this ratio. Occasionally, a physiological disorder such as plant stress from dehydration or lack of nutrients allow a hazelnuts shell to develop without a kernel. Also, a physical disorder such as insect damage can stunt the maturation process and prevent a kernel from being fully developed at harvest time. As shown in Figure 1, a nut with undeveloped kernel appears like a normal hazelnut. Currently, a farmer’s hazelnut lot is processed by an “airleg” which is a mechanical device having a fan to separate empty hazelnuts from fully developed ones. However, these devices have a high classification error rate. Upon delivery of hazelnuts to a processor, the ratio of kernel weight to shell weight is determined by sampling a few kilos of hazelnuts from the lot and the price is determined from this calculation. There remains a need for an additional machine to improve upon the segregation of empty and full hazelnuts.
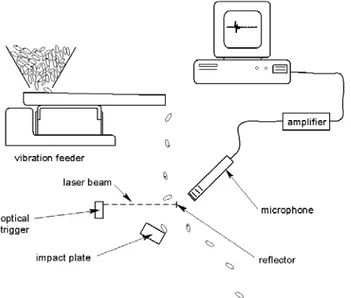
A prototype system was set up to detect empty hazelnuts by dropping them onto a steel plate and processing the acoustic signal generated when kernels impact the plate. The schematic diagram of the system is shown in Figure 2. It is possible to process 40 nuts per second by the proposed system, which can be used in practice to estimate the ratio of kernel weight to shell weight by processing large sums of hazelnuts, and to further classify the nuts processed by the mechanical separation device. If
the ratio of kernel weight to gross weight is less than 0.5 then some buyers reject the produce.
Therefore, it may be important for some farmers to increase the kernel weight to shell weight ratio by accurately classifying its produce. Alternatively, hazelnuts classified as empty can be further processed to find misclassified fully developed hazelnuts. In addition, empty hazelnuts and hazelnuts containing undeveloped kernels may also contain a certain mold which produces aflatoxin, a cancer causing material. Therefore a more accurate classification of hazelnuts will be useful in practice.
Figure 1: Samples from Empty and Full Hazelnuts In order to find fully developed hazelnuts among the misclassified ones, one can weigh them one by one or shell them but, obviously, this is not an economically viable practice. It is proposed that fully developed hazelnuts can be discriminated from empty hazelnuts by means of impact acoustic emissions. A high-throughput, low cost acoustical system for sorting pistachio nuts has been developed to separate pistachio nuts with closed shells from those with cracked shells [5-7]. In this system, pistachio nuts are dropped onto a steel plate and the sound of the impact is analyzed in real time. Pistachio nuts with closed shells produce a different sound than those with cracked shells, as expected. Classification accuracy of this system is approximately 96%, with a throughput rate of approximately 40 nuts/second and it works reliably in a food processing environment with little maintenance or skill required to operate. A similar prototype system for hazelnuts is proposed in this paper. The cost of the overall system will be very low because of its simple mechanical components and the signal processing can be carried out in an ordinary PC or a microprocessor based system with a 44 kHz sound sampling capability.
2. MATERIALS AND METHODS
In this paper, “Levant” type hazelnuts from Akcakoca, Duzce region of Turkey is used in our experiments
Experimental apparatus: A schematic of the experimental apparatus for simulating hazelnuts, dropping them onto the impact plate, then collecting the acoustic emissions from the impact are shown in Figure 2. The impact plate was a polished block of stainless steel with dimensions 7.5 x 15 cm and depth of 2 cm. The mass of the impact plate is much larger than the hazelnuts in order to minimize vibrations from the plate interfering with acoustic emissions from kernels.
A microphone, which is sensitive to frequencies up to 20 kHz, was used to capture the impact sounds.
Figure 2: Schematic of experimental apparatus for collecting acoustic emissions from hazelnuts
2.1 Signal processing: Feature parameters were extracted from the recorded sound signal of the impact. Subsequently, classification was performed using Support Vector Machines (SVM) using the features. Features were extracted from the impact sound signal by three different methods: 1) modeling of the signal in the time domain, 2) computing time domain signal variances in short time windows, 3) analysis of the frequency spectra magnitudes, 4) maximum amplitude values in short time windows, and 5) line spectral frequencies (LSFs). Each of these methods will be discussed separately below.
Time Domain Signal Modeling:Typical signals from a regular hazelnut and an empty hazelnut are shown in Figure 3. The maximum amplitude of the signals is quite variable but in general the maximum amplitude of regular hazelnuts is higher than the empty ones. To characterize this type of signal response, we modeled the signal after transforming it in the following steps outlined below: (i) rectify the signal by taking the absolute value at all points, (ii) non-linearly filter the signal by replacing the center data point with the maximum value in a seven point window, and (iii) Non-linearly estimate the four parameters of the Weibull function, given by Equation 1,
which has a shape similar to that of the processed time domain signal
( )
(
)
( ) ( ) 1 0 , for b o b t t a o t t cb Y t e t t a a − ⎡ − ⎤ − ⎢ ⎥ ⎢ ⎥ ⎣ ⎦ ⎧ ⎫ ⎡ − ⎤ ⎪ ⎪ = ⎢ ⎥ ⎨ ⎬ > ⎣ ⎦ ⎪⎩ ⎪⎭(1) otherwise Y(t) = 0. -0.5 0 0.5 0 1 2 3 4 -0.5 0 0.5 Milliseconds
Figure 3: Typical impact sound signals from a regular hazelnut (top) and an empty hazelnut (bottom). Note that the maximum amplitude of a regular hazelnut is usually higher than an empty hazelnut.
Short Time Variance Window Processing: In addition to the time domain processing by modeling the signals with a Weibull function, variances of the signals are also computed in short time windows. Weibull function captures the shape of the recorded signal globally and the short-time variance information models the local time domain variations in the signal. The short time windows were 50 points in duration and incremented in steps of 30 points so that each window overlapped by 20 points. The first window began 40 points in front of the maximum signal magnitude. A total of eight short time windows were computed to cover the entire duration of all signals. After all variances were computed, they were normalized by the sum of all eight variances as follows
2 2 8 2 1 i ni i i
σ
σ
σ
= =∑
(2)where and are the normalized and computed variances from window i with i=1 being the first window and i=8 being the last. This method captures the increased duration of the signals from empty hazelnuts. As can be seen from Figure 4, the average variance of the third window is greater than that from full hazelnuts. Additionally, the slope between the third and fourth variance is different. 2 ni σ σi2 1 2 3 4 5 6 7 8 0 100 200 300 400 500 600
Short Time Windows
A ver age V ar iances Empty Hazelnut Regular Hazelnut
Figure 4: Average variances from short time windows of time domain signals.
Frequency Domain Processing: A 256 point discrete
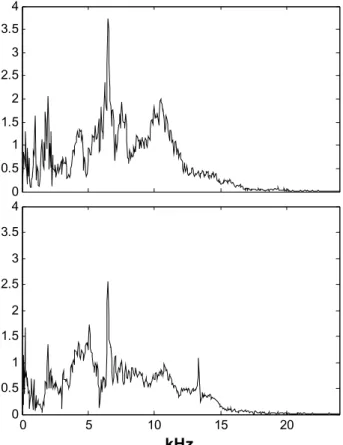
Fourier Transform (DFT) was computed from each signal using a Hamming window. The 256-point window covers the impact sound of hazelnut and it starts about 80 data points before the signal maximum slope, which corresponds to the impact moment of the kernel. The magnitude of each spectrum was computed and then low pass filtered using a 20 tap FIR filter applied to remove jagged spikes in the spectra. The low pass filter has a cutoff frequency of π/4 in the normalized DFT domain. As can be seen in Figure 5, the frequency spectrum of empty kernels has a single peak between 5 and 10 kHz. On the other hand regular hazelnuts have two major peaks in the same frequency range. In this example, peaks of the spectra of regular hazelnuts and empty nuts are clearly distinguishable but there are significant numbers of examples in which twin peaks of regular hazelnuts are not clearly visible, possibly due to noise. The frequency corresponding to the peak magnitude in the frequency spectra was saved as a potential discriminating feature. In addition, the 15 magnitude values before the peak and 15 points after the peak were saved and normalized by the peak magnitude.
Maximum Magnitude in Short Time Window Processing: 5 maximum values in 5 windows are used.
First window starts from 10 samples before the maximum magnitude of the signal. Each window has length of 15 samples. They were separated by 10 samples so that 5 samples are overlapped for each window.
0 5 10 15 20 0 0.5 1 1.5 2 2.5 3 3.5 4 kHz 0 0.5 1 1.5 2 2.5 3 3.5 4
Figure 5: Example frequency spectra magnitudes for a regular (top) and empty hazelnuts (bottom).
Line Spectral Frequency: Linear predictive modeling techniques are widely used in various speech coding, synthesis and recognition applications. Linear Minimum Mean Square Error (LMMSE) prediction based data analysis is equivalent to Auto-Regressive (AR) modeling of the data. Line Spectral Frequency (LSF) representation of the Linear Prediction (LP) filter is introduced by Itakura [9].
Let the m-th order inverse filter Am(z),
( )
-m m -mz
a
z
a
z
A
=
+
1+
…
+
11
(3)be obtained by LP analysis of the impact sound. The LSF polynomials of order m + 1, Pm+1(z) and Qm+1(z) can be
constructed by setting the (m + 1)-st reflection coefficient to 1 or -1. In other words, the polynomials, Pm+1(z) and
Qm+1(z)are defined as
( )
( )
( 1)( )
1 1 − + − +z
=
A
z
+
z
A
z
P
m m m m (4) and( )
( )
( 1)( )
1 1 − + − +z
=
A
z
−
z
A
z
Q
m m m m (5)The zeros of Pm+1(z) and Qm+1(z) are called the Line
Spectral Frequencies (LSFs), and they uniquely characterize the LPC inverse filter Am(z).
3. CLASSIFICATION AND RESULTS
All experiments are conducted using a total of 492 impact sounds of 254 full and 238 empty hazelnuts as shown in Table 1. Test and train sets are constructed by randomly dividing each group into two halves. Support
Vector Machines (SVMs) are used to classify the features which are obtained from impact sounds of hazelnuts.
Empty Full Overall
Total Number of Sounds 238 254 492 Number of Train Sounds 119 127 246
Table 1: Train and Test Sets
The impact sounds of hazelnuts are analyzed in both time and frequency domain, as described in Section 2.1. Classification of hazelnuts summarized in Tables 2-7 is obtained. In Table 2 classification results based on spectrum magnitude features are presented. In this case maximum magnitude value of each spectrum, 15 coefficients before and after the maximum value are used as feature vector of the hazelnut impact sound. This vector leads to 87% recognition accuracy.
Empty Full Overall
Ratio: Success/Test 106/119 108/127 214/246 Percentage: Success 89.08 85.04 86.99
Table 2: Spectrum Magnitudes Feature Results Classification results obtained using Weibull parameters alone are tabulated in Table 3. In this case Weibull parameters a, b, c, t0 and R2 (the coefficient of multiple determination for curve fitting) are used as features of the hazelnut impact sound.
Empty Full Overall
Ratio: Success/Test 89/119 109/127 198/246 Percentage: Success 74.79 85.83 80.49
Table 3: Weibull Parameters Feature Results The method based on spectrum magnitude features classified empty hazelnuts more accurately than full hazelnuts. On the other hand, the method based on Weibull coefficients distinguished full hazelnuts more accurately than empty hazelnuts. It is clear that spectral features or time domain envelope by itself is not sufficient for accurate classification.
In Table 4 classification results based on eight short-time variances are presented. In this case, short short-time windows contain 50 samples in duration and incremented in steps of 30 time units so that each window overlapped by 20 samples. The first window began 40 points before the maximum signal magnitude. A total of eight short time windows were computed to cover the entire duration of all signals. Comparing with the previous results, window variance computation gives an increased performance in terms of accuracy in both full and empty sets.
Empty Full Overall
Ratio: Success/Test 117/119 118/127 235/246 Percentage: Success 98.32 92.91 95.53
Table 4: Short-Time Variances Feature Results In Table 5 classification results based on the maximum magnitude in time domain are presented. In this case, 5 maximum values in 5 windows are used. First window starts from 10 samples before the maximum magnitude of the signal. Each window has length 15 samples length. They were separated by 10 samples so that 5 samples overlap for each window.
Empty Full Overall
Ratio: Success/Test 99/119 94/127 193/246 Percentage: Success 83.19% 74.02% 78.46%
Table 5: Time Domain Maximum Magnitude Feature Results
If 20th order Line Spectral Frequencies (LSFs) is used then an overall recognition rate of 90% is achieved.
All five classes of features discussed so far are combined in a single vector. We arrived at the following improved accuracy while reducing the success rate difference between two types that appeared in the previous tables. 97% of fully developed kernels and 98% of empty kernels are correctly classified.
Empty Full Overall
Ratio: Success/Test 116/119 124/127 240/246 Percentage: Success 97.48% 97.64% 97.56%
Table 6: Combined Spectrum Magnitudes, Weibull Parameters, Short-Time Variances Features Results
4. CONCLUSION
In this paper, an effective and low-cost classification system to distinguish full and empty hazelnuts is proposed. Five methods are presented to extract features of hazelnut impact sounds. These features allow us to classify the empty and full hazelnut by using Support Vector Machines (SVMs) based classifier with a simple system which can be implemented in real-time.
5. REFERENCES
[1] Pederson, J. 1992. Insects: Identification, damage, and detection. In Storage of Cereal Grains, ed. D. B. Sauer. St. Paul, Minn.: American Association of Cereal Chemists.
[2] Haff, R. P. 2001. X-ray inspection of wheat for granary weevils. PhD diss. Davis, Calif.: University of California, Davis. [3] Dowell, F. E., J. E. Throne, and J. E. Baker. 1998. Automated nondestructive detection of internal insect infestation of wheat kernels by using near-infrared reflectance spectroscopy. J. of Economic Entomology 91(4): 899-904. [4] Pearson, T.C., et.al 2003. Automated detection of internal insect infestations in whole wheat kernels using a Perten SKCS 4100. Applied Engineering in Agriculture. 19(6):727-733 [5] Pearson, T.C. 2001. Detection of pistachio nuts with closed shells using impact acoustics. Applied Engineering in
Agriculture, 17(2):249-253.
[6] Cetin, A.E., T.C. Pearson, A. H. Tewfik, “Classification of closed- and open-shell pistachio nuts using voice-recognition technology,” Transactions of the ASAE, 47(2), 659-664, 2004. [7] Cetin, A.E., T.C. Pearson, A. H. Tewfik. 2004. Classification of closed- and open-shell pistachio nuts using impact acoustical analysis, presented in ICASSP 2004.
[8] Huberty, C. J. 1994. Applied Discriminant Analysis. New York: John Wiley and Sons, Inc.
[9] F. Itakura, ”Line spectrum representation of linear predictive coefficients of speech signals”, J. Acoust. Soc. Amer., 1975, p. 535a