MULTI EXCITON GENERATION AND
RECOMBINATION OF SEMICONDUCTOR
NANOCRYSTALS: FUNDAMENTAL
UNDERSTANDING AND APPLICATIONS
A THESIS
SUBMITTED TO THE DEPARTMENT OF ELECTRICAL AND ELECTRONICS ENGINEERING
AND THE GRADUATE SCHOOL OF ENGINEERING AND SCIENCE OF BILKENT UNIVERSITY
IN PARTIAL FULFILLMENT OF THE REQUIREMENTS FOR THE DEGREE OF
MASTER OF SCIENCE
By
Ahmet Fatih Cihan
July 2013
ii
I certify that I have read this thesis and that in my opinion it is fully adequate, in scope and in quality, as a thesis for the degree of Master of Science.
Assoc. Prof. Dr. Hilmi Volkan Demir (Supervisor)
I certify that I have read this thesis and that in my opinion it is fully adequate, in scope and in quality, as a thesis for the degree of Master of Science.
Prof. Dr. Ayhan Altıntaş
I certify that I have read this thesis and that in my opinion it is fully adequate, in scope and in quality, as a thesis for the degree of Master of Science.
Assoc. Prof. Dr. Mehmet Bayındır
Approved for Graduate School of Engineering and Science:
Prof. Dr. Levent Onural
iii
ABSTRACT
MULTI EXCITON GENERATION AND
RECOMBINATION OF SEMICONDUCTOR
NANOCRYSTALS: FUNDAMENTAL
UNDERSTANDING AND APPLICATIONS
Ahmet Fatih Cihan
M.S. in Electrical and Electronics Engineering Supervisor: Assoc. Prof. Dr. Hilmi Volkan Demir
July 2013
Semiconductor nanocrystal quantum dots (QDs) have been found to be very promising for important application areas in optoelectronics and photonics. Their energy band-gap tunability, high performance band-edge emission, decent temperature stabilities, and easy material processing make the QDs attractive for these applications ranging from photovoltaic devices to photodetectors and lasers to light-emitting diodes. For these QDs, the concepts of multi exciton generation (MEG) and recombination (MER) have recently been shown to be important especially because they possibly enable efficiency levels exceeding unity using these QDs in various device configurations. However, understanding multi exciton kinetics in QD solids has been hindered by the confusion of MER with the recombination of carriers in charged QDs. This understanding lacks to date and the spectral-temporal aspects of MER still remain unresolved in solid QD ensembles. In this thesis, we reveal the spectral-temporal behavior of biexcitons (BXs) in the presence of photocharging using near-unity quantum yield core/shell CdSe/CdS QDs. The spectral behavior of BXs and that of excitons (Xs) were obtained for the QD samples with different core sizes, exhibiting the strength-tunability of the X-X interaction energy in these QDs. The extraction of spectrally resolved X, BX, and trion kinetics, which would be spectrally unresolved using conventional approaches, is enabled by our approach introducing the integrated time-resolved fluorescence. Besides the fundamental
iv
understanding of MEG and MER concepts, we also explored the possibility of utilizing multi excitons in these QDs for optical gain. In this part of the thesis, tunable, high performance, two-photon absorption (TPA) based amplified spontaneous emission (ASE) from the same QDs is presented. Here, for the first time, in addition to the absolute spectral tuning of the ASE, on the single material system of CdSe/CdS, the relative spectral tuning of ASE peak with respect to spontaneous emission was demonstrated. With the core and shell size adjustments, it was shown that Coulombic X-X interactions can be tuned to be either attractive leading to the red-shifted ASE peak or repulsive leading to the blue-shifted ASE peak and that non-shifting ASE can be achieved with the right core-shell combinations. It was further found here that it is possible to obtain ASE at a specific wavelength from both Type-I-like and Type-II-like CdSe/CdS QDs. In addition to the CdSe/CdS QDs, we showed ASE and Type-tunability features on CdSe/CdS nanorods (NRs), which are particularly promising with their extremely high TPA cross-sections and independent emission/absorption tunabilities. In the final part of the thesis, we report the observation of MEG on CdHgTe QDs, for the first time in the literature, and a novel application of MEG concept in a photosensor device, one of the first examples of real-life photosensing application of MEG concept. We believe that the results provided in this thesis do not only contribute to the fundamental understanding of MEG and MER concepts in the QDs, but also pave the way for the utilization of these concepts in the QD-based lasers, photodetectors and photovoltaic devices.
Keywords: Nanocrystals, quantum dots, excitonics, multi exciton generation,
multi exciton recombination, amplified spontaneous emission, photosensors, lasers.
v
ÖZET
YARIİLETKEN NANOKRİSTALLERDE ÇOKLU
EKSİTON OLUŞTURMASI VE YENİDEN BİRLEŞİMİ:
TEMEL BİLİMSEL ANLAMA VE UYGULAMALAR
Ahmet Fatih Cihan
Elektrik ve Elektronik Mühendisliği Bölümü Yüksek Lisans Tez Yöneticisi: Doç. Dr. Hilmi Volkan Demir
Temmuz 2013
Yarı iletken nanokristal kuvantum noktacıklarının (QD) optoelektronik ve fotonik alanlarındaki önemli uygulamalar için gelecek vaad eden malzeme sistemleri oldukları gösterilmiştir. Enerji bant aralığı ayarlanabilirliği, yüksek performanslı bant kenarı ışıması, uygun sıcaklık istikrarı ve kolay malzeme işlenebilirliği özellikleri QD’leri fotovoltaikten fotodetektörlere, lazerlerden ışık yayan diyotlara kadar birçok alanda cazip kılmaktadır. Yine yakın zamanda, bu QD’lerin bazı aygıt konfigürasyonları ile % 100 olan verimlilik sınırını aşabilme olasılığı sebebiyle, QD’lerde çoklu eksiton oluşturması (MEG) ve yeniden birleşimi (MER) konularının önemli olduğu gösterildi. Ancak QD katılarında çoklu eksiton kinetiklerinin anlaşılması MER ile yüklenmiş QD’lerdeki yeniden birleşme olayının karıştırılması sebebiyle zorlaşmış ve MER’nin spektral ve zamana bağlı özellikleri QD katılarında henüz tam çözümlenememiştir. Bu tezde, % 100’e yakın kuvantum verimliliğine sahip CdSe/CdS QD’lerde çift-eksitonların (BX) ve tek-çift-eksitonların (X) spektral davranışlarını foto-yüklenme olayının varlığında açıklığa kavuşturduk. BX’lerin ve X’lerin spektral davranışlarını farklı çekirdek büyüklüğüne sahip QD örneklerinde elde ettik ve bu gözlemlerimiz QD’lerdeki X-X etkileşim enerjisinin şiddetinin ayarlanabilirliği özelliğini açığa çıkardı. Mevcut metotlarla mümkün olamayacak olan bu X, BX ve triyon yapılarının spektral olarak ayırt edilmesini,
vi
entegre zamanda-çözümlenmiş floresans kavramını ortaya atarak başardık. MEG ve MER kavramlarının temel anlama konusuna ek olarak, çoklu eksitonların QD’lerde optik kazanım çalışmalarında yararlanılması konusunu da inceledik. Tezin bu kısmında, aynı QD’lerde spektral olarak ayarlanabilir, yüksek başarımlı, 2-foton soğurma (TPA) tabanlı yükseltilmiş kendiliğinden ışıma (ASE) çalışmamız özetlenmektedir. Burada, mutlak spektral ASE ayarlanabilirliğine ek olarak, CdSe/CdS malzeme sisteminde spektral ASE tepesinin olağan kendiliğinden ışıma tepesine göre bağıl olarak ayarlanabilirliğini literatürde ilk defa gösterdik. QD’lerin çekirdek ve kabuk boyutlarının ayarlanarak, Kulomb tipi X-X etkileşimlerinin kırmızı tarafa kayan ASE’ye sebep olan çekici veya mavi tarafa kayan ASE’ye sebep olan itici olarak ayarlanabileceğini gösterdik. Hatta doğru QD boyutlarıyla olağan kendiliğinden ışıma tepesiyle aynı spektral yerde ASE elde edilebileceği de bu kısımda gösterildi. Belli bir dalga boyunda elde edilen ASE davranışının tip-I veya tip-II olabilmesinin kontrolünün de mümkün olduğunu tezin bu bölümünde gösterdik. Tezin sonraki kısmında, CdSe/CdS QD’lara ek olarak, benzer ASE ve tip-ayarlanabilirliği çalışmasını, çok yüksek TPA soğurma ve birbirinden bağımsız soğurma/ışıma ayarlanabilirliği özellikleri ile dikkat çeken CdSe/CdS nanoçubuklarda (NR) da başarıyla gözlemledik. Tezin son kısmında MEG olayını CdHgTe QD’lerde ilk defa gösterdiğimiz deney sonuçlarımızı ve MEG kavramından, literatürdeki ilk örneklerden biri olarak, gerçek hayatta kullanılabilecek fotodetektör uygulamasında faydalanma çalışmamızı paylaştık. İnanıyoruz ki, bu tezde paylaşılan sonuçlar MEG ve MER kavramlarının temel anlaşılma yönüne katkı yapmakla kalmayıp bu kavramların QD lazerler, fotodetektörler ve fotovoltaik uygulamalarında da kullanılabilmeleri konusunda yeni gelişmelere yol açacaktır.
Anahtar Kelimeler: nanokristaller, kuvantum noktacıkları, eksitonlar, çoklu
eksiton oluşturması ve yeniden birleşimi, yükseltilmiş kendiliğinden ışıma, fotoalgılayıcılar, lazerler.
vii
Acknowledgements
Everything began when little Fatih stepped into the office of Prof. Demir in the early summer of 2010. That day, the meeting between Fatih and Volkan went extremely “positive” and the foundations of the relationship that will later turn out to be one of the most critical academic career steps of little Fatih were laid down. Since that day, Prof. Demir has always “kept up” with his motivational, encouraging, “supportive”, and positive approach towards Fatih training him on not only technically but also in terms of the political side of the science world. With Volkan’s efforts and contributions, Fatih has learned how to do world-class science and, hence, he is not as little as he was once.
I, as Fatih, would like to express my deepest gratitude to my MS thesis advisor Prof. H. Volkan Demir, who also supported me for my next career steps after Bilkent, besides his invaluable contributions to my academic development as mentioned above.
I would also like to thank my thesis committee members, Prof. Ayhan Altıntaş and Prof. Mehmet Bayındır. Their critical comments and feedbacks were very important for my thesis work.
I believe, one of the most important sides of working in Demir Group has been its members, which made coming to the office and lab much more enjoyable. As my office mates, Dr. Emre Sarı, Can Uran, Aydan Yeltik, Talha Erdem, Burak Güzeltürk, Kıvanç Güngör, Shahab Akhavan, Yusuf Keleştemur, İbrahim Akçalı, Halil Akçalı, Mehmet Zafer Akgül, and Onur Erdem each deserved separate acknowledgement pages. I should also thank Dr. Evren Mutlugün, Dr. Pedro L. Hernandez-Martinez, Dr. Sedat Nizamoğlu, Dr. Gökçe Küçükayan, Dr.
viii
Nihan Kosku Perkgöz, Dr. Rohat Melik, Dr. Urartu Ö. Ş. Şeker, Dr. Vijay Kumar Sharma, Özgün Akyüz, and Emre Ünal for their friendly support during my MS degree. Also, I would like to express my thanks to the former and other group members Cüneyt Eroğlu, Muammer Yasin Hacısalihoğlu, Togay Amirahmadov, Somayeh Fardindoost, and Yasemin Coşkun.
Finally, I want to thank my family for their endless support, which is crucial for a junior researcher to survive in the academia. They have always been the number one source for me to solve the problems I have been facing.
I would also like to acknowledge the financial support I received from TUBİTAK BİDEB 2210 Program.
ix
Table of Contents
1. INTRODUCTION ... 1
2. SCIENTIFIC BACKGROUND ... 6
2.1SEMICONDUCTOR NANOCRYSTAL QUANTUM DOTS AND NANORODS ... 6
2.1.1 Excitonic Structure and Optical Properties of Quantum Dots ... 6
2.1.2 Synthesis of Quantum Dots ... 10
2.1.2.1 Synthesis of CdSe Core QDs ... 10
2.1.2.2 CdS Shell Coating of CdSe Cores with SILAR Technique ... 12
2.2MULTI EXCITON GENERATION AND RECOMBINATION ... 14
2.2.1 Description of Multi Exciton Generation and Recombination and Current State of the Field ... 14
2.2.2 Scientific Challenges of Multi Exciton Generation and Recombination ... 17
2.3TIME-RESOLVED FLUORESCENCE SPECTROSCOPY ... 18
3. RESOLUTION OF BIEXCITONS, TRIONS AND SINGLE EXCITONS IN CDSE/CDS CORE/SHELL QUANTUM DOTS ... 20
3.1EXPERIMENTAL DETAILS ... 21
3.1.1 CdSe/CdS Core/Shell Quantum Dots Used in the Experiments ... 21
3.1.2 Sample Preparation ... 22
3.1.3 Time-Resolved Fluorescence Experiments ... 22
3.2EXTRACTION OF BIEXCITONS,TRIONS AND SINGLE EXCITONS FROM TIME-RESOLVED FLUORESCENCE DECAYS OF QUANTUM DOTS ... 23
3.3EXCITATION INTENSITY DEPENDENCES OF THE INTEGRATED TRFTERMS ... 29
3.4VERIFICATION OF ATTRIBUTIONS OF DECAY COMPONENTS TO THE PHYSICAL EVENTS VIA OTHER SUPPORTING RESULTS ... 33
3.4.1 Decay Lifetime Values of TRF Terms ... 33
3.4.2 Temporal Evolution of the Photoluminescence Spectrum of QDs ... 34
3.4.3 Comparison of the Spectra of Integrated TRF Terms to Steady-State Photoluminescence Spectrum of QDs ... 36
3.4.4 Sample Exposure Time Dependences of Integrated TRF Terms ... 37
3.4.5 The Decay Term Attributed to the Nonradiative Processes ... 40
3.5QUANTUM DOT CORE SIZE DEPENDENCES OF THE SPECTRAL BEHAVIORS OF BIEXCITONS, TRIONS AND SINGLE EXCITON ... 41
4. EXCITON-EXCITON INTERACTION ENGINEERING AND AMPLIFIED SPONTANEOUS EMISSION OF CDSE/CDS NANOCRYSTALS ... 43
4.1CDSE/CDSQUANTUM DOTS ... 44
4.1.1 Two-Photon Absorption Cross-Section Measurement via Z-Scan Technique ... 47
4.1.2 Amplified Spontaneous Emission Experiments of CdSe/CdS Quantum Dots ... 50
4.1.2.1 Sample Preparation and Steady-State Photoluminescence Experiment Setup ... 50
4.1.2.2 Experimental Amplified Spontaneous Emission Results and Discussion ... 51
4.1.2.3. Demonstration of Type-Tunability Feature of CdSe/CdS Quantum Dots in Their Amplified Spontaneous Emission Spectra ... 53
4.2CDSE/CDSNANORODS ... 59
4.2.1 Amplified Spontaneous Emission Experiments of NRs ... 61
4.2.2 Demonstration of Type-Tunability Feature of CdSe/CdS Nanorods in Their Amplified Spontaneous Emission Spectra ... 64
x
4.2.3 Verification of Type Attributions of Nanorods by Independent Time-Resolved
Fluorescence Experiments ... 66
5. MULTI EXCITON GENERATION AND RECOMBINATION IN CdHgTe QUANTUM DOTS ... 68
5.1OBSERVATION OF MULTI EXCITON GENERATION AND RECOMBINATION IN CDHGTE QUANTUM DOTS ... 68
5.2PRACTICAL UTILIZATION OF MULTI EXCITON GENERATION IN PHOTOSENSING DEVICE APPLICATIONS ... 74
5.2.1 Photosensor Device Fabrication and Operation Principles ... 74
5.2.2 Demonstration of Multi Exciton Generation on Photosensor Device ... 75
6. CONCLUSION ... 78
6.1SCIENTIFIC CONTRIBUTIONS ... 81
xi
List of Figures
Figure 2.1.1.1. Discretization of energy levels as the QD size gets smaller. ... 7 Figure 2.1.1.2. Color tunability of QDs with different sizes under ultraviolet
light. ... 8 Figure 2.1.1.3. CdSe/CdS core/shell QD (left) and its energy band diagram
(right). ... 9 Figure 2.1.1.4. CdSe/CdS NRs used in this work. ... 10 Figure 2.1.2.1.1. Glove box system used for the handling of chemicals that are
sensitive to oxygen environment. ... 11 Figure 2.1.2.1.2. CdSe core synthesis setup with a three-neck flask, a
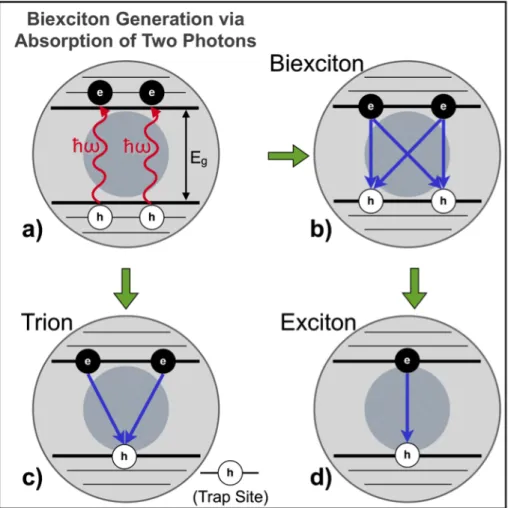
temperature controller, a pressure gauge, and a Schlenk line in fume hood. ... 12 Figure 2.2.1.1. a) Biexciton generation in a QD via absorption of two photons
with energies ħω. b) Biexciton formation immediately after the relaxation of excitons to the band edge. (The blue arrows indicate the possible recombination pathways.) c) Trion composed of a hole and two electrons. The other hole is trapped at a trap site of the QD. d) Exciton in a QD. This could be generated by direct absorption of a single photon or after the recombination of a BX. (The grey circles represent a core/shell QD. “e” denotes an electron and “h” denotes a hole. “Eg” stands for the bandgap
energy of the QD.) (Reprinted with permission from Cihan et al. [1]
xii
Figure 2.3.1. Time-resolved fluorescence setup with cryostat. ... 19 Figure 3.1.1.1. TEM images of CdSe/CdS QDs with a) 20 nm and b) 5 nm scale
bar. ... 21 Figure 3.1.1.2. Photoluminescence emission and absorption spectra of
CdSe/CdS QDs. ... 22 Figure 3.2.1. TRF decays and fittings of the QD solid sample under low
(9.8x10¹² photons/cm2 per pulse and average number of absorbed photons
per QD: 〈N〉 = Jpσabs = 0.03, where Jp is the per pump photon fluence and
σabs is the QD absorption cross-section) and high intensity (5.1x10¹⁴
photons/cm2 per pulse, 〈N〉 = 1.43) excitations collected for the same time duration given in red and blue curves, respectively. (inset) The first 30 ns segments of these time decays. (Reprinted with permission from Cihan et al. [1] Copyright 2013 American Chemical Society.) ... 26 Figure 3.2.2. a) Spectral distributions of normalized TRF fitting coefficients,
Ai(N) for event i=1,2,3,4. b) Spectral distributions of TRF integrated fitting
terms, Aiτi indicating the relative number of events taking place at a photon
energy, for event i=1, 2, 3, and 4. (Reprinted with permission from Cihan et al. [1] Copyright 2013 American Chemical Society.) ... 28 Figure 3.2.3. Spectral distributions of TRF fitting coefficients. (Reprinted with
permission from Cihan et al. [1] Copyright 2013 American Chemical Society.) ... 29
Figure 3.3.1. a) Dependences of the total numbers of X, trion and BX
recombination events on the excitation intensity. (inset) Excitation intensity dependence of the total emission from the sample integrated spectrally and
xiii
in time. b)-h) Spectral distributions of the integrated TRF terms for the excitation pulse intensities: b) 9.5 µJ/cm2·pulse (〈N〉 = 0.05), c) 16.6. µJ/cm2·pulse (〈N〉 = 0.09), d) 29.8 µJ/cm2·pulse (〈N〉 = 0.16), e) 55.5 µJ/cm2·pulse (〈N〉 = 0.29), f) 80.2 µJ/cm2·pulse (〈N〉 = 0.43), g) 117.4 µJ/cm2·pulse (〈N〉 = 0.62), and h) 268.1 µJ/cm2·pulse (〈N〉 = 1.43).
(Reprinted with permission from Cihan et al. [1] Copyright 2013 American Chemical Society.) ... 32 Figure 3.4.1.1. Spectral distributions of the lifetime of each decay term.
(Reprinted with permission from Cihan et al. [1] Copyright 2013 American Chemical Society.) ... 34 Figure 3.4.2.1. Time dependence of the PL peak position shift with respect to
the final position under the excitation fluence of 2.6x10¹⁴ photons/cm2 per pulse (〈N〉 = 0.74). (inset) Evolution of the PL spectrum with time.
(Reprinted with permission from Cihan et al. [1] Copyright 2013 American Chemical Society.) ... 36 Figure 3.4.3.1. Consistency of spectral behavior of A1τ1 term and steady-state PL
spectrum. a) The steady-state PL spectrum of the sample. b) Spectral distributions of the integrated TRF decay terms under the excitation fluence of 5.1x10¹⁴ photons/cm2 per pulse (〈N〉 = 1.43). (Dashed vertical line emphasizes the peak positions of the spectra.) (Reprinted with permission from Cihan et al. [1] Copyright 2013 American Chemical Society.) ... 37 Figure 3.4.4.1. Experimental measurement and corresponding numerical fitting
for the TRF decays of the QD sample at the PL emission peak under short and long exposure times to the laser excitation of 5.1x10¹⁴ photons/cm2 per
xiv
pulse (〈N〉 = 1.43). (Reprinted with permission from Cihan et al. [1]
Copyright 2013 American Chemical Society.) ... 38 Figure 3.5.1. Spectral behavior of the integrated TRF terms of three different
size QDs with the core radii of ca. a) 1.80 nm, b) 1.22 nm and c) 1.10 nm. The shell thicknesses of the QDs are ca. 1.4 nm. The excitation fluences for all the cases are 5.1x10¹⁴ photons/cm2 per pulse. (Reprinted with
permission from Cihan et al. [1] Copyright 2013 American Chemical Society.) ... 42 Figure 4.1.1. The electron/hole localization and the corresponding spectral
amplified spontaneous emission and spontaneous emission behaviors. .... 44 Figure 4.1.2. Schematics of the TPA-pumping of quasi-Type-II CdSe/CdS
core/shell QDs and relative tuning of their ASE via Type-tuning of these QDs by core/shell dimension adjustments resulting in red- to blue-shifted ASE peak with respect to spontaneous emission. Also, here note the non-shifting ASE between the red- and blue-non-shifting regimes. ... 46 Figure 4.1.1.1. Transmittance result of the open-aperture Z-Scan experiment and the fitting of the result using Equation 4.1. We found the TPA cross-section value to be , which is very high compared to CdSe/ZnS QDs of similar sizes [79]. Hence, CdSe/CdS QDs stand out as promising two-photon sensitizers. This higher TPA cross-section of CdSe/CdS QDs compared to CdSe/ZnS can be explained by increased contribution coming from the CdS shell having a band gap of 2.5 eV (see Figure 3.1.1.2 for the absorption of CdSe/CdS QDs exhibiting a strong kink around 430 nm due to the
absorption of the CdS shell) while the ZnS shell has a too large band gap (3.9 eV) that it cannot contribute to the TPA at 800 nm (1.55 eV) [94]. ... 49
xv
Figure 4.1.2.1.1. The steady-state photoluminescence experiment setup and the samples. ... 51 Figure 4.1.2.2.1. a) Evolution of the PL spectra of CdSe/CdS QDs with varying
excitation intensity. b) Excitation pulse intensity dependence of the PL intensity at the wavelength of ASE process. The linear fits shown as dashed lines are guides to the eye about the slopes of the curves. ... 52 Figure 4.1.2.3.1. a) Normalized decomposed ASE and spontaneous emission
spectra of three different QDs under intense two-photon excitation conditions. The under-filled spectra, which are normalized to 0.5 a.u., are the spontaneous emission spectra of the QDs while the narrow spectra normalized to 1 are the ASE spectra of the QDs. The inset shows the original experimental PL spectra of QDs without decomposition. b) Schematics of QDs where the dimensions are proportional to their real dimensions. Dashed lines are provided to compare the core diameters and shell thicknesses of the QDs. c) Table lists the core diameters and shell thicknesses of QDs whose experimental emission spectra are given in a). Note that QD1 and QD2 have the same shell thicknesses while QD2 and
QD3 have the same core radius. ... 55
Figure 4.1.2.3.2. Calculated wavefunctions of electrons and holes for QD1 (on
the left) and QD3 (on the right) samples whose proportionally scaled
schematics are provided in the plots. ... 56 Figure 4.1.2.3.3. Normalized decomposed experimental ASE and spontaneous
emission spectra of (a) near-unity QE QDs and (b) QD3 sample under
intense two-photon excitation conditions. The under-filled spectra, which are normalized to 0.5 a.u., are the spontaneous emission spectra of the QDs
xvi
while the narrow spectra normalized to 1 are the ASE spectra of the QDs. The insets show the original experimental PL spectra of QDs without decomposition. ... 58 Figure 4.2.1. a) Absorption and photoluminescence spectra of CdSe/CdS
core/shell NRs having different core sizes and rod lengths along with b) high resolution transmission electron microscopy (TEM) images (scale bars = 10 nm). ... 60 Figure 4.2.1.1. a) Photoluminescence emission spectra of highly concentrated
close-packed film of CdSe/CdS NR1 sample under different excitation
pulse intensities and b) excitation pulse intensity dependence of the
emission at the ASE peak position of CdSe/CdS NR1. ... 63
Figure 4.2.2.1. a) Schematic illustration of CdSe/CdS core/shell NRs proportional to their real size. b) - d) Excitation intensity dependent emission spectra of NR1 (with blue-shifted ASE peak), NR2 (with
red-shifted ASE peak), and NR3 (with ASE peak at the same position as the
spontaneous emission), respectively. e) - g) Excitation pulse intensity
dependences of emissions at the ASE peak positions of NR1, NR2, and
NR3, respectively. ... 65
Figure 4.2.3.1. TRF decay curves of the NRs together with average least chi-square fitting lifetimes. ... 67 Figure 5.1.1. PL emission spectrum and transmission electron microscopy image of CdHgTe QDs used in this study. The size bar corresponds to 2 nm. ... 70
xvii
Figure 5.1.2. TRF decay results of aqueous CdHgTe QDs at 820 nm (1.512 eV) excited at various excitation photon energies. a) The entire TRF decay of the sample excited at four different photon energies, b) the first 30 ns of the decay of the sample including the least chi-squared fits for two excitation photon energies, one causing MEG and one not causing MEG. ... 72 Figure 5.2.1.1. LS-NS device structure. ... 75 Figure 5.2.2.1. a) Voltage buildup and discharging dynamics of devices with
MPA- ligand QDs (dashed lines) and TGA-ligand QDs (solid lines) and b) spectral sensitivity performance of two devices. ... 77
xviii
List of Tables
Table 3.2.1. Fitting coefficients and lifetimes of high and low intensity excitation cases.……..……….26 Table 3.4.4.1. Fitting results of short and long exposure time cases plotted in Figure 3.4.4.1………...……38 Table 5.1.1. Fitting coefficients and lifetimes of photoluminescence decay curves shown in Figure 5.1.2……….…..73
1
Chapter 1
Introduction
Addressing the world’s increasing energy demand has become one of the main goals of the scientific community in the past decades. The super-linear increase in energy need of the world has enforced the energy production to be increased accordingly. However, the traditional fossil fuel usage as the energy source cannot follow the extreme rate at which the energy demand increases because of the fossil fuels’ CO2 emission that Earth can no longer manage to tolerate. At
this point, the concept of renewable energy has arisen as one of the solutions to future energy problem.
One of the most promising renewable energy methods is solar energy about which the fields of photonics and optoelectronics are critically important. This is mainly because, with the necessary advances in these fields, the conversion of the sun light energy to electricity will become more and more efficient, which is an essential development for the solar energy systems to become a significant energy source. Within this context, recently emerging concept of multi exciton generation (MEG), generation of multiple excitons upon absorption of single photon, has the promise to enable a significant efficiency improvement in photovoltaics [1]. By utilizing the extra energy of the incoming photon above the bandgap of the semiconductor absorber material to excite a second valence band electron across the bandgap, MEG phenomenon can potentially be used to obtain solar cells exceeding the famous Shockley-Queisser thermodynamic limit [2–13]. Indeed, it has recently been shown that with the proper utilization of
2
MEG concept, even above 100% external quantum yield on solar cells is possible [14].
The most promising material system for obtaining high performance MEG feature has been shown to be semiconductor nanocrystal quantum dots (QDs) because of phonon bottleneck (inhibition of phonon emission in QDs because of discretized energy levels), enhanced Coulomb interactions due to strong electronic confinements, and relaxation of translational momentum conservation in QDs [5,10,15–18]. Absence of these features in the bulk counterparts of semiconductor QDs encouraged researchers to explore MEG in QDs.
Although there has been a tremendous effort on understanding the concepts of MEG and multi exciton recombination (MER) in QDs, a lot of contradicting results were reported in the literature about the efficiency of these processes and the physics behind them. Especially the confusion of the recombination behaviors of multi excitons with the recombination in charged QDs has been an important issue to resolve. The first part of this thesis is about this issue: the scientific understanding we developed about the extraction of spectral and temporal behaviors of multi excitons, charged excitons (trions), and single excitons in QDs.
The other important research area that relies on MEG and MER processes is the utilization of QDs as the gain medium for lasing applications [19,20–23]. The emission wavelengths of conventional laser systems are dictated by the atomic transitions of the active materials used in these systems. Therefore, unless very complicated nonlinear processes are involved, it is not possible to obtain lasing action in every spectral position we require using the conventional active gain medium materials. At this point, QDs stand out as freely tunable material systems that have the potential to provide lasing at any wavelength desired in
3
principle when properly tuned. Therefore, the spectral tunability feature of QDs makes them very promising candidates for lasing applications. A very recent demonstration of vertical cavity laser employing QDs as active gain medium is a very good example of how QDs can revolutionize the current laser technology [22]. In this thesis, we present our results on how we can master the amplified spontaneous emission (ASE) with both absolute spectral tunability and relative one with respect to spontaneous emission. The high performance ASE is observed for differently sized core/shell QDs and NRs and the experiments using nanocrystals with different sizes and shapes revealed the tunability of exciton-exciton interactions in these material systems.
Another field that has the potential of benefiting from MEG concept is photodetection. With the presence of MEG event in photodetectors, the photodetection efficiency can be improved significantly because of the possibility of generating a second electron while the conventional structures lose the energy for the second electron as heat dissipation. Within this context, the most commonly used near-infrared and infrared emitting QDs on MEG and MER studies are PbSe and PbS QDs [7,16,24–28]. Although CdHgTe QDs can be very good near infrared alternatives considering the fact that CdHgTe is a material that has already been employed as commercial photodetection material, CdHgTe QDs have not been considered for MEG-photodetection applications [29]. In this thesis, we demonstrated MEG, for the first time, from CdHgTe QDs and as one of the first real-life utilizations of MEG concept, we employed MEG concept on CdHgTe QD-based photosensors.
We believe that from fundamental understanding to practical utilization, we provide a comprehensive MEG and MER study on QDs in this thesis. Our findings do not only clarify some of the significant controversies in the literature on MEG/MER, but also show new ways of exploiting multi excitons in lasers
4
and photodetectors. This thesis hopefully also helps the MEG and MER phenomena become more feasible in real-life applications through the new scientific understanding, proposed approaches and novel engineering perspectives it provides.
This thesis work is organized as follows:
In Chapter 2, after this introductory chapter, we provide brief necessary background information on QDs, MEG, MER and ASE phenomena.
In Chapter 3, the method of extraction of spectral and temporal behaviors of multi excitons in the presence of photocharging effect in CdSe/ CdS QDs is presented and the results are discussed. This chapter includes various independent experimental verifications of the comments and claims about the resolution of different excitonic events taking place in the QD ensembles. Here we also discuss the dependences of spectral behaviors of various excitonic events on QD core sizes.
In Chapter 4, we discuss the experimental results on ASE behavior of CdSe/CdS QDs pumped with a two-photon absorption (TPA) mechanism. We firstly provide experimental supporting evidence for the claim that the CdSe/CdS QDs have one of the best TPA cross-sections among many other alternatives. It is this chapter where we report the first demonstration of both blue- and red-shifted ASE with respect to regular spontaneous emission from different-size QDs (Type-tunability feature). In the second part of this chapter, similar to the first part, we provide our results on the Type-tunability feature of CdSe/CdS nanorods (NRs) in their ASE feature. The Type attributions of different NRs are verified by independent time-resolved fluorescence experiments.
5
In Chapter 5, we present the results on the demonstration of MEG on CdHgTe QDs and the utilization of MEG concept on photosensors employing CdHgTe QDs. Here, we report the clear sensitivity enhancement of the photodetector for the incoming photon energies for which MEG event is possible.
In Chapter 6, we conclude our discussions and summarize our scientific contributions as the results of the thesis works presented here.
6
Chapter 2
Scientific Background
2.1 Semiconductor Nanocrystal Quantum Dots and Nanorods
2.1.1 Excitonic Structure and Optical Properties of Quantum DotsQDs are semiconductor nanocrystals that consist of several hundreds to several thousand atoms reaching about a couple of nanometers in size. The colloidal QDs are the ones that we focus on in this thesis work. In order to avoid the QDs in the ensemble to come and stick together, the colloidal QDs are coated with organic (for QDs dissolved in organic solvents) or inorganic ligands (for QDs dissolved in inorganic solvents).
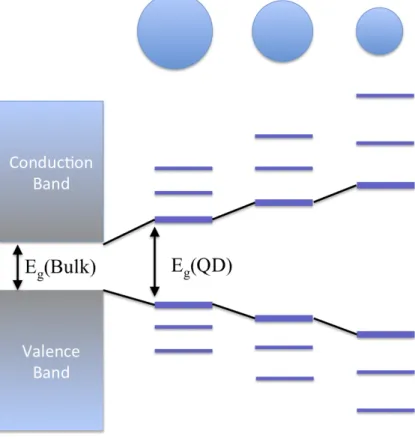
The most interesting feature of QDs making them very promising in a lot of application areas from photovoltaics to photodetectors and lasers to light emitting diodes is that their energy bandgap can be adjusted by just changing their sizes because of the “Quantum confinement effect”. This effect is strong in QDs when the exciton Bohr radius is smaller than the dimensions of the QDs, the regime called strong confinement regime. In this case, it can be said that electron and hole are tightly confined by the energy barrier surrounding the QD in all three dimensions. With this effect, as the QD size gets smaller, the discretization of energy levels of the QD becomes stronger and the bandgap becomes larger, which is illustrated in Figure 2.1.1.1. As can be seen on the following equation, as the radius of the QD decreases, the bandgap increases:
7 Eg(QD) ! Eg,bulk+ !2 !2 2me/hR 2 (2.1) where, Eg(QD) is the bandgap of QD, Eg,bulk is the bandgap of the bulk form of
the semiconducting material, ħ is the reduced Planck constant, me/h is the
electron/hole effective mass, and R is the radius of the QD.
Figure 2.1.1.1. Discretization of energy levels as the QD size gets smaller.
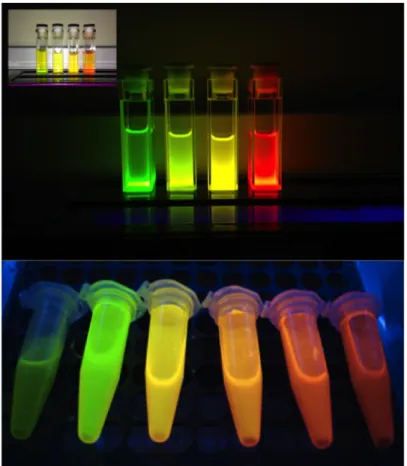
The resulting bandgap tunability of QDs can also be seen in their photoluminescence emission behaviors as shown in Figure 2.1.1.2.
8
Figure 2.1.1.2. Color tunability of QDs with different sizes under ultraviolet light.
Coating the QDs with a different semiconductor material having a certain thickness adds another degree of freedom on the excitonic engineering possibilities of QDs. This kind of structure is called core/shell structure and the mostly used QDs in this work are of this kind. The schematic illustration of this type of QDs with the representative energy band diagram is given in Figure 2.1.1.3.
9
Figure 2.1.1.3. CdSe/CdS core/shell QD (left) and its energy band diagram (right).
There are three different core/shell QD types: Type-I, Type-II and quasi-Type-II. If the electron and hole are confined in the same part of the QD (core or shell), the QD is called Type-I. If the electron and hole are localized at different position of the QD, the excitonic type of the QD is Type-II. However, if the electron and hole wavefunction overlap is partial, as is the case for CdSe/CdS QDs, the QD is called to be quasi-Type-II.
Besides the core/shell CdSe/CdS QDs, we employed also NRs of the same material system of CdSe/CdS in our optical gain studies in this thesis work. The representative shape of CdSe/CdS NRs is provided in Figure 2.1.1.4. There are two main differences between QDs and NRs used here. The first one is the obvious shell size and shape difference where NRs have an elongated CdS shell leading to extremely high absorption cross-section values. The second difference is that NRs have a lower photoluminescence quantum yield (less than 50%) compared to the near unity quantum yield of QDs. This quantum yield difference is due to the synthesis method difference and the reduced electron/hole wavefunction overlap in NRs as a result of the reduced quantum confinement effect.
10
Figure 2.1.1.4. CdSe/CdS NRs used in this work.
2.1.2 Synthesis of Quantum Dots
The synthesis of core/shell QDs basically consists of a two-step process: synthesis of the core QDs and shell coating of these QDs. Since CdSe/CdS QDs are the ones that we used most in this thesis work, we will provide the synthesis basics and procedure for the synthesis of CdSe/CdS QDs.
2.1.2.1 Synthesis of CdSe Core QDs
The core CdSe synthesis is based on the discrete nucleation of CdSe molecules in a well-defined crystal structure upon the supersaturation of synthesis environment with Cd and Se precursors. After the injection of the precursors to the hot coordinating solvent, the nucleation takes place and to stop the nucleation phase, the temperature should be decreased immediately after the necessary time passes.
The core synthesis method we used in this work is similar to the reports in the literature [30,31]. First, in a three-neck flask, 96 mg of CdO, 450 mg of Tetradecylphosphonic acid (TDPA, 98%) and 6 g of trioctylphosphine oxide (TOPO, 90%) are mixed and the temperature is elevated to 130-150°C under
11
vacuum. Then the temperature is elevated to 350°C under argon atmosphere. While this solution is being kept under this condition for about 1 hour, 3.3 mL tributylphophine-Se (TBP-Se) (1.5 M) precursor is prepared by mixing 4.95 mmol Se with 3.3 mL of TBP in a glovebox. Then, after making sure that CdO is totally dissolved and the solution in the flask became totally transparent, the temperature is lowered to 273°C and the Se precursor is injected. Immediately after the TBP-Se injection, the system is brought to room temperature to stop the growth of the cores.
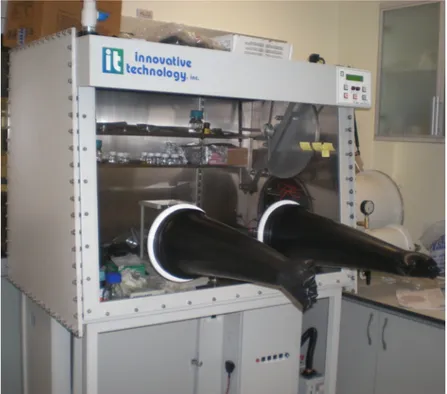
Figure 2.1.2.1.1. Glove box system used for the handling of chemicals that are sensitive to oxygen environment.
12
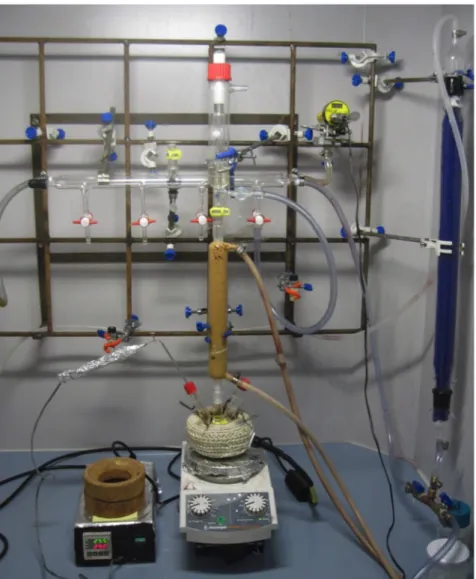
Figure 2.1.2.1.2. CdSe core synthesis setup with a three-neck flask, a temperature controller, a pressure gauge, and a Schlenk line in fume hood.
2.1.2.2 CdS Shell Coating of CdSe Cores with SILAR Technique
The synthesis of CdSe/CdS QDs having a core radius of ca. 1.22 nm and a shell thickness of ca. 1.4 nm was carried out through modified selective ion layer adsorption and reaction (SILAR) technique as Greytak et al. previously reported [32,33].
13
After the preparation of CdSe cores as described in the previous part, we prefer to keep the CdSe core QDs in a fridge overnight which later makes it easier to clean the solution from residual materials. For the Cd precursor preparation, Cd-oleate (2.5 mL), oleylamine (0.3 mL) and trioctylphophine (TOP) (2.2 mL) are mixed in the glovebox. After this process, some more TOP and oleylamine are
added to make the Cd concentration 0.1 M. For S precursor, 105 µL (TMS)2S is
mixed with 4.9 mL of TOP to obtain 0.1 M S concentration in glove box.
After we obtain the Cd and S precursors, the core/shell QDs are synthesized using the recipe in the literature [32]. First, 6 mL of octadecene (ODE) and 3 mL oleylamine are mixed in a four-neck flask and the temperature is elevated to 100°C and kept under vacuum for 30 min. Then, the temperature is lowered to room temperature and the previously synthesized CdSe cores are injected into the flask. To evaporate the hexane in the solution, the system is kept under vacuum until no bubble formation resides. Subsequently, the temperature is increased to 180°C and a certain amount of prepared Cd precursor is injected into the flask with the help of a syringe pump slowly for 3 min. After Cd precursor injection, we wait for 12 min and then inject the S precursor similarly. Continuing in this alternating fashion between the Cd and S precursors, after reaching the 4th
CdS monolayer surrounding CdSe cores, we decrease the temperature to 80°C and keep the system at that temperature for annealing. After coming to room temperature, we add hexane to the solution and start the cleaning procedure. For cleaning, the sample is first centrifuged to get rid of the remaining unwanted residues. Then, acetone or methanol is added and the QDs precipitate. After the removal of the solution on top of the precipitated QDs, the QDs are dissolved in hexane.
Since the CdS shell layers were grown around the cores at 180°C, the formation of interfacial alloy layers of CdSeS is not expected in this synthesis. The size
14
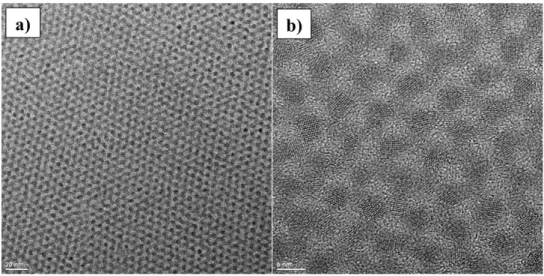
distribution of the QDs obtained with this synthesis method is narrow (with a <10% deviation from the average QD size) as can be seen in the transmission electron microscopy image of the QDs given in Figure 3.1.1.1. The PL full-width at half-maximum value of ca. 25 nm also indicates the highly monodisperse size distribution of the QDs.
2.2 Multi Exciton Generation and Recombination
2.2.1 Description of Multi Exciton Generation and Recombination and Current State of the Field
Photogeneration and recombination of multi excitons (MEs) in semiconductor nanocrystal quantum dots have recently attracted significant scientific interest as a possible means to improve the performances of QDs in device applications. High surface quality and small density of defect sites with engineered band structures of recently developed core/shell QDs, especially the ones with core/shell materials of CdSe/CdS [19,32,34–38] and CdTe/CdSe [39–41], enabled better multi exciton generation and recombination performances encouraging researchers in this field. In very recent reports, MEG phenomenon has indeed been shown to be very promising especially for improving the solar energy conversion efficiencies [3,5,6,9,14,42–47]. It has also been demonstrated that even over 100% peak external quantum efficiency is possible for the QD solar cells exploiting the MEG concept [14]. Another important research area that relies on MEG and MER processes is the utilization of QDs as the gain medium for lasing applications [19,20–23]. Easy spectral tunability and comparatively easy synthesis of QDs via wet chemistry make them very convenient candidates for the lasing applications. In addition to photovoltaic and lasing applications, the MEG concept has also been shown to significantly improve the photodetector device performances [48]. For all of these application
15
areas, the most pronounced limiting effect is the nonradiative Auger recombination (AR) of MEs. Therefore, the suppression of AR is also under intense research in order to benefit from the MEs most effectively [19,35,37– 39,49]. Until very recently, MER had been believed to be fully nonradiative as AR. However, it was shown that MERs do not have to be nonradiative and could even be made fully radiative for some special QDs [38,50].
MEs can be generated in a QD either by absorption of a highly energetic single photon followed by carrier multiplication (CM) process or by sequential absorption of multiple photons in a single pulse with lower photon energies [24]. As illustrated in Figure 2.2.1.1, we generated MEs using the latter method. Since the behavior of MEs generated by either method has been shown to be the same [51], the results presented in Chapter 3 of this thesis are valid also for the MEs generated by CM.
16
Figure 2.2.1.1. a) Biexciton generation in a QD via absorption of two photons with energies ħω. b) Biexciton formation immediately after the relaxation of excitons to the band edge. (The blue arrows indicate the possible recombination pathways.) c) Trion composed of a hole and two electrons. The other hole is trapped at a trap site of the QD. d) Exciton in a QD. This could be generated by direct absorption of a single photon or after the recombination of a BX. (The grey circles represent a core/shell QD. “e” denotes an electron and “h” denotes a hole. “Eg” stands for the bandgap energy of the QD.) (Reprinted with
permission from Cihan et al. [1] Copyright 2013 American Chemical Society.)
This material combination of CdSe used as the core and CdS used as the shell has previously been shown to have a very good radiative MER behavior because of the suppression of AR in the case of “giant” QD structure, where the core is surrounded by at least 8-10 monolayers of CdS [19,35,38]. As will be discussed
17
in the next chapter, nonradiative AR is substantially suppressed (but not necessarily completely) in the QDs studied in this thesis work, the resulting MEs in a significant portion of QDs in the ensemble have performed radiative recombination similar to the MEs in the giant QDs reported with the same core/shell materials.
2.2.2 Scientific Challenges of Multi Exciton Generation and Recombination Although there are a lot of strong experimental and theoretical studies in the literature on MEG using a wide variety of material and shape combinations, the temporal and spectral aspects of the generation and recombination of MEs still remain under debate. Especially the confusion of the MER with the recombination of carriers in a charged QD has caused a lot of different and contradicting results to be reported in the literature [5,51–55]. The confusion of the recombination in charged QDs and the MER has previously been addressed through the prevention of charging of the QDs by effectively exposing each QD to pulses of excitation less frequently through stirring or flowing the samples in solution [6,56–58]. Although this approach has led to very important explorations and clarifications about MEs, a deeper understanding of MEs is necessary because avoiding the photocharging of the QDs in practical applications, such as QD lasing and solar energy conversion based on MEG, where typically thin films of QDs are used in solid form, may not be generally possible. Therefore, the behavior of the MEs in the presence of photocharging in solid QD ensembles is still required to be well understood in order to fully utilize MEs in real life applications of solid-state devices. In the corresponding chapter of this thesis, we addressed this confusion of MER and recombination in charged QDs.
18
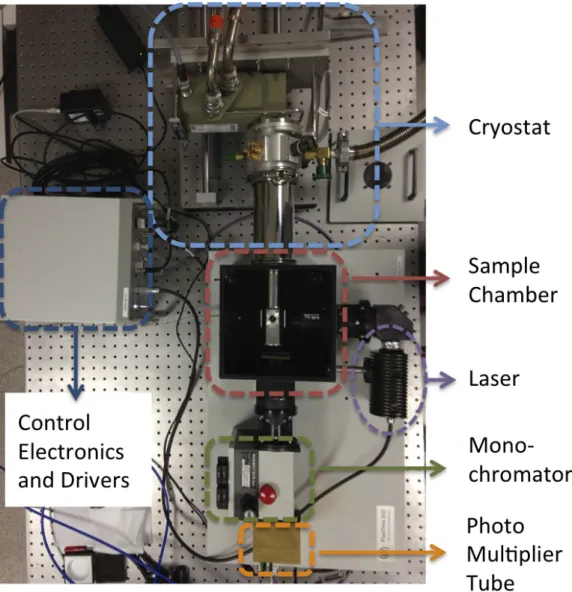
2.3 Time-Resolved Fluorescence Spectroscopy
Time-resolved fluorescence (TRF) spectroscopy is a very strong method that gives us the opportunity to observe, explore and understand the physical and chemical events taking place in the nanostructures of our interest. The type of TRF employed in our thesis work is time-correlated single photon counting (TCSPC). This method is a statistical method that is based on very high number of photon counting sub-experiments that constitute a statistical global decay behavior of the sample under test.
This method works in the following way: the pulsed laser source sends a pulse and excites the sample. Then, the sample emits a photon after a certain time depending on its quantum mechanical structure. The photomultiplier tube detects the photon and the electronic system records the time between the laser pulse generation and the sample’s photon emission. This process is repeated millions of times and the histogram of the photons collected at each time instant is the result of the fluorescence decay of the sample under test. The TRF setup we used in our TCSPC measurements is provided in Figure 2.3.1.
19
20
Chapter 3
Resolution of Biexcitons, Trions and
Single Excitons in CdSe/CdS
Core/Shell Quantum Dots
This chapter is based on the publication “Observation of biexcitons in nanocrystal solids in the presence of photocharging,” A. F. Cihan, P. L. Hernandez-Martinez, Y. Kelestemur, E. Mutlugun, and H. V. Demir, ACS Nano, 7, 4799-4809 (2013). Reprinted with permission from American Chemical Society.
In this part of the thesis, we present the spectral-temporal behavior of biexcitons (BXs) in the presence of photocharging in near-unity quantum yield (QY) CdSe/CdS core/shell nanocrystals. By studying three QD samples with different core radii, we observe the spectral behavior modifications of the BXs as the result of strength tunability of X-X interactions in the CdSe/CdS QDs with size variation. Resolution of the recombination events of Xs, BXs and trions in our ensemble measurements was achieved with the TCSPC experiments under variable excitation intensities at different emission wavelengths. In order to extract X, BX, and trion decays, we developed an analysis approach for the time decays of the sample where we described the physical events happening in the QD ensemble with their corresponding time decay terms having specific lifetimes. This method, which uses the decay lifetime differences of different
21
events to discriminate other events, provides us with the ability to distinguish the spectral behaviors of Xs, BXs, and trions, even when their spectral behaviors are almost the same, by tracing the corresponding decay terms throughout the spectrum. As a result, the spectral radiative recombination kinetics of Xs, BXs, and trions were obtained. Moreover, we verified our results by crosschecking the excitation intensity dependences of these recombination events, evolutions of the photoluminescence spectra with time, independent steady-state photoluminescence behaviors, and exposure time dependences, all of which proved to be consistent with each other.
3.1 Experimental Details
3.1.1 CdSe/CdS Core/Shell Quantum Dots Used in the Experiments
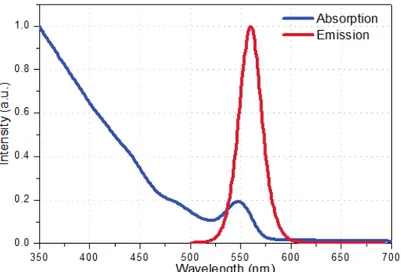
The CdSe/CdS QDs used in MEG/MER experiments possess very high crystal quality and very narrow size distribution. The transmission electron microscopy (TEM) images in Figure 3.1.1.1 show a nearly perfect arrangement of QDs, which points toward the low size variance of QDs. PL emission and absorption spectra of QDs dispersed in hexane are provided in Figure 3.1.1.2.
22
Figure 3.1.1.2. Photoluminescence emission and absorption spectra of CdSe/CdS QDs.
3.1.2 Sample Preparation
The CdSe/CdS core/shell QDs were dispersed at a medium concentration level in hexane. Then, 2 µL of the QD solution was mixed with 98 µL of Poly(methyl methacrylate) (PMMA) A7.5 with the help of a Vortex mixer (Velp Scientifica Inc.) for approximately 5 min until QDs were dispersed completely homogeneously inside the PMMA. 50 times dilution of the QD solution ensured the very low concentration of QD solids in PMMA, which allowed us to obtain very homogeneous QD distribution in the solid medium on the quartz substrate. Moreover, the Förster-type nonradiative energy transfer (NRET) among the QDs was suppressed because of the increased average inter-particle distance (>50 nm) and high dielectric surrounding medium. 25 µL of this QD-PMMA mixture was spin-coated onto clean quartz substrates of 1cm by 1cm in dimensions at a 1500 rpm rotation speed for 3 min.
3.1.3 Time-Resolved Fluorescence Experiments
We used a 3.3 eV (375 nm) pulsed laser excitation with a pulse width of <50 ps
23
sample for the TCSPC measurements (Picoquant Fluotime 200). Laser fluences were varied from 9.8×10¹² to 5.1×10¹⁴ photons/cm2 per pulse. The collection part of the TRF setup consists of a monochromator with 8 nm wavelength resolution and a 0.3 nm wavelength accuracy and a photomultiplier tube with controlling electronics resulting in a time resolution of ca. 200 ps. To avoid phonon-mediated undesired processes as much as possible, the experiments were conducted at temperatures below 20 K with the help of a closed cycle liquid He cryostat (Cryo Industries).
3.2 Extraction of Biexcitons, Trions and Single Excitons from
Time-Resolved Fluorescence Decays of Quantum Dots
The experimental time-resolved fluorescence (TRF) results were analyzed by least chi-square fittings based on a multi-exponential fitting
(3.1) without enforcing any specific lifetime in any of the analyses. Since the best chi-square values were obtained for the 4-exponential fittings, the decay curves were fitted with the four exponentials. Here it is also worth noting that we also checked the resulting spectral behaviors with three exponentials, which resulted in physically meaningless steep changes in the individual lifetime values for the varying emission wavelength. The consistency of the lifetime values and ratios of each decay term to each other throughout the entire spectrum, as provided in Figure 3.4.1, also justifies that each decay term represents a physical event. For the 5-exponential fitting trials, the fifth decay coefficient turned out to be zero justifying our 4-exponential fittings. The numerical fitting therefore identified the best matching sets of (Ai, τi). The fitting lifetime components of interest here
are at least orders of magnitude longer than the excitation pulse width and the
3 1 2 4 1 2 3 4 t t t t A e− τ A e− τ A e− τ A e− τ Noise + + + +
24
instrument response function. Therefore, the results can be considered as the response of the system to an impulse excitation.
The method of extraction of X, BX, and trion recombination events from the total time decay curves of the ensemble is based on the lifetime differences of these physical events taking place in the ensemble. In other words, the kinetic signatures of the events are used to distinguish one from the other when exploring the spectral distributions and excitation intensity dependences of these events. Therefore, each one of the exponential decay terms in the fitting (Equation 3.1) can be attributed to a specific recombination event happening inside the QD ensemble. The resulting lifetimes together with their associated coefficients may then be examined to obtain the desired spectral dynamic behavior of the corresponding event. To find the total number of occurrences of a radiative recombination event in the ensemble, the total number of photons emitted from the sample should also be known. Integration of each decay term with respect to time gives the total number of photons emitted as a result of the corresponding physical event having that characteristic lifetime. Therefore, once the fitting coefficients and lifetimes are identified, the spectral distributions and excitation intensity dependences of the events happening in the excitation volume of the sample can conveniently be extracted and studied. Since we do not expect the emissions due to different events to have different angular emission dependences, the integration in Equation 3.2 can be considered as a sampling of the number of occurrences of the event represented by the decay term Aie-t/τi (i=1, 2 or 3), which is simply equivalent to the product of the
lifetime describing the specific event with its weighting coefficient. Mathematically speaking, it is then necessary to keep track of Aiτi as a function
of emission wavelength, for each event i. Therefore, it is physically more meaningful to study and compare Aiτi(λ) spectra of different events, rather than
25
(3.2) This kind of lifetime extraction methodology using TCSPC measurements has enabled us to resolve the spectral dynamic behaviors of different recombination events that would otherwise be unresolvable in ensemble systems with other methods that do not exploit the lifetime differences between the events. For example, in our case, we extracted the spectral dynamic behaviors of three different events taking place in the QD ensemble even though they are not distinguishable in the steady state PL measurements. Thus, this approach allows us to overcome the problems of inhomogeneous broadening of QD emissions when the spectral peak positions of the two events are very close to each other. With this method, the lifetimes of each event throughout the whole emission spectrum can be analyzed. Moreover, the spectral, temporal and power dependent behaviors of different events can further be obtained even when they are spectrally unresolvable in the ensemble system.
i t i i i Ae− τdt A
τ
=∫
26
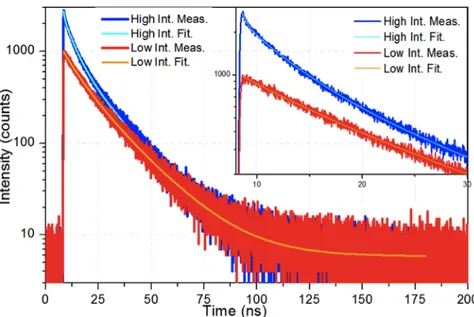
Figure 3.2.1. TRF decays and fittings of the QD solid sample under low (9.8x10¹²
photons/cm2 per pulse and average number of absorbed photons per QD: 〈N〉 = Jpσabs =
0.03, where Jp is the per pump photon fluence and σabs is the QD absorption cross-section)
and high intensity (5.1x10¹⁴ photons/cm2 per pulse, 〈N〉 = 1.43) excitations collected for the
same time duration given in red and blue curves, respectively. (inset) The first 30 ns segments of these time decays. (Reprinted with permission from Cihan et al. [1] Copyright 2013 American Chemical Society.)
Figure 3.2.1 shows the TRF decay curves taken at the photoluminescence peak of the QD solid sample for low and high intensity excitation cases. The emergence of the third and fourth exponential components for the high intensity excitation case can be seen here. The corresponding fitting coefficients and lifetimes are given in Table 3.2.1. After collecting the fluorescence decay curves of the QDs at all emission photon energies for the specific excitation intensities,
Table 3.2.1. Fitting coefficients and lifetimes of high and low intensity excitation cases.
A1 τ1 (ns) A2 τ2 (ns) A3 τ3 (ns) A4 τ4 (ns) Low Int. 530±13 18.4 8 372±26 8.31 73±36 4.60 - - High Int. 539±15 18.9 9 559±28 10.7 3 1218±5 6 4.44 404±214 0.41
27
we obtain the spectral distributions of the coefficients of each exponential term in the overall decay (Equation 3.1).
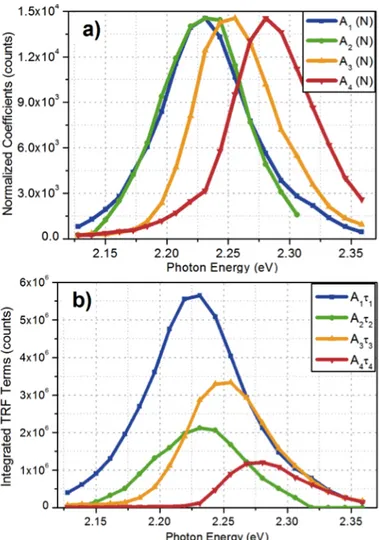
The normalized fitting coefficients of each term in the overall decay for the medium intensity excitation case are shown in Figure 3.2.2(a), which is useful to observe the spectral shifts between the events. The coefficients are provided here in the normalized form because the absolute amplitudes of the coefficients themselves might be misleading due to the fact that one needs to take the lifetimes into account to properly calculate the number of photons emitted as a result of that event. For example, as can be seen in Figure 3.2.3, the coefficient
A4, which is the coefficient of the fastest decay term, is the most dominant one.
However, this does not mean that this event is the one happening most frequently in the ensemble because a very short lifetime of this decay component makes the total number of occurrences of this event very low, making it the weak contributor to the overall photoluminescence. Therefore, the coefficients themselves cannot be representative for the total number of times an event occurred for which the radiative decay rates of the species should also be taken into account [59]. A more accurate way of extracting the spectral distributions of the events is to utilize the integral in Equation 3.2 (integrated TRF terms) instead of just the coefficients alone at all emission photon energies, as explained above. Therefore, the integrated TRF curves depicted in Figure 3.2.2(b) are physically the most meaningful and important. These results presented in Figure 3.2.2(b) look like steady state photoluminescence (SS-PL) measurement results but they cannot be obtained with a steady state method because of the overlapping spectral distributions and hence spectral mixing of the corresponding events.
28
Figure 3.2.2. a) Spectral distributions of normalized TRF fitting coefficients, Ai(N) for
event i=1,2,3,4. b) Spectral distributions of TRF integrated fitting terms, Aiτi indicating the
relative number of events taking place at a photon energy, for event i=1, 2, 3, and 4. (Reprinted with permission from Cihan et al. [1] Copyright 2013 American Chemical Society.)
29
Figure 3.2.3. Spectral distributions of TRF fitting coefficients. (Reprinted with permission from Cihan et al. [1] Copyright 2013 American Chemical Society.)
3.3 Excitation Intensity Dependences of the Integrated TRF
Terms
We also obtained the excitation intensity dependences of these events by collecting the spectral distributions of the integrated TRF terms at different excitation intensities. Figure 3.3.1(a) shows the dependences of the spectrally integrated total photon emissions of the corresponding events on the excitation intensity. The intensity dependences of the total number of generated biexcitons (BXs) and trions are directly obtained by the spectral integration of Aiτi, i.e.,
Aie!t/!id"
510nm 580nm
"
(i = 2 or 3), where Aiτi is the time integral of the decaycomponent Aie!t/!i, i.e., A
ie
!t/!idt
t
"
. In other words, this corresponds to double integral (spectral time integrals) of the decay component. This integral was calculated at each of the excitation power levels and the values were plotted with respect to the excitation intensity. However, the intensity dependence of the total number of single excitons (Xs) generated directly upon a photon absorption is a little bit tricky to calculate because single excitons are generated in QDs also30
as a result of a BX recombination. Therefore, the Xs generated due to BX recombination should be excluded. Since each BX recombination event causes a
X to be generated and A3τ3 is the number of BX recombinations, the number of
Xs generated directly from photons is equal to
(
A1!1! A3!3)
510nm580nm
"
d" . The resultsof this integral at every excitation power level were plotted against the intensity values in Figure 3.3.1(a).
As can be seen in Figure 3.3.1(a), the total number of occurrences of the event that is represented by A3 and τ3 exhibits nearly a quadratic excitation intensity
dependence while the one represented by A1 and τ1 has a linear dependence.
These characteristic behaviors are exactly what would be expected from BX and X recombination events, respectively. The linear dependence of X recombination on the excitation intensity is straightforward, which basically comes from a single photon absorption generating a single X to recombine. The nearly quadratic dependence of A3τ3 is, on the other hand, due to the cascaded
absorptions of two photons within a single pulse by a single QD, which result in the formation of BXs. Therefore, the likelihood of forming a BX quadratically increases with increasing excitation intensity. In fact, this quadratic behavior is considered to be a lucid evidence of the biexcitonic origin of this decay component [35,50,60]. (Here note that there is another component indicated as trions in Figure 3.3.1, which will be examined at a later point in the thesis. Here it is worth noting that this component is growing with the excitation intensity faster than X’s and slower than BX’s.)
32
Figure 3.3.1. a) Dependences of the total numbers of X, trion and BX recombination events on the excitation intensity. (inset) Excitation intensity dependence of the total emission from the sample integrated spectrally and in time. b)-h) Spectral distributions of the integrated TRF terms for the excitation pulse intensities: b) 9.5 µJ/cm2·pulse (〈N〉 = 0.05),
c) 16.6. µJ/cm2·pulse (〈N〉 = 0.09), d) 29.8 µJ/cm2·pulse (〈N〉 = 0.16), e) 55.5 µJ/cm2·pulse (〈N〉 = 0.29), f) 80.2 µJ/cm2·pulse (〈N〉 = 0.43), g) 117.4 µJ/cm2·pulse (〈N〉 = 0.62), and h)
268.1 µJ/cm2·pulse (〈N〉 = 1.43). (Reprinted with permission from Cihan et al. [1] Copyright 2013 American Chemical Society.)
The spectra of each of the integrated TRF terms at the intensity levels used to construct Figure 3.3.1(a) are provided in Figures 3.3.1(b)-(h). The three plots are scaled without changing the photon counts numbers so that the A1τ1 peaks are at
the same level in order to guide the eye about the dominance of the integrated TRF terms. As can be seen from Figure 3.3.1(b)-(h), as the excitation intensity increases, the BX recombination becomes more dominant, which is consistent with the trend given in Figure 3.3.1(a). The increased dominance of the coefficient A3 (see Table 3.2.1) of the TRF decay curve in Figure 3.2.1 with the
increased intensity is a result of the same fact that BXs become more dominant with the increased excitation intensity.
The facts that QDs have a near unity QY and experiments were conducted at cryogenic temperatures ensure a high degree of suppression of other
33
nonradiative and non-ideal transitions caused by the interfacial and surface defects. Therefore, the resulting TCSPC decay curves were expected to consist mostly of radiative recombination terms. As shown in the inset of Figure 3.3.1(a), the total emission from the sample has a linear excitation intensity dependence suggesting that the features generated at higher intensities are also primarily radiative pointing towards a significant suppression of nonradiative Auger recombination.
3.4 Verification of Attributions of Decay Components to the
Physical Events via Other Supporting Results
3.4.1 Decay Lifetime Values of TRF Terms
In addition to the quadratic intensity dependence and coherent spectral behavior of the decay term A3τ3, the lifetime of this component is also a strong evidence
for the biexcitonic origin of this component. Throughout the entire spectrum, for all excitation intensity levels, the lifetime of this component, τ3, is found to be
very close to the 1/4th of the single exciton recombination lifetime, τ
1 (See
Figure 3.4.1.1). This ratio of BX radiative recombination rate to the X recombination rate is expected to be 4 according to the quadratic scaling of the recombination rates with the exciton multiplicity, which was previously proposed and supported through “free carrier model” by McGuire et al. and also by some other reports [6,61]. The reason behind the quadratic scaling of
recombination rates is that there are N2 possible recombination pathways for a
QD with N excitons in it, as illustrated in Figure 1. Therefore, the “free carrier model” can be said to hold true for this core/shell material combination both for the giant QDs reported previously [35] and for these QDs reported here. The range of BX recombination lifetime and the clear shift of the photoluminescence spectra with time suggest that the recombination events of BXs through the TRF