SELECTIVE MANIPULATION OF ICT AND PeT PROCESSES IN
STYRYL-BODIPY DERIVATIVES: APPLICATIONS IN
MOLECULAR LOGIC AND FLUORESCENCE SENSING OF
METAL IONS
A THESIS
SUBMITTED TO THE INSTITUTE OF ENGINEERING AND SCIENCES OF BILKENT UNIVERSITY
IN PARTIAL FULFILLMENT OF THE REQUIREMENTS FOR THE DEGREE OF
I certify that I have read this thesis and that in my opinion it is fully adequate, in scope and in quality, as a thesis of the degree of Master of Science.
………. Prof. Dr. Engin U. Akkaya (Principal Advisor)
I certify that I have read this thesis and that in my opinion it is fully adequate, in scope and in quality, as a thesis of the degree of Master of Science.
………. Prof. Dr. Ömer Dağ
I certify that I have read this thesis and that in my opinion it is fully adequate, in scope and in quality, as a thesis of the degree of Master of Science.
………. Asst. Prof. Dr. Dönüş Tuncel
I certify that I have read this thesis and that in my opinion it is fully adequate, in scope and in quality, as a thesis of the degree of Master of Science.
………. Asst. Prof. Dr. Neslihan Şaki
I certify that I have read this thesis and that in my opinion it is fully adequate, in scope and in quality, as a thesis of the degree of Master of Science.
………. Asst. Prof. Dr. M. Fatih Danışman
Approved for the Institute of Engineering and Science: ……….
Prof. Dr. Levent Onural
ABSTRACT
SELECTIVE MANIPULATION OF ICT AND PeT PROCESSES IN
STYRYL-BODIPY DERIVATIVES: APPLICATIONS IN
MOLECULAR LOGIC AND FLUORESCENCE SENSING OF
METAL IONS
Sencer Selçuk M.Sc. in ChemistrySupervisor: Prof. Dr. Engin U. Akkaya July, 2010
Recent developments in the Bodipy chemistry, provided new opportunities for modification of this chromophore which, in turn, using appropriate metal-ligand pairs, allowed the control and manipulation of PeT and ICT mechanisms. Exploiting these mechanisms, we demonstrated that photophysical properties of Bodipy can be shaped as desired using metal cation modulators to obtain absorbance signals in accordance with a digital half-adder circuit. In addition, another Bodipy derivative with a simple and rational design, shown to have emission signals equivalent to AND operation in Boolean logic. A molecular three-input AND gate was also synthesized taking the advantage of differential binding affinities of metal cations for different ligands. Our work proves that, with careful design, photophysical properties of a single chromophore can be modified as desired. Hence molecular logic gates, and even molecules performing more complex logic operations can be obtained using metal cations as non-annihilating logic inputs.
ÖZET
STIRIL-BODIPY TÜREVLERINDE PeT VE ICT
MEKANIZMALARININ SEÇICI KONTROLÜ: MOLEKÜLER
MANTIK DEVRELERI VE METAL KATYONLARI IÇIN
FLORESANS SENSÖRLERDE UYGULAMALAR
Sencer SelçukKimya Bölümü, Yüksek Lisans Tez Yöneticisi: Prof. Dr. Engin U. Akkaya
Temmuz, 2010
Bodipy kimyasındaki son yıllardaki gelişmeler, bu kromoforun çok çeşitli şekillerde modifikasyonuna olanak sağladı. Bu olanak, uygun ligand-metal çiftleri kullanılarak Bodipy üzerinde ışıkla indüklenen elektron transferi (PeT) ve molekül içi yük transferi (ICT) mekanizmalarinin istenildiği şekilde kontrol ve manipüle edilebilmesini de sağladı. Biz de bu çalışmamızda Bodipy’nin fotofiziksel özelliklerini metal katyonları ile kontrol ederek emisyon sinyallerinin sayısal mantıktaki yarım toplayıcı işlemine benzer bir şekilde elde edilebileceğini gösterdik. Bunun yanında basit ve rasyonel bir tasarımla elde ettiğimiz, yine Bodipy türevi bir molekülün emisyon sinyallerinin Boole mantığındaki VE işlemine eşdeğer olduğunu gözlemledik. Ayrıca metallerin farklı ligandlara ilgilerinin farklı olmasını kullanarak üç girdili bir VE kapısı da elde ettik. Çalışmamız dikkatli bir dizaynla tek bir kromofor üzerinde fotofiziksel özelliklerin istenildiği şekilde modifiye edilebileceğini, böylece birbirini kimyasal olarak yok etmeyen farklı metal
ACKNOWLEDGEMENT
I am heartily thankful to my supervisor Engin U. Akkaya whose encouragement and support made this work possible. I also owe gratitude to him for his great patience and understanding during the course this research .
I want to thank our group members Özgür Altan Bozdemir, Gökhan Barın, Ruslan Guliyev, Hande Boyacı, Tuğrul Nalbantoğlu, Yusuf Çakmak, Safacan Kölemen, Onur Büyükçakır, Sündüs Erbaş, Tuğba Özdemir, Fazlı Sözmen, Bilal Kılıç, Merve Türkşanlı and rest of the SCL (Supramolecular Chemistry Laboratory) members some of whom participated also in this research,.
I would like to thank to TÜBİTAK (The Scientific and Technological Research Council of Turkey) for financial support.
TABLE OF CONTENTS
ABSTRACT ... iv
ÖZET ... v
ACKNOWLEDGEMENT ... vi
TABLE OF CONTENTS ... vii
LIST OF FIGURES ... x
LIST OF TABLES ... xiii
LIST OF ABBREVIATIONS ... xiv
CHAPTER 1: INTRODUCTION ... 1
1.1 Supramolecular Chemistry: Quo Vadis? ... 1
1.2 Logic Gates: Workhorses of Modern IT6 ... 2
1.2.1 Molecular Logic Gates: Computing at the Bottom ... 4
1.2.2 Basics of Fluorescence ... 5
1.2.3 Photoinduced Electron Transfer ... 7
1.2.4 Internal Charge Transfer... 9
1.2.5 Basic Logic Gates at Molecular Level... 11
1.2.6 Towards and Beyond the Molecular Arithmetics ... 16
1.2.7 Ready-to-use implications of Molecular Logic ... 19
CHAPTER 2: EXPERIMENTAL PROCEDURES ... 22
2.3.1 Synthesis of Compound 3. ... 26
2.3.2 Synthesis of Compound 4. ... 27
2.4 Synthesis of Three Input AND Logic 7. ... 29
2.4.1 Synthesis of 4-(1,4,7,10-tetraoxa-13-azacyclopentadecan-13-yl)benzaldehyde ... 29
2.4.2 Synthesis of Compound 5 ... 30
2.4.3 Synthesis of Compound 6 ... 31
2.4.4 Synthesis of Compound 7 ... 32
2.5 UV-Vis Titration Experiments ... 33
2.6 Isothermal Titration Calorimetry. ...34
CHAPTER 3: RESULTS & DISCUSSION ... 35
3.1 Precise Control of PeT and ICT Processes ... 35
3.2 Binding constants ... 37
3.3 AND Gate ... 40
3.4 Half-adder in the Absorption Mode ... 45
3.5 A three-input AND Gate ... 48
CONCLUSION ... 51
REFERENCES ... 52
APPENDIX A: ADDITIONAL UV-VIS DATA ... 57
APPENDIX B: ADDITIONAL ITC DATA ... 61
APPENDIX C: NMR SPECTRA ... 63
LIST OF FIGURES
Figure 1.Replica of first silicon-based transistor compared with a state-of-art
pMOS transistor. ... 3
Figure 2. CPU transistor counts 1971-2004 and Moore’s Law ... 4 Figure 3. First two-input molecular logic device designed by de Silva along with
truth table adapted fluorescence measurements ... 5
Figure 4. Jablonski diagram showing fluorescence and phosphorescence ... 6 Figure 5. Schematical representation that shows reversible control of PeT process,
hence fluorescence... 7
Figure 6. Fluorescence intensity of Bodipy is controlled via a pH sensitive PeT
donor ... 8
Figure 7. Reverse PeT (d-PeT) mechanism can also be used in the same manner ... 9 Figure 8. Dipole moment change upon excitation effects the interaction of molecule
with charged or polar species ... 10
Figure 9. ICT mechanism can be used to cause both blue and red shifts in spectra 11 Figure 10. An anthracene based AND gate ... 12 Figure 11. Non-selectivity is used to design an OR gate ... 13 Figure 12. Possible relaxation pathways for concerning INH gate ... 15 Figure 13. First XOR gate not relying on annihilating inputs along with the
absorption spectrum ... 16
Figure 14. First molecular half-adder ... 17 Figure 15. Lab-on-a-molecule idea demonstrates a striking application for
molecular logic ... 20
Figure 16. OR logic based drug release ... 20 Figure 17. A photodynamic therapy reagent controlled by an AND logic... 21
Figure 21. Synthesis of compound 4 ... 27
Figure 22. Synthesis of Ca2+ ligand tethered benzaldehyde ... 29
Figure 23. Synthesis of compound 5 ... 30
Figure 24. Synthesis of compound 6 ... 31
Figure 25. Synthesis of compound 7 ... 32
Figure 26. Target logic devices: AND gate, half-adder and three-input AND gate respectively ... 35
Figure 27. Molecule 1 is used as a reference in ITC experiments... 38
Figure 28. ITC titration curves of compound 4 in acetonitrile ... 39
Figure 29. ITC titration curves of reference compound 1 in acetonitrile ... 39
Figure 30. Benesi-Hildebrand analysis of fluorimetric Ca2+ titration data for compound 5. ... 40
Figure 31. Fluorescence emission of molecule 2 exhibits AND gate behavior ... 41
Figure 32. Emission intensities at 596 nm shown in bar-graphed truth table ... 42
Figure 33. Frontier orbitals for molecule 2... 43
Figure 34. Changes in the energy levels of the frontier orbitals... 44
Figure 35. Absorbance spectra for molecule 4 in the absence and presence of analytes ... 46
Figure 36. Absorbance intensities at 663 and 623 nm shown in bar-graphed truth table ... 47
Figure 37. Absorption spectrum for molecule 7 ... 48
Figure 38. Fluorescence emission of molecule 7 ... 49
Figure 39. Emission intensities at 656 nm shown in a bar-graphed truth table ... 50
Figure 40. Absorption spectra of 2 in the presence of Hg2+ and Zn2+ ... 57
Figure 41. Absorbance spectra of 4 with increasing Hg2+ concentrations. ... 58
Figure 42. Absorbance spectra of 4 with increasing Zn2+ concentrations ... 58
Figure 43. Emission spectra of compound 5 in the presence of various cations ... 59
Figure 44. Emission specta of compound 5 with increasing Ca2+ concentrations. . 59
Figure 46. ITC titration curves of compound 2 in acetonitrile ... 61
Figure 47. ITC titration curve of the reference crown compound. ... 62
Figure 48. 1H NMR spectrum of 1 ... 63 Figure 49. 13C NMR spectrum of 1 . ... 63 Figure 50. 1H NMR spectrum of 2 . ... 64 Figure 51. 13C NMR spectrum of 2 ... 64 Figure 52. 1H NMR spectrum of 3 ... 65 Figure 53. 13C NMR spectrum of 3 ... 65 Figure 54. 1H NMR spectrum of 4 ... 66 Figure 55. 13C NMR spectrum of 4 ... 66
Figure 56. 1H NMR spectrum of reference crown compound ... 67
Figure 57. 13 C NMR spectrum of reference crown compound ... 67
Figure 58. 1H NMR spectrum of 4 ... 68 Figure 59. 13C NMR spectrum of 5 . ... 68 Figure 60. 1H NMR spectrum of 6 ... 69 Figure 61. 13C NMR spectrum of 6 ... 69 Figure 62. 1H NMR spectrum of 7 ... 70 Figure 63. 13C NMR spectrum of 7 . ... 70
Figure 64. MALDI-TOF Mass spectrum of 2 ... 71
Figure 65. MALDI-TOF Mass spectrum of 3 ... 71
Figure 66. MALDI-TOF Mass spectrum of 4 ... 72
Figure 67. MALDI-TOF Mass spectrum of 5 ... 72
Figure 68. MALDI-TOF Mass spectrum of 6 ... 73
LIST OF TABLES
Table 1. All possible two-input Boolean Logic operations. ... 2
Table 2. Truth table for the OR logic ... 13
Table 3. Truth table for INH gate ... 14
Table 4. Truth table for XOR gate ... 15
Table 5. Truth table for a half-adder ... 17
Table 6. Truth table for a half-substractor ... 18
Table 7. Spectral data for target molecules... 36
Table 8. Binding constants for the relevant binding events. ... 37
LIST OF ABBREVIATIONS
ASTM : American Society for Testing and Materials Bodipy : Boradiazaindacene
DDQ : Dichlorodicyanoquinone DFT : Density Functional Theory DMF : Dimethylformamide EnT : Energy Transfer
HOMO : Highest Occupied Molecular Orbital ICT : Internal Charge Transfer
ITC : Isothermal Titration Calorimetry IYTE : İzmir Yüksek Teknoloji Enstitüsü LUMO : Lowest Unoccupied Molecular Orbital MALDI: : Matrix-Assisted Laser Desorption/Ionization
MS : Mass Spectroscopy
NMR : Nuclear Magnetic Resonance PeT : Photoinduced Electron Transfer
pMOS : Positive-Channel Metal Oxide Semiconductor TFA : Trifluoroacetic Acid
THF : Tetrahydrofuran
TLC : Thin Layer Chromotography TOF : Time of Flight
CHAPTER 1
INTRODUCTION
1.1 Supramolecular Chemistry: Quo Vadis?
Considering the Pedersen’s paper1 as the signal flare, not even half a century passed since the
beginning of supramolecular chemistry. Today, however, one of the pioneering names of the field, J. Fraser Stoddart argues2 the end of supramolecular chemistry –at least with its classical
understanding. His point can be summarized simply by saying: Lehn’s “chemistry of intermolecular bonds”3 once claimed much but achieved less. He notes we still have no
molecular device at hand that commercialized on a grand scale and offers a way out of this jam: to forsake simple systems for complex ones and to work with surfaces and interfaces rather than working with solution or solid phases2 –which he brands “another biology”. It is the dignity of science that there is no final authority. One –even a masters student- can disagree with this position of a pioneering professor and examine its validity. Another biology may even be possible. And if it is, it will probably have striking applications, even will create its own fields of application. But the crucial question is that, will it be possible to make two
different biologies to talk each other? Why should we forsake the possibility of supramolecular
chemistry that talks the same language as our bodies –ours and the whole biosphere’s- from the beginning?
The only viable answer could have been “because it is not possible!” Recently, however, promising works4,5 demonstrated the existence of such a possibility. These researches, on molecular logic gates, a relatively young subfield of supramolecular chemistry, seem to imply emergence of a much natural supramolecular chemistry than Professor Stoddard anticipated.
1.2 Logic Gates: Workhorses of Modern IT
6“…and of this I am fully assured, that no general method for the solution of questions in the
theory of probabilities can be established which does not explicitly recognize, not only the special numerical bases of the science, but also those universal laws of thought which are the basis of all reasoning, and which, whatever they may be as to their essence, are at least
mathematical as to their form.” says7 George Boole in a communication paper he sent to
Philosophical Magazine in 1853. These universal laws of thought he mentioned, today called Boolean logic, are the mathematical tools that structured modern information technology.
Table 1. All possible two-input Boolean Logic operations.
A B FALSE AND A NOT B A B NOT A B XOR OR
0 0 0 0 0 0 0 0 0 0
0 1 0 0 0 0 1 1 1 1
1 0 0 0 1 1 0 0 1 1
1 1 0 1 0 1 0 1 0 1
A B NOR XNOR NOT B A → B NOT A B → A NAND TRUE
0 0 1 1 1 1 1 1 1 1 0 1 0 0 0 0 1 1 1 1 1 0 0 0 1 1 0 0 1 1 1 1 0 1 0 1 0 1 0 1 INPUTS OUTPUTS INPUTS OUTPUTS
Boolean logic constructs the operational basis of all digital computers since the first examples built during World War II, immutably. What is changed during the course of time is mainly size, cost and energy consumption of the elements that actually performs the logic operations –logic gates. An important landmark in this change of logic gate architecture is production of first silicon-based semiconductor8 at Texas Instruments in 1954. Modern logic gates are implemented electronically using silicon-based semiconductor technology for almost sixty years, which achieved thirty thousand-fold miniaturization in terms of weight9, six thousand times less energy consumption10 and even enhancements in processor speed.
Miniaturization, still, is a consistently pressing demand of IT market and it followed a regular trend until recently as Intel cofounder Gordon E. Moore predicted13 in 1965 “for at least ten years” (Figure 2). Around 2020, however, current technology is expected to hit a dead-end in terms of miniaturization due to quantum tunneling effect14 and chip manufacturers started to plan post-transistor era of logic gates. Away from commercialization yet, molecular logic
Figure 2. CPU transistor counts 1971-2004 and Moore’s Law15
1.2.1 Molecular Logic Gates: Computing at the Bottom
One of the topics Feynman debuted in his famous speech “There is plenty of
room at the bottom” was miniaturizing the computer16: “I don't know how to do this on a small scale in a practical way, but I do know that computing machines are very large.” We still do not know a practical way, but since the seminal paper17 of P. A. de Silva has been published in Nature in 1993, we have some ideas. One of the various AND gate architectures presented in this paper is shown in Figure 3 along with the truth table, that responds to Na+ and H+ cations
Figure 3. First two-input molecular logic device designed by de Silva along
with truth table adapted fluorescence measurements
Such systems with optical output signals are, not exclusively but widely preferred in molecular logic gates studies. Fluorescent logic gates are the main concern of this thesis and in order to explain the working principles, fluorescence and mechanisms of its modulation will be covered briefly before further development.
1.2.2 Basics of Fluorescence
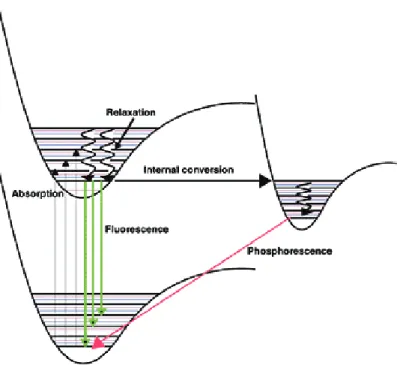
Light emission from any substance is called luminescence and it is formally divided into two categories as fluorescence and phosphorescence. This distinction is based on the nature of light-emitting electronic excited state. If the excited state is a singlet one, since the excited electron is paired to an electron in the ground state, relaxation occurs rapidly. The term fluorescence is coined18 for this process by G. G. Stokes in 1852. Typical lifetime for an excited fluorophore is about 10 ns19. For triplet excited states, however, since transitions to the ground state are spin-forbidden, emission rates are much slower compared to fluorescence. These transitions are called phosphorescence.
Figure 4. Jablonski diagram showing fluorescence and phosphorescence
An excited chromophore is very likely to relax non-radiatively to the vibrational ground of electronic excited state prior to the luminescence. This loss of energy, shown with squiggly arrows in Figure 4, causes a red-shifted emission spectrum when compared to the absorption spectrum and called Stokes shift18.
Most important characteristics of a fluorophore, perhaps, are wavelength of the absorption maximum, quantum yield and lifetime. Absorption maximum is directly dependent on energy difference between excited and ground states. Energy difference can be engineered by means of chemical modification on the fluorophore, at least to some level. Also non-covalent and reversible interactions can be used to modulate absorption/emission wavelength.
Quantum yield is defined as the fraction of photons re-emitted after being absorbed. Higher quantum yield means higher intensity, i.e.brighter
modulation mechanisms are very common in fluorescent logic gates and will be covered briefly.
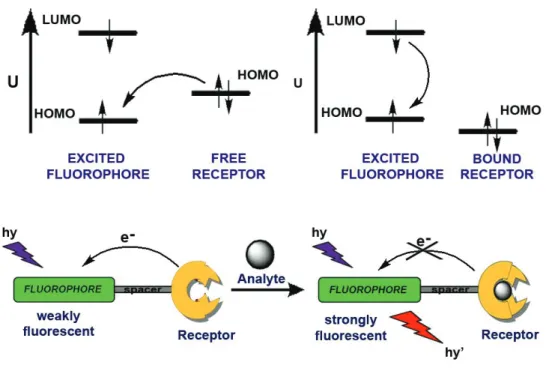
1.2.3 Photoinduced Electron Transfer
In certain cases, before relaxation occurs, excited molecule can transfer an electron from some potential donor to fill its low-lying empty orbital. This process has been studied well due to its major role in photosynthesis20 and is called photoinduced electron transfer (PeT).
Figure 5. Schematical representation that shows reversible control of PeT
process, hence fluorescence
Photoinduced electron transfer blocks the usual relaxation pathway of excited fluorophore and quenches emission. If PeT-donor orbital that gave electron to the excited fluorophore can be controlled (i.e. somehow stabilized to make PeT thermodynamically less favored and destabilized again), an on-off type control over the fluorescence emission will be gained. Accordingly, architectures that
integrate a fluorophore and a PeT-donor receptor used widely in chemosensor designs21-25 (Figure 5).
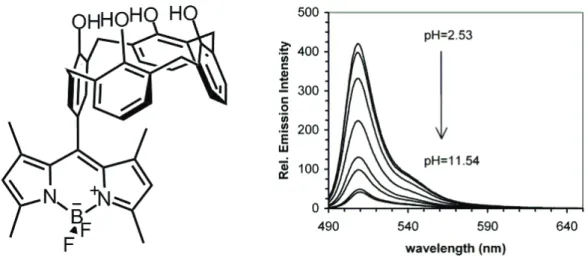
In one of these works23, presented by Akkaya, a bodipy fluorophore is attached to calix[4]arene unit, which is a PeT-donor due to oxygen lone-pairs. Upon protonation of these oxygens, PeT is made less favorable. Thus more than 10-fold change in fluorescence signal is observed with changing pH. (Figure 6)
Figure 6. Fluorescence intensity of Bodipy is controlled via a pH sensitive PeT
donor
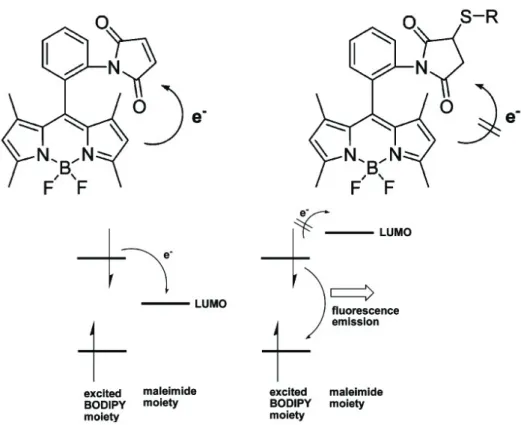
Another example22, reported by Nagano, contains a slightly different mechanism of PeT, called donor-excited PeT (d-PeT). In this mechanism, electron transfer occurs from excited fluorophore to some empty orbital of an acceptor, in contrast with the usual PeT mechanism (Figure 7). Nagano’s work is a thiol sensor, which utilizes a maleimide moiety as PeT acceptor and bodipy as the fluorophore again. Maleimide reacts with thiols irreversibly and 350-fold increase in fluorescence signal achieved.
Figure 7. Reverse PeT (d-PeT) mechanism can also be used in the same
manner
Synthesizing also meta- and para-maleimide bound structures, Nagano group studied the effect of distance between donor and acceptor on PeT efficiency. O-maleimide came out to be 185 times more efficient PeT acceptor than meta-maleimide and 270 times more efficient then para-meta-maleimide22.
Photoinduced electron transfer drew attention since it can be controlled by reversible interactions and provides a sharp change in emission intensity that is virtually an on-off type of control.
1.2.4 Internal Charge Transfer
Another mechanism used to manipulate fluorescence characteristics of a fluorophore is called Internal Charge Transfer (ICT). Principles of ICT were first appeared26 in effort of rationalizing increased acidity of phenol. However, until Valeur27-29, generalization of these ideas and systematic exploitation in
metal-sensing was not realized. ICT caused by solvent – chromophore interactions has been studied widely. In this study, however, it will be omitted and focus will be given on the applications of ICT in ion sensing phenomena only. As pictured in Figure 8 in a simplified manner, analyte binding can cause different energetic behavior in ground and excited states, and in turn spectral shifts, due to dipole moment change of the fluorophore upon excitation.
Figure 8. Dipole moment change upon excitation effects the interaction of
molecule with charged or polar species
Spectral shift can be bathochromic or hypsochromic depending on the nature of supramolecule. In 2008, Akkaya et al. reported30 two similar structures based on bodipy dyes, which responds in an opposite direction upon proton binding. This contradiction is based upon a clever design trick: As shown in Figure 9, one of these molecules contain aniline moiety as receptor, which is an electron donor in its free form while other contains pyridine a rather electron-withdrawing moiety. Hence, two molecules have dipole moments pointing opposite directions in excited state and behave oppositely in their bound form.
Figure 9. ICT mechanism can be used to generate both blue and red shifts in
spectra
A spectral shift caused by ICT is not “as digital as” blocking and unblocking of an emission via PeT, at least at first glance. That’s why most of the successful logic systems functioned via PeT until Akkaya’s work31 at Organic Letters broke the monopoly and yielded32 the idea of wavelength-reconfigurable logic gates.
1.2.5 Basic Logic Gates at Molecular Level
Information processing at molecular level requires molecules that perform logic operations. This requirement attracted interest of scientists, especially in the last two decades. Since the aforementioned first achievement17 of de Silva, many other systems have been designed that perform most simple logic operations33-36. In this section AND, OR, INHIBIT (INH) and exclusive OR (XOR) gates will be introduced with examples from literature.
1.2.5.1 AND Gate
An AND logic is one that gives an output signal if and only if both two of the inputs are positive. There are many published examples37-46 of molecular AND gates in the literature. One example for this gate is shown in Figure 10 from de Silva’s work44.
Figure 10. An anthracene based AND gate
In this particular example, anthracene chromophore is installed with two different PeT donors, one of which senses proton and other Na+ cations. Only in the presence of both proton and Na+/K+ cations, PeT pathways for both of these donors are blocked and fluorescence emission above a threshold is observed.
OR gate, which responds two different targets in the same way, is probably the
easiest one to be implemented chemically. Truth table for the OR gate is shown below (Table 2).
Table 2. Truth table for the OR logic
INPUT 1 INPUT 2 OUTPUT
0 0 0
0 1 1
1 0 1
1 1 1
An example47 of molecular OR gate is shown in Figure 11 that works on the basis of PeT phenomenon. Tricarboxylic acid moiety can bind virtually non-selectively to Ca2+ and Mg2+ cations which constitutes OR characteristic of fluorescence emission.
Figure 11. Non-selectivity is used to design an OR gate
1.2.5.3 Inhibit (INH) Gate
In the inhibit logic, output signal can be inhibited by one of the inputs. This logic demonstrates non-commutative behavior –gate responds asymmetrically to the inputs- and can be obtained using a NOT and a AND gate. Table 3 shows the truth table for INH gate.
Table 3. Truth table for INH gate
INPUT 1 INPUT 2 OUTPUT
inhibitor input output
0 0 0
1 0 0
0 1 1
1 1 0
One48 of the many examples48-55 of published INH gates is shown in Figure 12 with relevant photophysical processes. In this work of Pischel group, luminescence Eu3+ is monitored as output signal. Eu3+ has a low extinction coefficient but can be efficiently excited by energy transfer from triplet state of amino-substituted 1,8-naphthalimide. In the presence of O2, concerning triplet state is quenched before it transfers energy to Eu3+ cation and luminescence is inhibited. It is interesting to note that Eu3+ cation itself, which is the source of luminescence, is assigned as one of the inputs.
1.2.5.4 Exclusive OR (XOR) Gate
Exclusive OR gate acts in the same way as the logical “either”: there is an output signal if either, but not both, of the inputs are present. Another way of looking at this logic element is to say that there is an output only if two inputs are different (Table 4).
Table 4. Truth table for XOR gate
INPUT 1 INPUT 2 OUTPUT
0 0 0
0 1 1
1 0 1
1 1 0
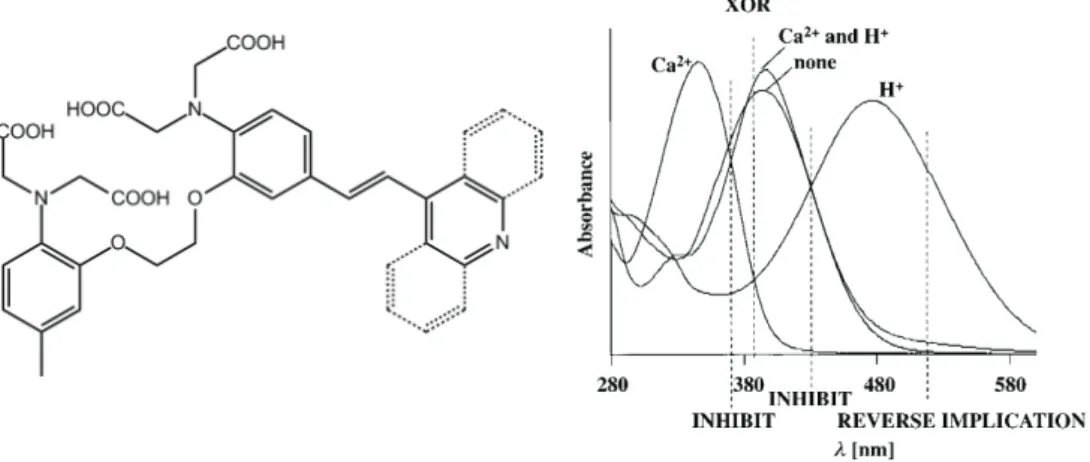
XOR behavior is one of the hardest logic behaviors to mime at molecular level. There are several literature examples56-58 that are not a single molecule but a mixture or a supramolecular assembly. Also using two annihilating inputs –such as acid and base- is a common trick59-63 of architecturing a molecular XOR gate. De Silva group, again, achieved the first single-molecular XOR gate64 that is not based on annihilation of inputs. Their design, shown in Figure 13, contains four carboxylic acid groups capable of binding Ca2+ and a pyridine moiety that binds to proton. Effects of Ca2+ and H+ addition, to the absorption spectrum, via ICT are also shown in Figure 13.
Figure 13. First XOR gate not relying on annihilating inputs along with the
absorption spectrum
1.2.6 Towards and Beyond the Molecular Arithmetics
Implementing basically all logic operations chemically raised the bar of expectation for more complex digital operations. Most obvious operation of that kind is arithmetic processing of binary data and performed by half-adders and half substractors.
1.2.6.1 Molecular Half-Adder
A half-adder65-73 performs addition of two bits and can be obtained by concatenation of an AND gate and an XOR gate working in parallel. Truth table for this operation is shown in Table 5.
1 2 AND XOR 0 0 0 0 0 1 0 1 1 0 0 1 1 1 1 0 OUTPUT INPUT
First molecular half-adder, is reported74 by de Silva in 2000. In this work, rather than combining two gates in a molecule or in a supramolecule, two molecules which separately mimic AND and XOR logics used in a mixture.
In 2005, Shanzer group published75 first unimolecular example of half-adder on a surprisingly simple platform: fluorescein. Different protonation states of the fluorescein molecule (shown in Figure 14) exhibit significant spectral differences. This provide the possibility for extraction of various gate behaviours from distinct parts of spectrum (i.e. wavelength-reconfigurable logic, defined in section Internal Charge Transfer). In the mentioned work, Shanzer and coworkers demonstrated that absorption spectrum of fluorescein exhibits
XOR behavior at 447 nm and AND behavior at 501 nm.
1.2.6.2 Half-Substractor
Another obvious arithmetic operation, taking difference of two bits, is performed by half-substractor (Table 6). A half-substractor also can be obtained by two parallel working simple logic gates, INH and XOR gates this time.
Table 6. Truth table for a half-substractor
1 2 INH XOR 0 0 0 0 0 1 1 1 1 0 0 1 1 1 0 0 OUTPUT INPUT
First76 of many molecular half-substractor examples77-81 is achieved in Langford Laboratory. Langford and coworkers studied tetraphenylporphyrin as the gate, and used acid-base annihiliating inputs. Soret band of porphyrine localized at 417 nm shifts above 425 nm in presence of acid or base, hence exhibits XOR behavior. On the other hand cationic form –which exists in acidic media- is strongly fluorescent at 405 nm. This emission can be read as INH gate.
Full-adders and full-substractors take three input, yield two output bits and fundemantally achieve the highest complexity of arithemetic operations. There are several published examples82-85 of those kind molecular devices operating on the same basis. Molecular keypad lock86, multiplexer87 – demultiplexer88, sequential logic and molecular information storage89,90 are several other examples of studied so far.
1.2.7 Ready-to-use implications of Molecular Logic
Mostly due to input-output heterogeneity and difficulties in individual addressability, integration of molecular logic gates to perform more complex digital operations is still a problem. According to Akkaya, however, “it may be challenging to integrate two molecular logic gates; however, they can be easily integrated into the control processes of healthy or pathological biochemistry”. Pointing this out, in his communication paper4 published in 2008 he claims “chemical logic systems are inherently more capable than they are given credit for, and, the potential of the chemical logic gates is yet largely untapped”. One of the early ideas on this subject emerged in a 2005 paper94 of de Silva published in the Journal of the American Chemical Society. In his paper, de Silva, suggested a three input AND gate (Figure 15) in which an anthracene moiety is used as the fluorophore and a benzo-15-crown-5, a tertiary amine and a phenyliminodiacetate are used as PeT donor receptors, to signal Na+, H+ and Zn2+, respectively. The idea debuted in this work is that, such a design can be considered as a “lab-on-a-molecule”, which responds to threshold values to three different symptoms of a disease. That would replace three separate clinical tests and their analysis with a single and simple test.
Figure 15. Lab-on-a-molecule idea demonstrates a striking application for
molecular logic
(Figure 16), which releases the active anticancer drug doxorubicin in presence of
antibody 38C2 or penicillin G amidase. It is interesting to note that output of
this molecular logic device is also chemical: a molecule of doxorubicin.
Figure 16. OR logic based drug release
A recent work is aforementioned paper4 of Akkaya, in which an AND gate implemented photodynamic therapy reagent has been debuted. This reagent (Figure 17) produces singlet O2 sensitive to Na+ (which blocks PeT donor tethered at meso position) and H+ (which causes a red shift via ICT mechanism) concentrations which is high in tumor cells.
CHAPTER 2
EXPERIMENTAL PROCEDURES
2.1 General
1H NMR and 13C NMR spectra were recorded on Bruker DPX-400 (operating at 400 MHz for 1H NMR and 100 MHz for 13C NMR) in CDCl3 with tetramethylsilane as internal standard. All spectra were recorded at 25 oC and coupling constants (J values) are given in Hz. Chemical shifts are given in parts per million (ppm). All the 13C spectra were recorded with simultaneous decoupling of proton nuclei. Mass spectroscopy data were acquired using Bruker Autoflex-III (smartbeam) MALDI TOF/TOF system at IYTE Chemistry Department, Izmir, Turkey. Varian Cary-100 spectrophotometer is used to record absorption spectra. For fluorescence measurements Varian Eclipse spectrofluorometer was used. Reactions were monitored by thin layer chromatography using Merck TLC Silica gel 60 F254. Silica gel column chromatography was performed over Merck Silica gel 60 (particle size: 0.040-0.063 mm, 230-400 mesh ASTM). All other reagents and solvents were purchased from Aldrich and used without further purification. 4,4-difluoro-8-phenyl-1,3,5,7-tetramethyl-4-bora-3a,4a-diaza-s-indacene95 and 4-(1,4-dioxa-7,13-dithia-10-azacyclopentadecan-10-yl) benzaldehyde96 were synthesized according to literature. Isothermal titration calorimetry experiments were performed on a iTC-200 microcalorimeter (Microcal Inc., Northampton, MA). All solutions were prepared in spectroscopic grade CH3CN. For a typical ITC run, the instrument chamber (200 μL) contained a solution of a ligand (0.1 – 0.5 mM) while a 1.0 – 5.0 mM solution of Zn(ClO4)2 or Hg(ClO4)2 was taken up in a 40 μL injection syringe. The syringe was assembled into the chamber for equilibration while stirring at 1000 rpm. The chamber temperature was set to 25 °C. The injections were programmed at 1 μL each, added over 2 sec and spaced 2 min apart. Association enthalpy (ΔH° in cal/mol), “number of sites” (N), and
association constant (K in M-1) were obtained by fitting the titration data using the “One (Two) Set of Sites model” algorithm provided in the MicroCal Origin Software package (version 7.0). Association entropy (ΔS in cal/mol K) is calculated from fitted values of ΔHº and K.
2.2 Synthesis of target molecule 2
2.2.1 Synthesis of Compound 1.
Figure 18. Synthesis of compound 1
To a 1.0 L round-bottomed flask containing 400 mL argon-degassed CH2Cl2 2,4-dimethyl pyrrole (4.4 mmol, 0.4 g), 4-(N,N-di-(pyridine-2-ylmethyl)amino) benzaldehyde95 (1.98 mmol, 0.6 g) and one drop of trifluoroacetic acid were added. The solution was stirred under N2 at room temperature for 1 day. After addition of a solution of DDQ (1.98 mmol, 0.45 g) in 100 mL of CH2Cl2 to the reaction mixture, stirring was continued for 30 min. 6 mL of Et3N and 5 mL of BF .OEt were successively added and after 30 min, the reaction mixture was
(0.25 g, 23%). 1H NMR (400 MHz, CDCl
3): δH 8.60 (2H, d, J = 6.48 Hz, ArH), 7.62 (2H, t, J = 7.71 Hz, ArH), 7.22 (2H, d, J = 7.84 Hz, ArH), 7.18 (2H, t, J = 6.58 Hz, ArH), 6.98 (2H, d, J = 8.80, ArH), 6.80 (2H, d, J = 8.80, ArH), 5.95 (2H, s, ArH), 4.87 (4H, s, CH2), 2.52 (6H, s, CH3), 1.45 (6H, s, CH3); 13C NMR (100 MHz, CDCl3): δC 158.3, 154.8, 149.8, 149.7, 148.8, 143.1, 136.7, 128.9, 123.3, 122.2, 120.9, 113.2, 57.4, 14.5 ppm. Anal. Calcd. for C31H30BF2N5: C 71.41, H 5.80, N 13.43. Found: C 71.33, H 5.89, N 13.12 %.
2.2.2 Synthesis of Compound 2.
Figure 19. Synthesis of compound 2
40 mL of benzene, compound 1 (0.15 mmol, 80 mg), 4-(1,4-dioxa-7,13-dithia-10-azacyclopentadecan-10-yl) benzaldehyde95 (0.15 mmol, 54 mg), acetic acid (0.2 mL), and piperidine (0.2 mL) were mixed in a 100 mL round-bottomed flask and refluxed with Dean-Stark apparatus. Reaction mixture was stirred almost until all solvent evaporized. Progress of the reaction was monitored by TLC (1:1 Hexanes : Acetone). After consumption of starting materials, water (100 mL) was added and mixture was extracted into CHCl3. Organic layer was
dried on Na2SO4 and evaporated. Column chromatographic separation (silica gel, 1:1 Hexanes : Acetone) of the residue yielded the desired product as a dark blue solid. (25 mg, 20%). 1H NMR (400 MHz, CDCl
3): δH 8.62 (2H, d, J = 5.72 Hz, ArH), 7.65 (2H, t, J = 8.54 Hz, ArH), 7.50-7.43 (3H, m: 2H, ArH; 1H, CH), 7.26-7.15 (5H, m: 4H, ArH; 1H, CH), 7.03 (2H, d, J = 8.60 Hz, ArH), 6.80 (2H, d, J = 8.68 Hz, ArH), 6.62 (2H, d, J = 8.96, ArH), 6.58 (1H, s, ArH), 5.90 (1H, s, ArH), 4.88 (4H, s, CH2), 3.82 (4H, t, J = 4.98 Hz, OCH2CH2S), 3.70-3.62 (8H, m, 4H, NCH2CH2S, 4H, OCH2CH2O), 2.90 (4H, t, J = 7.86 Hz, OCH2CH2S), 2.78 (4H, t, J = 5.05 Hz, NCH2CH2S), 2.58 (6H, s, CH3), 1.48 (3H, s, CH3), 1.44 (3H, s, CH3); 13C NMR (100 MHz, CDCl3): δC 158.4, 153.0, 149.8, 149.0, 148.7, 139.0, 136.7, 129.5, 129.3, 126.0, 125.2, 122.1, 120.9, 120.7, 117.0, 115.0, 113.1, 111.8, 74.3, 70.7, 57.5, 51.9, 31.3, 29.6, 14.8, 14.7 ppm. Anal. Calcd. for C48H53BF2N6O2S2: C 67.12, H 6.22, N 9.78 %. Found: C 66.98, H 6.34, N 9.70 %. MS (MALDI-TOF): m/z: Calcd. For C48H53BF2N6O2S2: 858.4 [M+], Found: 858.1[M+].
2.3 Synthesis of Half adder 4.
2.3.1 Synthesis of Compound 3.
Figure 20. Synthesis of compound 3
40 mL of benzene, 4,4-difluoro-8-phenyl-1,3,5,7-tetramethyl-4-bora-3a,4a-diaza-s-indacene (0.37 mmol, 0.12 g), 4-(N,N-di-(pyridine-2-ylmethyl)amino) benzaldehyde95 (0.37 mmol, 0.11 g), acetic acid (0.2 mL), and piperidine (0.2 mL) were mixed in a 100 mL round-bottomed flask and refluxed with Dean-Stark apparatus. Reaction mixture was stirred almost until all solvent evaporized. Progress of the reaction was monitored by TLC (Ethyl acetate : Methanol ; 97:3). After consumption of starting materials, water (100 mL) was added and mixture was extracted into CHCl3. Organic layer was dried on Na2SO4 and evaporated. Column chromatographic separation (silica gel, Ethyl acetate : Methanol ; 97 : 3) of the residue yielded desired product as a dark blue solid (53mg, 24%). 1H NMR (400 MHz, CDCl
3): δH 8.61 (2H, d, J = 5.72 Hz, ArH), 7.65 (2H, t, J = 8.48 Hz, ArH), 7.50-7.40 (6H, m: 3H, ArH; 2H, ArH; 1H, CH), 7.30-7.22 (4H, m: 2H, ArH; 2H, ArH), 7.20-7.12 (3H, m: 2H, ArH; 1H, CH), 6.72 (2H, d, J = 8.21 Hz, ArH), 6.57 (1H, s, ArH), 5.95 (1H, s, ArH), 4.88
(4H, s, CH2), 2.55 (6H, s, CH3), 1.41 (3H, s, CH3), 1.39 (3H, s, CH3); 13C NMR (100 MHz, CDCl3): δC 158.9, 158.2, 154.3, 153.5, 149.8, 149.7, 142.7, 141.3, 139.2, 136.9, 136.8, 135.3, 129.2, 129.0, 128.8, 125.9, 122.2, 122.0, 120.8, 117.6, 117.2, 115.3, 112.7, 57.3, 14.6, 14.5, 14.2 ppm. Anal. Calcd. for C38H34BF2N5: C 74.88, H 6.62, N 11.49 %. Found: C 74.91, H 6.73, N 11.40 %. MS (MALDI-TOF): m/z: Calcd. For C38H34BF2N5: 609.3 [M+], Found: 608.9 [M+].
2.3.2 Synthesis of Compound 4.
Figure 21. Synthesis of compound 4
40 mL of benzene, 3 (0.08 mmol, 50 mg), 4-(1,4-dioxa-7,13-dithia-10-azacyclopentadecan-10-yl) benzaldehyde96 (0.08 mmol, 28.4 mg), acetic acid (0.2 mL), and piperidine (0.2 mL) were mixed in a 100 mL round-bottomed flask and refluxed with Dean-Stark apparatus. Reaction mixture stirred almost until all solvent evaporized. Progress of the reaction was monitored by TLC
as a green solid. (25 mg, 28%). 1H NMR (400 MHz, CDCl
3): δH 8.63 (2H, d, J = 3.16 Hz, ArH), 7.67 (2H, t, J = 7.26 Hz, ArH), 7.58-7.44 (9H, m: 3H, ArH; 2H, ArH; 2H, ArH; 2H, CH), 7.35-7.28 (3H, m: 2H, ArH; 1H, CH), 7.24-7.13 (4H, m: 2H, ArH; 2H, ArH), 7.05 (1H, d, J = 15.3 Hz, CH), 6.74 (2H, d, J = 8.40 Hz, ArH), 6.65 (2H, d, J = 8.45, ArH), 6.59 (1H, s, ArH), 6.57 (1H, s, ArH), 4.90 (4H, s, CH2), 3.74 (4H, t, J = 4.62 Hz, OCH2CH2S), 3.75-3.62 (8H, m, 4H, NCH2CH2S, 4H, OCH2CH2O), 2.92 (4H, t, J = 3.88 Hz, OCH2CH2S),
2.78 (4H, t, J = 4.50 Hz, NCH2CH2S), 2.58 (6H, s, CH3), 1.42 (6H, s, CH3); 13C NMR (100 MHz, CDCl3): δC 158.3, 153.1, 152.3, 149.9, 149.7, 148.7, 147.6, 141.2, 140.8, 136.9, 136.5, 136.3, 135.6, 135.5, 129.4, 129.1, 128.9, 128.6, 126.3, 125.2, 124.8, 122.6, 122.2, 122.9, 117.3, 117.1, 115.8, 115.0, 112.7, 112.0, 111.8, 74.3, 70.7, 57.3, 52.0, 31.3, 29.7, 14.6, 14.5 ppm. Anal. Calcd. for C55H57BF2N6O2S2: C 69.75, H 6.07, N 8.87 %. Found97: C 69.68, H 6.15, N 8.79 %. MS (MALDI-TOF): m/z: Calcd. For C55H57BF2N6O2S2: 946.4 [M+], Found: 946.2 [M+].
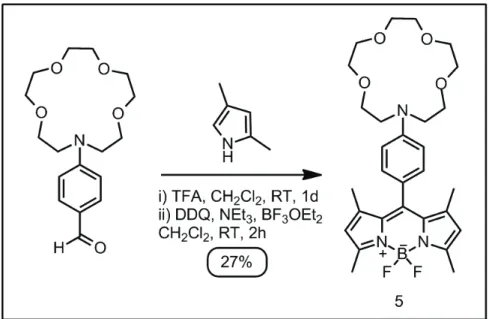
2.4 Synthesis of Three Input AND Logic 7.
2.4.1 Synthesis of
4-(1,4,7,10-tetraoxa-13-azacyclopentadecan-13-yl)benzaldehyde
Figure 22. Synthesis of Ca2+ ligand tethered benzaldehyde
To a cooled (0°C) solution of anhydrous DMF (10mL), 4 mmol POCl3 (0.615 g) was added within 5 min. The mixture was stirred for 30 min at room temperature, then 13-phenyl-1,4,7,10-tetraoxa-13-azacyclopentadecane98 (3.4 mmol, 1 g) was added and the resulting mixture was heated for 5h at 80°C. A dark brown solution formed. Cold water was slowly added onto this solution and then it is neutralized with K2CO3. The product was extracted with CH2Cl2 and dried over anhydrous Na2SO4. The solvent was evaporated and the residue was purified by silica gel column chromatography using CHCl3 : Methanol (95: 5) as the eluant. Yellowish viscous liquid (0.7 g, 64%). 1H NMR (400 MHz, CDCl3): δH 9.72 (1H, s), 8.78 (2H, d, J = 8.84 Hz, ArH), 6.80 (2H, d, J = 8.96 Hz, ArH), 3.83 (4H, t, J=6.16), 3.70-3.56 (16H, m); 13C NMR (100 MHz, CDCl3): δC 190.0, 152.4, 132.0, 125.2, 111.0, 71.2, 70.3, 70.0, 68.1, 52.8 ppm. Anal. Calcd. for C17H25NO5: C 63.14, H 7.79, N 4.33 %. Found: C 63.18, H 7.85, N 4.19 %.
Figure 23. Synthesis of compound 5
To a 1L round-bottomed flask containing 400 mL argon-degassed CH2Cl2 2,4-dimethyl pyrrole (3.41 mmol, 0.324 g), 4-(1,4,7,10-tetraoxa-13-azacyclopentadecan-13-yl)benzaldehyde (1.55 mmol, 0.5 g) and one drop of trifluoroacetic acid were added. The solution was stirred under N2 at room temperature for 1d. After addition of a solution of DDQ (1.60 mmol, 0.363 g) in 100 mL of CH2Cl2 to the reaction mixture, stirring was continued for 30 min. 6 mL of Et3N and 5 mL of BF3. Oet2 were successively added and after 30 min, the reaction mixture was washed with water (3 x 300 mL) and dried over anhydrous Na2SO4. The solvent was evaporated and the residue was purified by silica gel column chromatography using CHCl3 : Methanol (95 : 5) as the eluant. Orange solid (0.225 g, 27%). 1H NMR (400 MHz, CDCl
3): δH 7.01 (2H, d, J = 7.92 Hz, ArH), 6.73 (2H, d, J = 8.12 Hz, ArH), 6.94 (2H, s, ArH), 3.80 (4H, t,
J=5.64), 3.73-3.60 (16H, m) 2.52 (6H, s, CH3), 1.50 (6H, s, CH3); 13C NMR (100 MHz, CDCl3): δC 154,7, 148.2, 143.2, 132.2, 130.7, 128.9, 121.8, 120.8, 111.6, 110.7, 71.3, 70.2, 70.0, 68.5, 52.6, 14.8, 14.5 ppm. Anal. Calcd. for C29H38BF2N3O4: C 64.33, H 7.07, N 7.76 %. Found: C 64.28, H 7.16, N 7.70 %. MS (MALDI-TOF): m/z: Calcd. For C29H38BF2N3O4: 541.3 [M+], Found: 541.9 [M+].
2.4.3 Synthesis of Compound 6
Figure 24. Synthesis of compound 6
40 mL of benzene, compound 5 (0.37 mmol, 200 mg), 4-(1,4-dioxa-7,13-dithia-10-azacyclopentadecan-10-yl)-benzaldehyde96 (0.33 mmol, 118 mg), acetic acid (0.2 mL), and piperidine (0.2 mL) were mixed in a 100 mL round-bottomed flask and refluxed with Dean-Stark apparatus. Reaction mixture was stirred almost until all solvent evaporized. Progress of the reaction was monitored by TLC (eluent: Ethyl acetate). After consumption of starting materials, water (100 mL) was added and mixture was extracted into CHCl3. Organic layer was dried on Na2SO4 and evaporated. Column chromatographic separation (silica gel, eluent: Ethyl acetate) of the residue yielded the desired product as a dark blue solid. (80 mg, 25%). 1H NMR (400 MHz, CDCl
3): δH 7.54-7.42 (3H, m: 2H, ArH; 1H, CH), 7.18 (1H, d, J = 16.10 Hz, CH), 7.05 (2H, d, J = 8.60 Hz, ArH),
130.8, 129.7, 129.4, 129.3, 125.0, 123,5 122.2, 120.2, 117.2, 114.8, 111,8, 111.6, 74.2, 71.3, 70.7, 70.2, 70.0, 68.5, 52.6, 51.9, 31.6, 31.3, 30.3, 29.6, 15.1, 14.7 ppm. Anal. Calcd. for C46H61BF2N4O6S2: C 62.86, H 7.00, N 6.37 %. Found: C 63.01, H 7.14, N 6.40 %. MS (MALDI-TOF): m/z: Calcd. For C46H61BF2N4O6S2: 878.4 [M+], Found: 878.2 [M+].
2.4.4 Synthesis of Compound 7
Figure 25. Synthesis of compound 7
40 mL of benzene, 6 (0.06 mmol, 50 mg), 4-(N,N-di-(pyridine-2-ylmethyl)amino)benzaldehyde95 (0.12 mmol, 36.40 mg), acetic acid (0.2 mL), and piperidine (0.2 mL) were mixed in a 100 mL round-bottomed flask and refluxed with Dean-Stark apparatus. Reaction mixture stirred almost until all solvent evaporized. Progress of the reaction was monitored by TLC (Ethyl acetate : Methanol ; 90 : 10). After consumption of starting materials, water (100 mL) was added and mixture was extracted into CHCl3. Organic layer was dried on Na2SO4 and evaporated. Column chromatographic separation (silica gel, Ethyl acetate : Methanol ; 90 : 10) of the residue yielded the desired product as a green solid. (33 mg, 50%). 1H NMR (400 MHz, CDCl3): δH 8.61 (2H, d, J
= 5.68 Hz, ArH), 7.67 (2H, t, J = 3.89 Hz, ArH), 7.57-7.47 (4H, m: 2H, ArH; 2H, CH), 7.46 (2H, d, J = 8.80 Hz, ArH), 7.28 (2H, d, J = 8.67 Hz, ArH), 7.24-7.15 (3H, m: 2H ArH; 1H CH), 7.12 (1H, d, J = 15.90 Hz, ArH), 7.06 (2H, d, J = 8.54, ArH), 6.76-6.70 (4H, m, ArH), 6.65 (2H, d, J = 9.00 Hz, ArH), 6.59 (1H, s, ArH), 6.56 (1H, s, ArH), 4.89 (4H, s), 3.85-3.76 (8H, m), 3.72-3.58 (24H, m), 2.92 (4H, t, J = 7.92 Hz), 2.76 (4H, t, J = 4.94 Hz), 1.52 (6H, s); 13C NMR (100 MHz, CDCl3): δC 158.3, 149.8, 149.7, 147.4, 136.9, 135.7, 129.6, 129.3, 129.0, 126.5, 125.3, 122.2, 122.0, 120.9, 112.7, 111.8, 111.5, 74.3, 71.3, 70.7, 70.2, 70.0, 68.6, 57.3, 52.6, 51.9, 38.7, 31.6, 31.3, 30.3, 29.6, 28.9, 15.0, 14.9 ppm. Anal. Calcd. for C65H76BF2N7O6S2: C 67.05, H 6.58, N 8.42 %. Found: C 66.91, H 6.64, N 8.33 %. MS (MALDI-TOF): m/z: Calcd. For C65H76BF2N7O6S2: 1163.5 [M+], Found: 1163.3 [M+].
2.5 UV-Vis Titration Experiments
Titrations of compound 4 with Zn2+ ion : 100 μL portions of 0.16 mM stock solution of 4 were diluted to 2 mL by adding acetonitrile (to 3.2 x 10⁻⁶ M) and to these solutions aliquots of Zn(Otf)2 solutions (0.1 mM) in acetonitrile (0, 160, 320, 480, 640, 800, 960, 1120, 1280, 1600 μL) were added. Volumes of these solutions were adjusted to 5 mL. UV-vis absorption spectra were recorded at room temperature.
Titrations of 4 with Hg(II) ion : 100 μL portions of 0.16 mM stock solution of 4 were diluted to 2 mL by adding acetonitrile (to 3.2 x 10⁻⁶ M) and to these solutions were added aliquots of Hg(ClO4)2 solutions (0.1 mM) in acetonitrile (0, 320, 1280, 1440, 1600 μL). Volumes of these solutions were adjusted to 5 mL. UV-vis absorption spectra were recorded at room temperature.
of a reaction. The experiments are performed at constant temperature by titrating one binding partner (the titrant) into a solution containing the other partner (the titrand). After each aliquot of titrant is added, the heat absorbed or released by its reaction with the titrand is measured with respect to a reference cell containing buffer. The heat change is measured in electrical power (J/s) as it is the difference in power needed to maintain the sample and reference cells at two similar temperatures. Binding Constant (Kb), Reaction Stoichiometry (n), Heat of Reaction (ΔH) and Entropy of Reaction (ΔS) can be obtained via ITC.
CHAPTER 3
RESULTS & DISCUSSION
3.1 Precise Control of PeT and ICT Processes
Considering their size, reconfigurability and especially bio-integrability, molecular logic devices are promising information processing units. In this research, Bodipy-derived fluorophores have been used to construct an AND gate (molecule 2 in Figure 26), a half-adder (molecule 4), and a three-input AND gate (molecule 7). Having remarkable properties such as large extinction coefficient and high quantum yield, Bodipy dyes are widely preferred in chemosensor and molecular logic gate designs. More importantly, recently expanding “Bodipy chemistry” provided facile derivatization possibilities to install PeT and ICT modulators onto the chromophore core.
It is important to note that, meso-substituents in these designs are more likely to act as PeT modulators only and their interaction with the ground state is limited. Whereas styrl-tethered receptors directly interact with the ground state and alter HOMO-LUMO levels, since they extend the conjugation of Bodipy core –i.e. they are ICT modulators. PeT donor in molecule 2 and ICT donor in molecules 4 and 7, the dipicolylamine ligand, is a well-known Zn2+ selective ligand. The dithiaazacrown ligand, ICT donor in all three target molecules, is known to have a selectivity for Hg2+ over many other metal ions. The azacrown moiety, PeT donor in molecule 7 preferably binds to hard alkaline and alkaline-earth metals, such as Ca2+.
Table 7. Spectral data for target molecules
λmax Abs εmax fwhm
(nm) (nm)a (M-1cm-1) (cm-1) 2 600 0.135 80000 1540 0.1 2 + Zn2+ 602 0.132 79000 1640 0.16 2 + Hg2+ 560 0.075 53000 2460 0.19 2 + Zn2+ + Hg2+ 560 0.153 92000 900 0.43 4 697 0.259 81000 1420 0.11 4 + Zn2+ 673 0.288 90000 1440 0.33 4 + Hg2+ 674 0.294 92000 1640 0.28 4 + Zn2+ + Hg2+ 630 0.34 106000 840 0.78 5 497 0.101 60600 960 0.012 5 + Ca2+ 498 0.095 57000 870 0.592 7 692 0.142 71000 1280 0.038 7 + Ca2+ + Zn2+ + Hg2+ 626 0.122 61000 1240 0.266 Compounds Φb
b Quantum yields for compounds 2, 4, and 7 were determined in reference to Sulforhodamine 101 (0.90 in ethanol) and for compound 5 Rhodamine 6G (0.95 in ethanol) was used as a reference.
The spectral data for all three target compounds and their metal complexes were tabulated in Table 7. It is clear that the metal ions separately or together, have different regioselectivities.
3.2 Binding constants
Isothermal titration calorimetry was useful in determining the binding constants of Hg2+ and Zn2+ (Table 8). Experimentally determined binding affinities confirm the working principle of the proposed molecular logic gates.
Table 8. Binding constants determined by isothermal titration calorimetry (ITC)
for the relevant binding events.
Titration K (M-1) ∆H
(kcal/mol) cal/(mol.K)∆S model Compound 1
(1:1) binding-Zn2+ Compound 1 (1:2) binding-Zn2+
Referencea
dithiaazacrown-Hg2+ (3.4 ± 0.8) x 106 -11.6 ± 0.08 -9.27 one set of sites Compound 1-Hg+2 (9.1 ± 0.5) x 106 -15.3 ± 0.02 -19.3 one set of sites Half adder 4-Zn2+ (6.7 ± 0.6) x 105 -14.9 ± 0.1 -23.2 one set of sites Half adder 4-Hg2+ (8.0 ± 2.6) x 107 -39.4 ± 0.3 -95.6 two sets of sites Half adder 4-Hg2+
2nd binding (1.1 ± 0.2) x 105 -1.1 ± 0.2 -41.1 two sets of sites AND Gate 2-Zn2+ (1.8 ± 0.8) x 106 -6.8 ± 0.2 5.7 one set of sites
(4.8 ± 0.4) x 107 -7.5 ± 1.6 5.99 two sets of sites (5.9 ± 0.8) x 106 -11.4 ± 0.4 -2.95 two sets of sites
At high concentrations of compound 1 (Figure 27), a clear 1:2 complexation is observed. Similar interaction is not observed when the dipicolylamine ligand is tethered with a styryl group to 3 (or 5) position of Bodipy, which can be understood in terms of steric demands of 1:2 interaction.
Figure 27. Molecule 1 is used as a reference in ITC experiments
Half-adder molecule 4 (0.4 mM) when titrated with 5.0 mM Zn2+ ions shows just one binding, indicating an affinity for the picolylamine ligand, but not for the dithiaazacrown ligand (Figure 28). The two-input AND logic titration with Zn2+ ions also shows just one binding event. Compared to that of Hg2+ ions, larger affinity of Zn2+ ions for dipicolylamine ligand apparent in the separate titration studies (Figure 29) done with these two cations and the reference compound 1 (4.8
x 107 M-1 for Zn2+ and 9.1 x 10⁶ M-1 for Hg2+).
Titration of ditopic compounds with Hg2+ ions revealed that, Hg2+ have strong affinities for both dipicolylamine and the dithiaazacrown ligands, and at larger concentrations both ligands would be engaged. But at the selected concentrations of Zn2+ and Hg2+ as inputs, dynamic nature of the binding events dictate that Zn2+ ions with no affinity to dithiaazacrown ligand and larger affinity for dipicolyl
ligand will preferentially occupy dipicolylamine ligand. This order of affinity will be in place for all three logic gates designs.
Figure 28. ITC titration curves of compound 4 in acetonitrile
On the other hand, binding affinity of Ca2+ ions were significantly smaller, therefore relavant binding constant in the interaction of these ions with three-input logic gate molecule 7 were determined by spectrofluorometry. The value obtained for K is 680 M-1 (Figure 30) suggests that at higher input concentrations of Ca2+ ions, the crown ether moiety will be engaged by this cation.
Figure 29. ITC titration curves of reference compound 1 in acetonitrile
Figure 30. Benesi-Hildebrand analysis of fluorimetric Ca2+ titration data for compound 5.
3.3 AND Gate
Figure 31 shows the emission spectra of molecule 2 upon addition of the metal cation modulators. In the absence of cations, dye emission spectrum has a broad peak, with a maximum at 679 nm.
Figure 31. Fluorescence emission of molecule 2 exhibits AND gate behavior
When Zn2+ was cation is added, as perchlorate salt, very small changes in the emission spectrum observed: peak intensity increased slightly, while peak maximum did not change. This observation can be rationalized considering the fact
rather than the ICT donor dialkylaminophenyl group in full conjugation with the Bodipy core stays minimal.
Figure 32. Emission intensities at 596 nm shown in bar-graphed truth table
Whereas Hg2+ addition (6.68μm) alters the spectrum significantly. Soft Hg2+ cations selectively binds to ICT donor thiaazacrown ligand which results a blue shift of 109 nm. As explained in Section 1.2.4, reduced charge transfer upon metal cation binding causes an increase in the HOMO-LUMO gap. When hypsochromic shift occurs, however, PeT process become activated and emission intensity (570 nm peak) stays low.
Thereby, only in the presence of both Hg2+ and Zn2+ cations, PeT donating ability of the dipicolyamine substituent is blocked and an intense emission peak at 570 nm is
observed. Figure 28 shows the colorful signaling which is in accordance with the
AND logic when the emission is recorded at 570 nm.
A theoretical model for molecule 2 has also been studied at DFT B3LYP/6-31G level. As a reasonable model for cation binding, protonation of donor nitrogen atoms in the PeT and ICT active groups is used. Calculations revealed changes in the frontier orbitals (shown in Figure 33) that supports the above explanation.
Figure 33. Frontier orbitals for molecule 2 (a:HOMO-1, b:HOMO, c:LUMO)
Table 9 shows the calculated energies of frontier orbitals. Relative changes of energy values are also shown schematically in Figure 34 with LUMO levels aligned for clarity. Following can be said relying on these calculations: i- The major transition is always from the dye centered (DC in Figure 34) orbital (HOMO or
this HOMO orbital and the dye-centered HOMO-1. The magnitude of this gap is related to the thermodynamic driving force for PeT and thus the rate of PeT.
Table 9. Energies of the frontier orbitals (LC-stands for ligand centered, DC for
dye-centered)
Unoccupied
Dyes LC (eV) DC (eV) LUMO (eV)
2 -5.31 -4.46 -2.29
2 + H+ [Hg(II)] -6.64 -7.24 -4.73
2 + H+ [Zn(II)] -9.74 -6.15 -4.24
2 + 2H+ [Zn(II) + Hg(II)] -11.7 -9.09 -6.69
Occupied
In the absence of both cations, since HOMO is dye centered, PeT pathway is blocked. Still, only a low-intensity emission is present, due to the larger number of non-radiative decay pathways at longer wavelength transitions.
Figure 34. Changes in the energy levels of the frontier orbitals (LUMO levels
Calculations show that Hg2+ addition effects DC occupied orbital largely while LC occupied orbital is only slightly effected. This result is important for two reasons: i- Hg2+ addition increases HOMO-LUMO gap largely, that accounts for 109 nm of blue shift, ii- Order of the occupied orbitals in terms of their energy is changed after Hg2+ addition, which activated the dipicolylamine group as a PeT donor. This is why, when Hg2+ ions were added, there is a blue shift, but no increase in the emission intensity. In 1:1 complex of 2-Hg2+, PeT is expected to be more effective. In the case that only Zn2+ cations were added, energetic order of frontier orbitals are not changed but their relative positions are affected slightly. Since PeT donor is not in conjugation with the Bodipy core, dye-centered orbitals are affected less when compared to ligand-centered orbitals. This actually translates as little or no change in the emission character as the HOMO-LUMO gap is moderately affected.
But when both cations were added, a significant increase in the HOMO-LUMO gap due to reduced charge transfer (blue shift for the main transition), and large stabilization of the ligand-centered (dipicolyamine) orbitals (blocking of PeT) were in effect. The net result is a blue-shifted intense emission.
3.4 Half-adder in the Absorption Mode
In half-adder molecule 4, both two receptors are in full conjugation with the Bodipy core and they function as ICT donors. The spectral changes are direct consequences of relative affinities of these ligands to Hg2+ cations99 and Zn2+ cations100.
Figure 35. Absorbance spectra for molecule 4 in the absence and presence of
analytes
Distyryl-Bodipy dye 4 alone has an absorption peak with a peak maximum at 698 nm (Figure 35). Upon Zn2+ addition, since charge transfer from dipicolylamine ligand is blocked, a small blue shift to 675 nm observed. Similar results are obtained when only Hg2+ cations are added to the solution, since mercuric cations block charge transfer caused by dithiaazacrown ligand only. Clearly, even in the excess of these cations, ICT is blocked partially due to high selectivity of both ligands.
However, in the presence of both Zn2+ and Hg2+ cations, the peak shifts further towards shorter wavelengths and peak maximum locates at 630 nm. Hence absorption spectrum contains intense peaks at around 675 nm only if one of the cations is present, but not both, i.e. molecule exhibits XOR gate characteristic around 675 nm. Also absorption signal at around 630 nm translates as an AND
gate, since neither dye 4 alone, nor its complex with one of the cations absorb at that short wavelength. Since these two gates are operated in parallel, molecule reads as a half-adder. The truth tables for the two logic gates are shown graphically in Figure 36, monitored at fine-tuned wavelengths (623 nm for AND gate, 663 nm for XOR).
Figure 36. Absorbance intensities at 663 and 623 nm shown in bar-graphed truth
table
3.5 A three-input AND Gate
Absorption spectrum of the ternucleating (tritopic) compound 7 is presented in Figure 37, and the effects of added metal ions (Ca2+, Zn2+ and Hg2+) are apparent. Harder Ca2+ ions prefer to interact with harder azacrown ligand at the meso position
Figure 37. Absorption spectrum for molecule 7
When compared to free fluoroionophore, approximately 25 nm blue shift was observed in the absorption spectra for the following combinations: Ca2+, Zn2+ and Ca2++Zn2+. Hg2+ is particularly effective, and in all input scenarios including Hg(II), there is large 70 nm hypsochromic shift. Nevertheless, it is obvious that absorbance changes seem far too complicated to be of much use in logic gate design. However, the emission changes (Figure 38) result in a better picture for this purpose. At the concentrations used in the present work (Hg2+ and Zn2+ at 20.0 µM and Ca2+ at 1.0 mM), only when all three cations were added as inputs, emission is significantly enhanced above the threshold. The three cations separately, or in other binary combinations, do not induce an enhanced and blue shifted emission from the compound 7. Thus, all three metal cation inputs are required simultaneously for the large emission increase at 656 nm, this behavior is in accordance with an AND logic gate.
Figure 38. Fluorescence emission of molecule 7 exhibits a three-input AND gate
characteristics
One can envision a scenario, where elevated concentrations of three different molecular or ionic species may indicate a particular disease state (lab-on-a molecule, as elaborated previously by de Silva), thus a non-zero AND logic response, could be a positive identification of that particular state. The use of multiple photophysical processes for eliciting an AND response is highly relevant, as it would minimize false positives, since for example in this case, both a blue shift and large enhancement of emission signal should be expected. In addition, simultaneous sensing is also possible: PeT and ICT processes can clearly be
donor ligand will result in spectral shift which can be correlated to the concentration of the analyte targeting that particular ligand.
CHAPTER 4
CONCLUSION
We demonstrated that with a prior knowledge of respective binding affinities of metal ions for various ligands, it should be possible to design molecular logic gates using different metal ions as inputs. Remarkably versatile chemistry of Bodipy is particularly useful in this regard, because it allows straightforward placement of ICT and PeT donors on the same molecule, and this increases signal diversity to a great extent. Styryl-modifications of Bodipy proved to be a useful reaction. In the three examples presented, this modification allowed us to place ICT donor functionalities at strategically important positions. The result is straightforward syntheses of the target molecules, with responses compatible with AND logic and, a molecular half-adder with non-annihilating inputs. Outputs compatible with XOR logic has been difficult to attain without the use of self-annihilating (such as acids and bases, either Lewis or Bronsted-Lowry) inputs, but in the half-adder described in this work, this is done by the differential selective interactions between the ligands and the metal ions selected. The results suggest that different metal ions can be used as non-annihilating inputs, selectively targeting various ligands incorporated within a single fluorophore, and with careful design, diverse photophysical processes can be selectively modulated, resulting in a range of signals, useful in molecular logic design, and offering an enticing potential for multianalyte chemosensors Using signals obtained by exploiting relative selectivity of inputs for different ligands/chelators, more challenging molecular logic operations should be within reach.
REFERENCES
1. C.J. Pedersen, J. Am. Chem. Soc 89, 7017-7036, 1967. 2. J.F. Stoddart, Nature Chemistry 1, 14–15, 2009. 3. J.M. Lehn, Angew. Chem. Int. Ed. 27,, 1988.
4. E.U. Akkaya, S. Ozlem, J. Am. Chem. Soc 131, 48-49, 2009.
5. D. Shabat, R.J. Amir, M. Popkov, R.A. Lerner, C.F. Barbas, Angew. Chem.
Int. Ed. 44, 4378-4381, 2005.
6. J.L. Atwood, J.W. Steed, Encyclopedia of Supramolecular Chemistry (CRC Press: 2004).
7. Philosophical Magazine (Taylor & Francis.: 1854). 8. P. Siffert, E.F. Krimmel, Silicon (Springer: 2004). 9. Computer, ''n.'' (Oxford University Press: 1989).
10. Approximate Desktop, Notebook, & Netbook Power Usage at
http://www.upenn.edu/computing/provider/docs/hardware/powerusage.html [accessed 17 May 2010]
11. Replica of First Transistor (JPEG Image) at
http://clinton4.nara.gov/media/jpg/replica-of-first-transistor.jpg [accessed 17 May 2010]
12. Nano-Transistor (JPEG Image) at
http://www.nanopicoftheday.org/images/nanotransistor.jpg [accessed 17 May 2010]
13. G.E. Moore, Proc. IEEE. 86, 82–85, 1998.
14. M. Kanellos, New Life for Moore's Law, CNET News at
http://news.cnet.com/New-life-for-Moores-Law/2009-1006_3-5672485.html [accessed 17 May 2010]
15. Moore Law Diagram (JPEG Grafiği) at
http://upload.wikimedia.org/wikipedia/commons/a/a9/Moore_Law_diagram_ %282004%29.jpg [accessed 1 July 2010]