Analysing the effects of thermal comfort and indoor air
quality in design studios and classrooms on student
performance
A Ranjbar
Bilkent University, 06800 Bilkent, Ankara, Turkey [email protected]
Abstract: This study aimed to explore the various effects of different ventilation modes on the thermal comfort and indoor air quality in design education environment. It also investigated the relationship between the ventilation mode and student performance. Thus, an experimental study was conducted in both studio and classroom environments, in Interior Architecture and Environmental Design Department at Bilkent University, Ankara, Turkey. CO2 concentration values, indoor air temperature and humidity values as the main parameters of thermal comfort and indoor air quality was measured in both winter and summer seasons under the three modes of ventilation: 1) without opening door and windows mode setting; (2) natural ventilation mode and (3) the HVAC ventilation mode achieved by the TROX school-air unit. Under these three different modes for both attention and concentration levels, 100 students from the winter season, 50 students from summer season for the classroom environment, and 20 students from the winter season, 16 students from summer season for the studio environment participated. Results were calculated in IBM SPSS 21 software separately for both seasons and three different ventilation modes. As a result, the experimental and performance results have shown that the HVAC unit mode achieved the most
satisfactory indoor environment in both seasons and higher levels of student performance. Keywords: Thermal comfort, indoor air quality (IAQ), studio, classroom, student performance.
1. Introduction
In recent years, thermal comfort and indoor air quality have become well-known issues, which get most researchers’ attention to improve interior living spaces. They increase importance in school buildings since poor indoor air quality (IAQ) is potentially a negative effect on student’s health and performance. Young people spend a significant part of their day indoors. Most of the studies reported that poor indoor air quality in schools result in illness leading to student absenteeism, and adverse health symptoms, decreasing academic concentration levels[1] [2]. The main aspects of classroom ventilation are not only to decrease the risk of health problems and diminish occupants’ discomfort level but also help to eliminate any negative effects on learning and productivity [3]. Low ventilation rates in classrooms have been also associated with lower concentration. [4]. Most classrooms in higher education have inadequate ventilation, causing occupant dissatisfaction. Especially, art classrooms and design studios, which required high activity type as personal parameters of thermal comfort. Different than the other IAQ studies, this study contributes to the scientific literature by investigating the relationship between performance and CO2 concentration levels in both design studios and classrooms in the design education context.
2. Literature review on ventilation and CO2 concentration in schools
Ventilation is crucial in maintaining IAQ. “IAQ is defined as the desire of humans to perceive the air as fresh and pleasant, with no negative impacts on their health and productivity” [5]. Gasses, including carbon dioxide CO2, radon, and volatile organic compounds (VOCs) are the variables that affect indoor
air quality. Sarbu and Sebarchievici [6] claimed that many factors including thermal adjustment, control of internal and external sources of pollutants, acceptable air supply, occupant activities, preferences, proper operation and maintenance of building systems have an effect on IAQ. Fanger [7] started to develop the first classic steady-state model for air-conditioning based on the heat balance of the human body in 1970. Afterward, those rates were 2.5 L/s m2 in offices and 7.6 L/s m2 in public buildings including schools, which convert to 50 L/s per person in offices and 22 L/s per person in classrooms based on the default occupancy densities in ASHRAE Standard 62.1[8]. Persily [8] concluded that 5 L/s to 7.5 L/s per person was the acceptable limit for university classrooms. The study by Wargocki and Wyon [9] showed the positive relationship between ventilation rate and student performance in classroom environment. An average individual with a normal activity produces 20 liters (0.02 m3) of CO2 per hour, so the density of people in a classroom affects the CO2 levels (ppm). Shaughnessy et al. [10] found that classroom ventilation rates and students' academic achievement have a linear association within the range of 0.9-7.1 l/s per person. A recent study by Luther, Horan, and Tokede [11] measured the levels of CO2 in 24 classrooms in six different schools in Australia and found that air exchange rate, CO2 exhalation rate and the number of pupils are the significant parameters in predicting the relationships between student performance and CO2 concentration levels.
3. Research methods
3.1. Setting
Ankara, the capital of Turkey, is located at 39°57' N latitude, 32°53' E longitude. It has a continental climate; dry, hot summer and snowy, cold winter. Consistent with Turkish State Meteorological Service, the winter average temperature in Ankara is 0.2°C and summer average temperature is 23.5°C, so the range of temperature requires special precaution in design and maintenance of the buildings. Yet, most of the school buildings don’t have sustainable and well-maintained heating nor cooling units directly controllable by students and staff introducing outside fresh air [12].
3.2. Sample and Studio selection
Bilkent University, Department of Interior Architecture and Environmental Design was chosen as the setting for the experiment. A chosen teaching environment is a newly furbished room, located on the first floor. It is equipped with a school air ventilation unit. The room is a 125.6 m2 design studio with a ceiling of 3.6 m, having three window façades, which is an advantage for natural ventilation and a disadvantage for losing heat in winter. Participants of the study are 3rd-year undergraduate students of Interior Architecture and Environmental Design Department, voluntarily chosen from a third-year design studio course.
3.3. Procedure
This study used both objective and subjective parameters to assess the thermal comfort and IAQ of the experiment room. It has two phases: the winter season phase and the summer season phase, conducted on the 2016-2017 academic year. Each phase has three experimental conditions, in which both objective and subjective measurements of thermal comfort and IAQ are repeated. Figure 1 illustrates the main conceptual procedure framework of the study. Setting 1 is a none ventilation mode, meaning that during the class hours neither door nor windows are open, and ventilation is happened by the door and windows’ leaks, except breaks. Setting 2 is a natural ventilation mode, which means that fresh air gets in by opening the door and three cross windows in specific time periods in specific time durations (every 30 minutes, 5 minutes). Setting 3 is a mechanical ventilation mode, which means that none of the door and window opening is open for ventilation purposes, as same as setting 1 except using School Air –B (air conditioning device). In every setting, the objective measurements, CO2 concentration, temperature, humidity, are recorded by the below explained digital measurement devices during the class hours of studio and lecture class. Then, subjective measurements, the comfort questionnaire and concentration
tests are conducted in the last 20 minutes of each class hour. In each mode, re-ordered questions are asked to avoid the learning effect.
Figure 1: Main conceptual procedure of the study.
3.4. Instruments
For the thermal comfort subjective measurements, a 7-point Likert scale (-3 is for cold, and +3 is for hot) questionnaire consisting of 3 questions, recommended by the EN ISO 10551 is used. In the first section, the demographic information of the participants is asked. In the second section, participants are asked to rate their thermal comfort level using a 7-point Likert scale questionnaire. The last section is divided into two tests. The first test is called the Kraepelin test, which measures arithmetic concentration, performance speed, and task performance accuracy. The second test called Prague test, which measures the attention of the participants on visual memories. The digital measurement devices that are used to collect objective data are as follows: Laser Pyrometer, BP 21 (Infrared thermometer) from TROTEC Company, which is used in the measurement of the radiant temperature, and Flexible Thermo Anemometer, BA 15 by TROTEC Company, which is used to measure airspeed, ventilation rate, and air circulation. For IAQ measurements, CO2 temp/RH Data logger CM 0019 is used, which is able to measure and monitor real-time CO2 (ppm) concentration level, humidity (%) level, and temperature (°C) level by using computer software.
4. Results
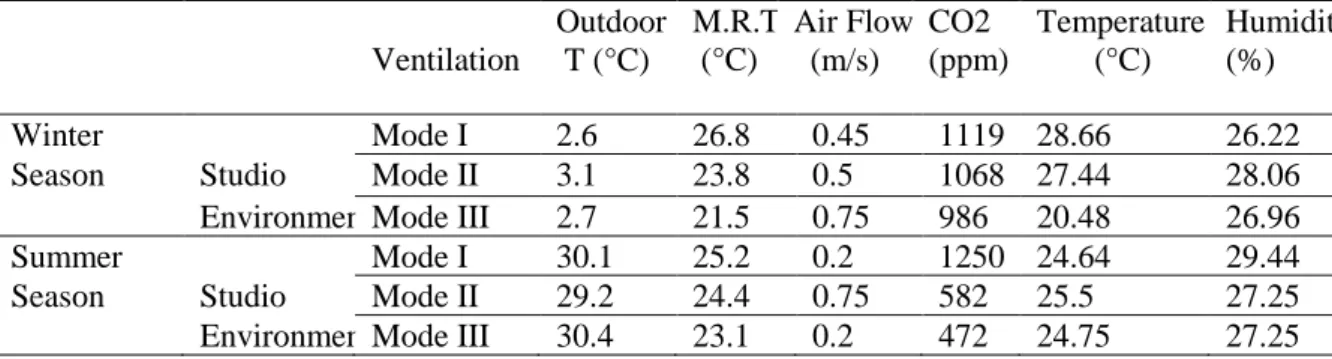
4.1. Objective measurement results 4.1.1. Studio environment
The results of the experiments in the studio environment during winter in three ventilation modes presented that the CO2 concentration, indoor temperature, and relative humidity values in mode 1 and mode 2 could not meet the demand of the recommended standards. However, in mode 3, the values were almost close to the ASHRAE Standard 62.1-2010, ASHRAE Standard 55-2010. According to the results of summer in the three ventilation modes, in the mode 1, the CO2 concentration and temperature were above the 1000ppm, and the relative humidity levels were below the recommended levels. In mode 2 and 3, it was clearly shown that the CO2 concentration and temperature values were not that different from each other. (See Table 1).
4.1.2. Classroom Environment
The results of the measurements in the classroom during winter showed the same results as the studio environment. CO2 concentration and temperature and humidity were not quite close to the standard recommendation in the first and second mode. On the other hand, although in the third mode CO2 concentration value has reached to the acceptable value, temperature and humidity values were still problematic. The reason for that was the higher number of participants in the classroom environment compared to the studio environment. In summer, CO2 concentration and temperature and humidity were higher in the mode 1 compared to the second and third mode (see Table 2).
Table 2: Objective measurement results of the classroom environment in both season.
4.2. Subjective measurement results 4.2.1. Studio Environment
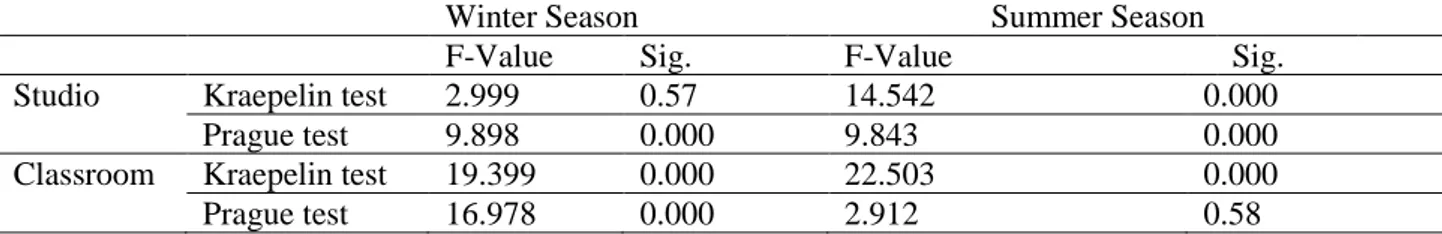
Among the three ventilation modes in winter, a higher number of occupant satisfaction occurred in mode 3, mechanical ventilation. Also, high scores from both performance tests were obtained only in the mechanical ventilation mode. According to previous studies, higher ventilation rate has also a positive influence on student performance. However, in summer, the student performance scores in both natural and mechanical ventilation mode of all studio environments were close to each other and had higher scores compared to the none-ventilation mode. To further elaborate on the differences between seasons, the study conducted an analysis of variance (ANOVA) test. F value of 2.999 at the significant level of 0.057 was found for the winter season (See table 3) and F value of 14.542 at the significant level of 0.000 for the summer season (See Table 3). However, the further analysis of ANOVA with LSD test for both season has shown that there was a significant statistical difference between mode I and mode II, and between mode I and mode III, but no statistical difference between mode II and III; meaning that the participants’ performance did not differ statistically under natural ventilation mode and mechanical
Ventilation Outdoor T (°C) M.R.T (°C) Air Flow (m/s) CO2 (ppm) Temperature (°C) Humidity (%) Winter Mode I 2.6 26.8 0.45 1119 28.66 26.22 Season Studio Mode II 3.1 23.8 0.5 1068 27.44 28.06 EnvironmentMode III 2.7 21.5 0.75 986 20.48 26.96 Summer Mode I 30.1 25.2 0.2 1250 24.64 29.44 Season Studio Mode II 29.2 24.4 0.75 582 25.5 27.25 EnvironmentMode III 30.4 23.1 0.2 472 24.75 27.25 Ventilation Outdoor T (°C) M.R.T (°C) Air Flow (m/s) CO2 (ppm) Temperature (°C) Humidity (%) Winter Mode I -3 23.0 0.4 1472 23.23 26.14 Season Classroom Mode II 2 24.6 0.8 1031 24.13 31.24 Environment Mode III 3 23.3 0.25 799 25.70 26.83 Summer Mode I 13 23.5 0.2 1000 24.70 31.80 Season Classroom Mode II 7 24.0 1.5 900 22.20 27.90 Environment Mode III 13 23.3 0.25 600 23.80 34.30
statically significant differences between the seasons. F value for the winter season is 9.843 at the significant level of 0.000 and for summer season 9.843 at the 0.000 significant levels (See table 3). Moreover, the difference between seasons according to LSD test results showed that in both seasons there was a statistically significant difference.
4.2.2. Classroom Environment
In the classroom environment, the ANOVA test results of arithmetic concentration performance demonstrated statically significant differences between the seasons (See table 3). However, analysis of ANOVA with LSD test for both season showed that there was a significant statistical difference between mode I and mode II, and between mode I and mode III, but there was not a statistical significant difference between mode II and mode III, which means that the participants concentration performance did not differ statistically under natural ventilation mode and mechanical school-air unit mode as same as the studio environment. The ANOVA results of the visual attention test (Prague test) showed a statistically significant difference between groups (See table 3). Moreover, the difference between groups according to LSD test results showed that in winter season there was a statistically significant difference between groups. Similar to the concentration performance results, attention performance of the participants did not differ when mode II and mode III were compared. However, summer season had the different results on LSD test; there was a significant statistical difference between mode I and mode III, whereas there was not a statistical difference between mode I and II, and mode II and III.
Table 3: Oneway ANOVA results of arithmetic concentration performance and visual attention in
winter and summer season.
Winter Season Summer Season F-Value Sig. F-Value Sig. Studio Kraepelin test 2.999 0.57 14.542 0.000
Prague test 9.898 0.000 9.843 0.000 Classroom Kraepelin test 19.399 0.000 22.503 0.000 Prague test 16.978 0.000 2.912 0.58
5. Discussion
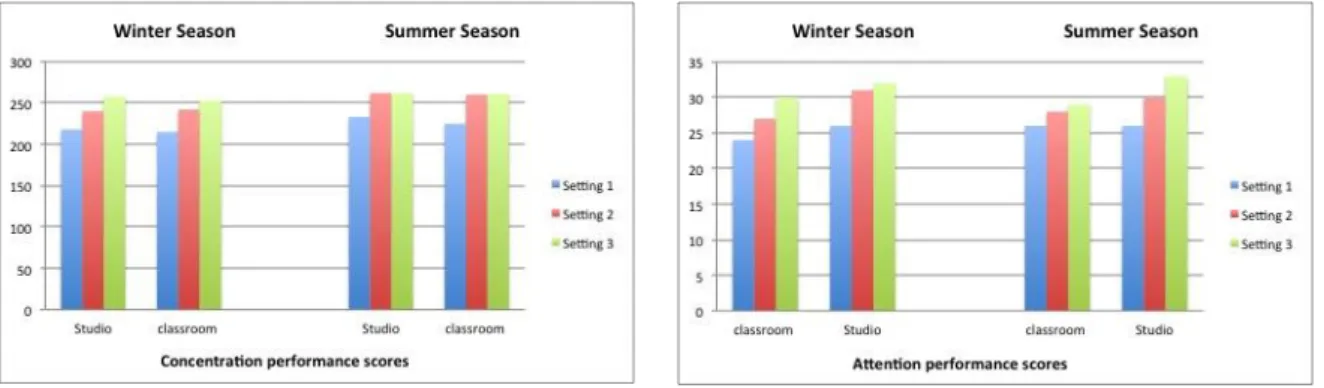
This paper aims to analyse measurements of thermal comfort and IAQ in different ventilation modes of design studio and classroom. It investigated the relationship between student performance and CO2 concentration values to enhance performance of students. According to a study in the US, during the hot season, outdoors temperature is a good predictor of indoor temperature conditions [8]. This research is in the same line with this study by showing results that during summer season there is not a significant difference between mode 2 and mode 3 in terms of both occupant’s satisfaction and performance; however, mode 1 has still lowest rank between the groups (table 1 and 2 demonstrated the overall CO2 concentration values). On the other hand, during the winter season, it was observed a significant difference between the results gathered from the three modes. The graph (see Figures 2 and 3) showed a linear increasing rank from mode 1 to mode 3 in terms of thermal comfort and student performance. In addition, according to the study by Sarbu and Pacurar [3], indoor ventilation was not only significant in terms of decreasing the risk of health problems within learning environments, but also significant in terms of eliminating any negative effects on learning and productivity. Therefore, it can be said that when the highest ventilation rate occurred in both subjective and objective measurement results, students should have higher concentration and attention performance results.
Figure 2: The comparison of concentration
performance scores in studio and classroom environment.
Figure 3: The comparison of attention
performance scores in studio and classroom environment.
6. Conclusion
People spend more than 80% of their time in indoor environments, such as in schools, offices, and shops. Thus, “university environments are the most crucial indoor environments to ensure student’s health, effective learning and well-being [13][14][15]. This paper investigated the effects of different ventilation modes on students’ performance. It measured experimentally the thermal comfort and IAQ of both a design studio and classroom environment and under three different ventilation modes. The experimental results were in parallel with the literature review. As mentioned in the literature review, the study by Wargocki & Wyon [9] showed that increasing outdoor air supply enhance the student performance on the numerical and language-based task, also the percentage of error on numerical task significantly reduced in that case. Moreover, according to the subjective outcomes of the study, both the studio and classroom environment with the school-air unit had the highest performance scores compared to the other two ventilation modes. In the absence of a mechanical air-conditioning system, the performance decreased in both environments and seasons. On the other hand, the studio environment had a slight difference on the survey and experimental measurements’ results because studio environment has low population density with high spending time on studio environment, which makes balance on CO2 and temperature values with high population density with the low spending hours of the classroom environment. The study has the following limitations, such as using the same room in all measurements; not having the equal number of male and female participants. Moreover, conducting the study in various studios at the same time period with higher participants number can feed the study in a more different way. Future studies should focus on sustainable strategies because providing better thermal and air quality conditions in classrooms would be cost-effective, developing sustainable strategies becomes essential.
References
[1] Eide, E.R., Showalter, M.H., & Goldhaber, D. D. 2010. The relation between children's health and academic achievement. Children and Youth Services Review 32(2): 231–38.
[2] Mendell, M.J., & Heath, G.A. 2005. Do indoor pollutants and thermal conditions in schools influence student performance? A critical review of the literature. Indoor Air 15(1): 27–52. [3] Sarbu, I., & Pacurar, C. 2015. Experimental and numerical research to assess indoor
environment quality and schoolwork performance in university classrooms. Building and
Environment 93:141–54.
[4] Mishra, A.K., & Ramgopal, M. 2015. A comparison of student performance between
[5] van Hoof J, 2008. Forty years of Fanger’s model of thermal comfort: comfort for all? Indoor Air [Internet]. 2008, Jun [cited 2018 Jun 22];18(3):182–201.
[6] Sarbu, I. & Sebarchievici, C. 2013. Aspects of indoor environmental quality assessment in buildings. Energy and Buildings 60: 410–19.
[7] In PF-T comfort. A and applications, 1970 undefined. Thermal comfort. Analysis and applications in environmental engineering. cabdirect.org [Internet]. [cited 2018 Jun 22]; [8] Persily A. 2015. Challenges in developing ventilation and indoor air quality standards: The
story of ASHRAE Standard 62. Build Environ [Internet]. Elsevier Ltd; 2015;91:61–9. [9] Wargocki, P., & Wyon, D.P. 2007. The effects of moderately raised classroom temperatures
and classroom ventilation rate on the performance of schoolwork by children (RP-1257). H V
A C.
[10] Haverinen‐Shaughnessy, U., Shaughnessy, R. J., Cole, E.C., Toyinbo, O. & Moschandreas, D. J. 2015. An assessment of indoor environmental quality in schools and its association with health and performance. Building and Environment 93(1): 35–40.
[11] Luther, M.B., Horan, P. & Tokede, O. 2017. Investigating CO2 concentration and occupancy in school classrooms at different stages in their life cycle, Architectural Science Review.
[12] Bulgurcu H., İlten, N. & Çoşgun, A. 2006. Indoor Air Quality Problems in Schools and Solutions. Mechanical Engineering Journal 96: 59–72.
[13] Silvers, A., Florence, B. T., Rourke, D.L., & Lorimor, R.J. 1994. How Children Spend Their Time: A Sample Survey for Use in Exposure and Risk Assessments. Risk Analysis 14(6): 931– 44.
[14] Diapouli, E., Chaloulakou, A., Mihalopoulos, N., & Spyrellis, N. 2007. Indoor and outdoor PM mass and number concentrations at schools in the Athens area. Environmental Monitoring
and Assessment 136(1-3): 13–20.
[15] Dorizas, P., Kapsanaki-Gotsi, E., Assimakopoulos, M., & Santamouris, M. 2013. Correlation of Particulate Matter with Airborne Fungi in Schools in Greece. International Journal of