Beykoz Akademi Dergisi, 2017; 5(2), 94-122 MAKALE
Gönderim tarihi: 6.11.2017 Kabul tarihi: 13.11.2017 DOI: 10.14514/BYK.m.21478082.2017.5/2.94-122
DEVELOPMENT OF A TRANSFORMATIONAL LEADERSHIP SCALE FOR THE TURKISH
CONTEXT
NİGAR ÇAĞLA MUTLUCAN9
ABSTRACT
Transformational leadership has been an interesting research topic for decades. There are several transformational leadership scales developed by different academicians. The purpose of this study is to develop a transformational leadership scale for the Turkish organizational setting. Two focus groups and four in-depth interviews were conducted, and a survey was carried out. Items generated at the end of this process were combined with some items of Podsakoff, Mackenzie and Bommer’s (1996) scale, namely the Transformational Leadership Behavior Inventory (TLI) to ensure content validity. Reliability, convergent validity and discriminant validity are assessed by means of the Multitrait-Multimethod (MTMM) Matrix. The nomological validity of the newly created Transformational Leadership Scale (TLS) is also checked by examining the Pearson correlation values between transformational leadership (measured by TLS) and job satisfaction (measured by Minnesota Satisfaction Questionnaire, MSQ). The correlation values indicate nomological validity for the transformational leadership scale.
Keywords: job satisfaction, scale development, transformational leadership. JEL Classification: J28, C10, L20.
95
TÜRK ÖRGÜT ÇEVRESİ İÇİN BİR DÖNÜŞÜMCÜ LİDERLİK ÖLÇEĞİ GELİŞTİRME
ÇALIŞMASI
ÖZET
Dönüşümcü liderlik, on yıllar boyunca ilgi çekici bir araştırma konusu olmuştur. Değişik akademisyenlerce geliştirilmiş çeşitli dönüşümcü liderlik ölçekleri bulunmaktadır. İşbu çalışma, Türk örgüt çevresi için bir dönüşümcü liderlik ölçeği geliştirmeyi amaçlamıştır. İki odak grup ve dört derinlemesine görüşme yürütülmüş ve bir anket çalışması gerçekleştirilmiştir. Bu sürecin sonunda ortaya çıkan maddeler Podsakoff, Scott ve Bommer’in (1996) Dönüşümcü Liderlik Davranışı Envanteri’ndeki bazı maddelerle birleştirilmiş, böylece içerik geçerliği sağlanmaya çalışılmıştır. Güvenirlik, yakınsama geçerliği ve ayırt edici geçerlik MTMM matrisi ile değerlendirilmiştir. Yeni oluşturulan Dönüşümcü Liderlik Ölçeği’nin nomolojik geçerliğini değerlendirmek amacıyla dönüşümcü liderlik ve iş memnuniyeti (Minnesota Memnuniyet Ölçeği ile ölçülmüştür) arasındaki Pearson korelasyon değerleri incelenmiş ve nomolojik geçerlik tespit edilmiştir.
Anahtar kelimeler: Dönüşümcü liderlik, iş memnuniyeti, ölçek geliştirme. JEL Kodları: L20, J28, C10.
1. Introduction
An organization is not a mere group of people working under the same roof. In order for an organization to achieve success, there has to be cooperation, zest and harmony among the staff. At this stage, the role of the leader becomes important to the extent that he/she can stimulate employees to transcend their self-interest for the sake of the mission and vision of their group and/or organization. Leadership has been an interesting topic for researchers for several decades; especially transformational leadership has received considerable interest since Bass (1985) adapted the concepts of transformational and transactional leaders introduced by Burns (1978) to organizational management.
A review of the literature indicates that transformational leaders have an enhancing effect on outcome variables such as followers’ job satisfaction (Podsakoff and Mackenzie, 1996), job performance (Jyoti and Bhau, 2015), motivation (Barbuto, 2005), and levels of stress (Harms et al., 2017). Transformational leadership have been examined in various cultures and different organizational settings (e.g. schools, hospitals etc.), and it have proved to play an important role in organizational and personal outcomes. While in many of these studies the Multifactor Leadership Questionnaire (MLQ) (Bass and Avolio, 1990) has been used, some researchers have developed their own scale because of some concerns about factorial and discriminant validity problems. The purpose of this paper is to develop and adapt the Transformational Leadership Behavior Inventory (Podsakoff et al., 1996) for studies conducted in the Turkish organizational setting and to test its nomological validity by using the Minnesota Satisfaction Questionnaire.
2. Literature Review
In the last three decades, scholars have been studying mainly two different types of leadership: transformational and transactional leadership. These concepts were introduced by Burns (1978) in his book “Leadership” as two forms of political leadership. Bass (1985) applied Burn’s ideas to organizational management. Bernard Bass (1985) elaborated on Burn’s notion of leadership and posited that transformational and transactional leadership are not at opposite ends of a single continuum of leadership as Burns asserted. Bernard Bass and his co-researcher Bruce Avolio (1990) devised Multifactor Leadership Questionnaire and on the basis of research using MLQ, Bass found that transformational and transactional leadership are independent and complementary. According to transactional leadership theory there is an exchange relationship between leader and follower to meet their own self- interests. Simply stated, transactional leaders give followers something they want in exchange for something the leaders want. Transactional leaders engage their followers in a relationship of mutual dependence in which the contributions of both sides are acknowledged and rewarded (Kuhnert and Lewis, 1987). Transactional leadership
97
encompasses contingent reward and management-by-exception: in the form of contingent reward, the leader clarifies for the follower through direction or participation what the follower needs to do to be rewarded for the effort, in the form of active management-by- exception, the leader monitors the follower’s performance and takes corrective action if the follower fails to meet standards, in the form of passive leadership, the leader practices passive managing-by-exception by waiting for problems to arise before taking corrective action or is laissez-faire and avoids taking any action. Transformational leadership refers to the leader moving the follower beyond immediate self-interests through idealized influence (charisma), inspiration, intellectual stimulation, or individualized consideration. It elevates the follower’s level of maturity and ideals as well as concerns for achievement, self- actualization, and the well-being of others, the organization, and society. Idealized influence and inspirational leadership are displayed when the leader envisions a desirable future, articulates how it can be reached, sets an example to be followed, sets high standards of performance, and shows determination and confidence. Followers want to identify with such leadership. Intellectual stimulation is displayed when the leader helps followers to become more innovative and creative. Individualized consideration is displayed when leaders pay attention to the developmental needs of followers and support and coach the development of their followers. The leaders delegate assignments as opportunities for growth (Bass, 1999). Recently, Bass and Avolio added a fifth dimension, idealized attributes, to transformational leadership assessment scale in the MLQ. Idealized attributes dimension, which builds trust, comprises these items: instill pride in others for being associated with them, go beyond self- interest for the good of the group, display a sense of power and confidence, and make personal sacrifices for others’ benefit.
In his book Transformational Leadership: Industrial, Military, and Educational Impact (1998), Bass cited evidence from a range of studies, carried out across the world, that transformational leadership has a strong positive relationship with a range of outcome variables such as organizational productivity, job satisfaction and commitment, and lower level of stress. Researchers using the MLQ-5X found that transformational leadership influenced positively individual and group outcomes in business (Purvanova et al., 2006), the military (Dvir et al., 2002), education (Barnett and Mccormick, 2004) and in sport (Zacharatos et al., 2000). Transformational leadership behaviors result in higher levels of individual, group, and organizational performance beyond that accounted for transactional behaviors (Bass et al., 2003).
A variety of organizational studies demonstrated that transformational leadership behaviors were positively related to the follower’s job satisfaction (Podsakoff and Mackenzie, 1996; Podsakoff et al., 1990; Butle et al., 1999; Pilai et al., 1999; Sparks and Schenk, 2001).
Recently, studies on transformational leadership have begun to shift their focus toward identifying and understanding contextual variables that may influence or moderate the relationship of transformational leadership with followers’ level of motivation and performance (Avolio et al., 2004), some studies examined the moderating effects of individualism and collectivism on followers’ reactions to transformational leadership
(Walumbwa and Lawler, 2003). Moreover, researchers have begun to examine the role o followers in terms of being active participants in the leadership process dynamics (Whitford and Moss, 2009; Zhu et al., 2009).
A meta-analysis conducted by Lowe, Kroeck, and Sivasubramaniam (1996) confirmed the positive relationship between transformational leadership and performance reported in the literature. But most of the studies included in the meta-analysis were based on leadership and performance data collected at the same point in time, and typically from the same source. Lowe et al. (1996) reported that the effects of common source bias inflated the relationship between transformational leadership and performance reported by many previous authors. Although the estimated true score correlation was still positive, Lowe et al. (1996) indicated that it was considerably lower when ratings of leadership and performance were collected from different sources. Judge and Piccolo (2004) performed a meta-analysis too and the results provided important support for the validity of transformational as well as contingent reward and to some extent, laissez-faire leadership. On the other hand, their results revealed that transformational and transactional leadership are so highly related that it makes it difficult to separate their unique effects. As mentioned before, Bass views transformational and transactional leadership as complementary not as mutually exclusive types of leadership.
Although transformational leadership theory is a popular research topic among scholars, there have been some concerns about the definition of the subdimensions of the Full Range of Leadership Model. Yukl (1999a, 1999b) asserted that the diversity of behaviors encompassed by individualized consideration and contingent reward was problematic. Empirically, problems with MLQ5-X concerning its factorial (Rafferty and Griffin, 2004) and discriminant validity (Carless 1998) have been identified. Carless (1998) found that the MLQ- 5X does not assess separate transformational leadership behaviors, but measures a single, hierarchical construct of transformational leadership.
The above findings have led researchers to choose different paths when examining transformational leadership. Some scholars have opted to use a global measure of transformational and transactional leadership instead of examining the individual subdimensions (Pillai et al., 1999). Other researchers have used a reduced set of items to measure transformational leadership (e.g. Tejeda et al., 2001).
Other authors, such as Podsakoff et al. (1990), have developed their own measures of transformational and transactional leadership (Transformational Leadership Questionnaire (TLQ), Alimo-Metcalfe and Alban-Metcalfe, 2001; Global Transformational Leadership scale (GTL), Carless et al., 2000). Podsakoff et al.’s (1990) transformational leadership behavior inventory (TLI) is a scale designed to measure six key dimensions of transformational leadership that have been identified in the research literature. The dimensions are presented as follows:
99 x Identifying and Articulating a Vision- Behavior on the part of the leader aimed at
identifying new opportunities for his/her unit/division/company, and developing, articulating, and inspiring others with his or her vision of the future.
x Providing an Appropriate Model- Behavior on the part of the leader that sets an
example for employees to follow that is consistent with the values the leader espouses.
x Fostering the Acceptance of group Goals- Behavior on the part of the leader aimed at
promoting cooperation among employees and getting them to work together toward a common goal.
x High Performance Expectations- Behavior that demonstrates the leader’s
expectations for excellence, quality, and/or high performance on the part of followers.
x Providing Individualized Support- Behavior on the part of the leader that indicates
that he/she respects followers and is concerned about their personal feelings and needs.
x Intellectual Stimulation- Behavior on the part of the leader that challenges followers
to re-examine some of their assumptions about their work and rethink how it can be performed. (Podsakoff et al. 1990: 112)
TLI has been used in several studies on transformational leadership (Podsakoff et al., 1990; 1996; Kirkman et al., 2009; Bommer et al., 2005) Work by Podsakoff et al. (1996) found support for the factor structure of the TLI with each item possessing a completely standardized loading of 0.60 or above. Moreover, the Podsakoff et al. (1996) study found adequate discriminant validity between the measures, and reliabilities for the six dimensions ranging from 0.80 to 0.90.
Because of the concerns about MLQ-5X mentioned above, the author of this paper felt the urge to develop Podsakoff’s TLI and to create a scale suitable for the Turkish organizational setting. Afterwards, the nomological validity of this new scale will be tested by calculating correlations with the Minnesota Satisfaction Questionnaire (MSQ, short-form).
3. Item Generation
Upon completion of the literature review, qualitative methods have been used in order to generate items which will contribute to the development of transformational leadership behaviors scale: two focus groups and 4 in-depth interviews have been carried out.
a. Focus groups
When forming focus groups, researchers should pay close attention to the segmentation of the samples and homogeneity in the composition of the groups.
Participants should have something to say about the topic, they need to interact with other participants and talk without any reservation. Therefore, participants from similar backgrounds should be chosen
to compose focus groups. Generally, a typical discussion lasts 1 or 2 hours, and the moderator should help the discussion flow from topic to topic without unnecessary digression (Morgan, 1997)
Focus Group 1
The first focus group was conducted with four Ph.D. students knowing each other and the researcher. The range of participants’ age changed between 25 and 40. It was a homogeneous group since all the members were similar in terms of age, educational background, and life styles. The study took place at the researcher’s house and lasted for approximately one hour. Although a mini focus group with four people might seem small, the participants had all previous professional experience in different areas suitable for the research topic and they were comfortable with sharing their work experiences with other participants.
As being the moderator, the researcher started the conversation with a brief definition of transformational leadership, its effects on the outcomes of the employee and/or the organization. After pointing the differences between a transactional and a transformational leader, the researcher asked them: “According to you, what are the behaviors of a
transformational leader that can lead to better performance and affective outcomes on the part of followers?” She suggested that their past work experiences could serve as a reference
point to answer the question. She tried not to intervene and take part in the conversation to create a group dynamic among the participants. The researcher just made sure that everyone participated equally, that no one remained silent. Afterwards, participants were asked to describe the behaviors of a leader which would decrease the performance and the satisfaction of employees in order to discover what a transformational leader should not do in an organization. The discussion was tape-recorded during the whole time, transcribed and content analyzed afterwards.
Focus Group 2
The second focus group was administered on-line with seven people. Three of them were bankers, (branch manager, regional office manager and internal auditor), two participants were working in leasing, another one in logistics and the last one was working in healthcare industry. They were all college graduates; some of them had MBA degree. The range of age changed between 40 and 46. The participants knew each other; hence they were not reticent to express their ideas. The conversation lasted approximately one hour and a half.
The conversation started with a brief definition of transformational leadership, its effects on the outcomes of the employee and/or the organization. The researcher pointed the differences between a transactional and a transformational leader and asked them:
“According to you, what are the behaviors of a transformational leader that can lead to better performance and affective outcomes on the part of followers?” As the participants were more
101 transformational and also transactional leadership behaviors and it was possible to identify
the affective outcomes of these behaviors since they were freely expressed in the conversation. The researcher tried to assure that everybody participated equally and asked sometimes to elaborate more on what is defined generally. The transcript of the study was printed out and content analyzed upon completion.
b. In-depth interviews
After the completion of focus groups, four in-depth interviews were conducted. The first one was carried out with a 41-year-old CEO of a Turkish bank. He had been working in the banking industry for 17 years and worked in several positions in two banks. The second one was conducted with a 39-year-old woman who worked in three banks in inspection and credit marketing departments and consulting firms for years. The third one is a 36-year-old woman with a working experience of 15 years in HR departments of several banks. The fourth interview was conducted with a 34-year-old woman who had been working for 11 years; she worked in two banks in inspection and HR departments. She was the manager of the HR department of a Turkish prêt-a-porter firm at the moment of the interview.
The first in-depth interview was conducted at the house of the researcher, it lasted one hour. Three other in-depth interviews were conducted by means of video chat. The conversations were tape-recorded, transcribed and content analyzed. The second in-depth interview lasted one hour and fifteen minutes, the third one 1 hour and the last one 45 minutes.
The researcher started the in-depth interviews as she started the focus groups discussions. She, first, defined transformational leadership behaviors, mentioned the effects of transformational leadership behaviors on the outcomes of the employees and/or the organization and clarified the differences between transactional and transformational leadership. Then, the following question was asked: “According to you, what are the
behaviors of a transformational leader that can lead to better performance and affective outcomes on the part of followers?” However, during the interviews, depending on the
answers of the interviewees, the researcher asked additional questions to clarify the answers or she, sometimes, intervened to concentrate on the topic when the interviewees started digressing.
c. Limitations
Due to time and space constraints, it was possible to conduct only two focus groups. One of them was conducted on-line because participants were working during the week, they were dwelling in different parts of Istanbul and they could not reach an agreement on a date to gather. On-line focus groups offer time and space advantages, but on-line environments eliminate the expressive functions of paraverbal cues. (Montoya-Weiss et al., 1998). As a result, the author of this paper found it necessary to encourage participants to use longer and more complex syntax in order to convey meaning through text. Also, parallel
r r
communication among participants, if existed, was beyond the control of the author since they may have had a conversation by means of other virtual environments at the same time.
4. Item List
The transcripts of focus groups and in-depth interviews were content analyzed by the researcher. At first, there were 34 items identified. After eliminating items that were similar with those found in the literature review or related to other types of leadership behaviors, there were 23 items remaining. Consequently, the list of items was sent to two judges. Podsakoff et al. (1990) identified six dimensions in transformational leadership literature; the judges were given these six dimensions as well as an “other” category for items that they could not classify in the six dimensions. The reliability of inter-judge agreement is calculated using both Cohen’s Kappa and Reliability Index.
Cohen’s Kappa is calculated using the following formula: K= (Pa – Pc) / (1-Pc)
where
Pa is the proportion of agreed on judgments
Pc is the proportion of agreements one would expect by chance. Pa was 0.87, Pc was 0.24 thus Cohen’s Kappa was 0.83
This coefficient is sufficiently high. However, the Index of Reliability (Ir) was also calculated to confirm inter-rater agreement. Ir is calculated using the following formula:
Fo = N*I 2 + (1-I 2) * 1/k
where Fo is the observed number of agreements by both judges, N is the total number of observations, and k is number of categories. Fo is 20, N is 23, and k is 7. Thus, Ir is calculated
to be 0.93. This is also a satisfactory level of reliability.
Both Cohen’s Kappa and Index of Reliability show that, there is a satisfactory level of inter- rater agreement in categorizing the observations.
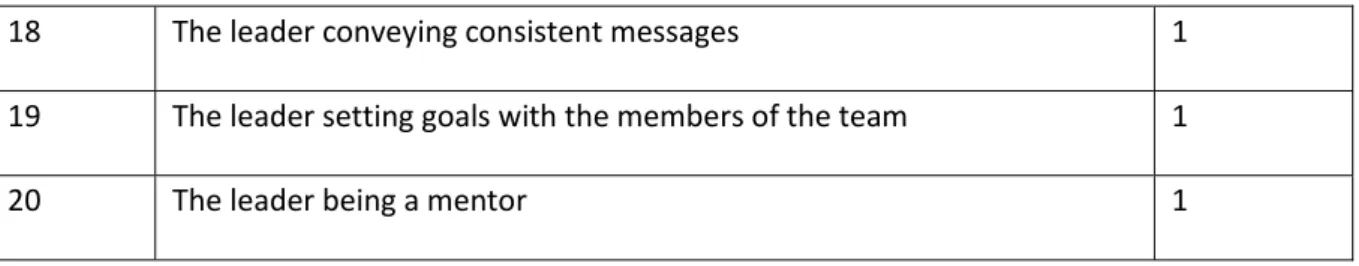
Afterwards, items that the judges could not agree on were eliminated, there were 20 items left, as shown below, representing the six dimensions of transformational leadership behaviors presented by Podsakoff et al. (1990):
103 Table 1. Items Left After Interjudge Reliability Calculations
Item
Number Item Frequency
1 The leader making the follower feel important 12
2 The leader giving feed-back on the follower’s work 9
3 The leader being interested in follower’s problems 8
4 The leader not acting aloof 6
5 The leader not giving promises that he/she cannot keep 6
6 The leader giving latitude to the follower to choose the way to reach
his/her goals 5
7 The leader not tolerating mistakes 5
8 The leader not acting superior 4
9 The leader being interested in the follower’s professional development 4
10 The leader building a personal dialogue with employees 4
11 The leader being consistent in his/her words and actions 4
12 The leader sharing with followers the vision of the organization 4
13 The leader setting challenging goals 3
14 The leader being fair to every employee 3
15 The leader allowing the follower to take initiative 2
16 The leader encouraging the follower to be creative 2
17 The leader asking the follower’s opinion about how to improve the way
18 The leader conveying consistent messages 1
19 The leader setting goals with the members of the team 1
20 The leader being a mentor 1
Then, the author combined these items with those of Podsakoff et al. (1996); items that were not similar to those generated in focus groups and in-depth interviews were picked and items that were considered ambiguous or irrelevant were omitted.
These items were randomly put into the questionnaire, the order of the statements can be found in the following table. The abbreviations used for the dimensions are also listed in the table.
Table 2. List of Combined Items Item
Name
Statement Dimension Source
V1 1. Shares with us the vision of the organization
Identifying and Articulating a Vision
In-depth interview M1 2. Is consistent in his/her words and actions Providing an Appropriate
Model
Focus group G1 3. Sets goals with the members of the team Fostering the Acceptance
of Group Goals
In-depth interview
E2 4. Does not tolerate mistakes High Performance
Expectations
Focus Group
S1 5. Makes me feel important Providing Individualized
Support
Focus Group I2 6. Gives me the latitude to choose the way to
reach my goals
Intellectual Stimulation Focus Group
S4 7. Does not act superior Providing Individualized
Support
Focus Group
G2 8. Fosters collaboration among work groups Fostering the Acceptance of Group Goals
Podsakoff et al. (1996)
105 E4 9. Insists on only the best performance High Performance
Expectations
Podsakoff et al. (1996)
M2 10. Is fair to every employee Providing an Appropriate
Model
Focus Group V5 11. Inspires others with his/her plans for the
future
Identifying and Articulating a Vision
Podsakoff et al. (1996)
M4 12. Conveys consistent messages Providing an Appropriate
Model
In-depth interview G4 13. Develops a team attitude and spirit
among employees
Fostering the Acceptance of Group Goals
Podsakoff et al. (1996) E3 14. Shows us that he/she expects a lot from
us
High Performance Expectations
Podsakoff et al. (1996)
S3 15. Is interested in my problems Providing Individualized
Support
Focus Group V2 16. Has a clear understanding of where we
are going
Identifying and Articulating a Vision
Podsakoff et al. (1996)
E5 17. Will not settle for second best High Performance
Expectations
Podsakoff et al. (1996) S6 18. Builds a personal dialogue with
employees
Providing Individualized Support
Focus Group I5 19. Has ideas that have forced me to rethink
some of my own ideas I have never questioned before
Intellectual Stimulation Podsakoff et al. (1996)
I3 20. Encourages me to be creative Intellectual Stimulation Focus Group
S7 21. Behaves in a manner thoughtful of my personal needs
Providing Individualized Support
Podsakoff et al. (1996) I1 22. Gives me feed-back on my work Intellectual Stimulation Focus Group G3 23. Encourages employees to be team players Fostering the Acceptance
of Group Goals
Podsakoff et al. (1996)
M6 24. Leads by example Providing an Appropriate
Model
Podsakoff et al. (1996)
V3 25. Paints an interesting picture of the future for our group
Identifying and Articulating a Vision
Podsakoff et al. (1996)
E1 26. Sets challenging goals High Performance
Expectations
Focus Group
S2 27. Does not act aloof Providing Individualized
Support
Focus Group I4 28. Has provided me with new ways of
looking at things which used to be a puzzle for me
Intellectual Stimulation Podsakoff et al. (1996) S5 29. Is interested in my professional development Providing Individualized Support Focus Group M5 30. Provides a good model to follow Providing an Appropriate
Model
Podsakoff et al. (1996) V4 31. Is always seeking new opportunities for
the organization
Identifying and Articulating a Vision
Podsakoff et al. (1996) M3 32. Does not give promises that he/she
cannot keep
Providing an Appropriate Model
Focus Group
(V: Identifying and Articulating a Vision, M: Providing an Appropriate Model, G: Fostering the Acceptance of Group Goals, E: High Performance Expectations, S: Providing Individualized Support, I: Intellectual Stimulation)
The author designed two questionnaires using different scales. Though the Transformational Leadership Behavior Inventory (TLI) (Podsakoff et al., 1996) used a 7-point Likert Scale, a 5- point Likert Scale was used. The second questionnaire used these statements in the same order but, a ratio scale was chosen (0-100). Both questionnaires were sent to respondents via e-mail at the same time.
5. Scale Purification and Data Analysis
The questionnaire was sent to 54 people, 33 questionnaires were sent back. The response rate is 61%. 28 respondents were working in banking industry in several levels: 20 of them were working in the same Turkish bank, 6 of them were working in another Turkish bank, 2 other respondents were working in different foreign banks in Turkey. Two respondents were working in the same insurance company and the other 3 respondents were working respectively in marketing firms. The average tenure was 31 months and the range of age changed from 23 to 56. There were 18 female (54.5 %) and 15 male (45.5%) respondents, 13
107 of them (39.4%) had a master degree and the other 20 persons (60.6%) were college
graduates.
a. Reliability analysis
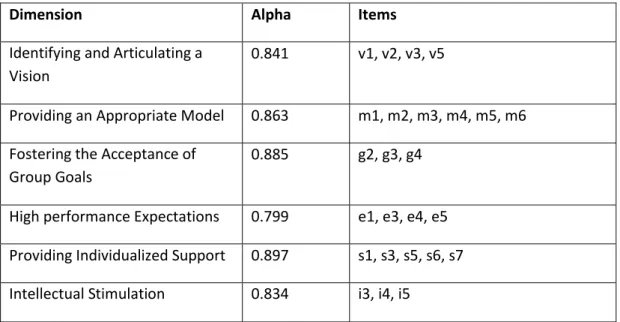
As the sample is formed of 33 cases, it is too small for a factor analysis. Thus, the author checked the reliability of the dimensions classified in the questionnaire without considering factors. The scale was reduced by investigating coefficient alpha and plotting the item-to- total scale correlations for each dimension. Items that produced a sharp drop in the plotted pattern were eliminated. Table 3 presents the coefficient alpha values and the items that were not omitted.
Table 3. Items Left After Item-To-Total Scale Correlations Calculations
Dimension Alpha Items
Identifying and Articulating a Vision
0.841 v1, v2, v3, v5
Providing an Appropriate Model 0.863 m1, m2, m3, m4, m5, m6 Fostering the Acceptance of
Group Goals
0.885 g2, g3, g4
High performance Expectations 0.799 e1, e3, e4, e5 Providing Individualized Support 0.897 s1, s3, s5, s6, s7
Intellectual Stimulation 0.834 i3, i4, i5
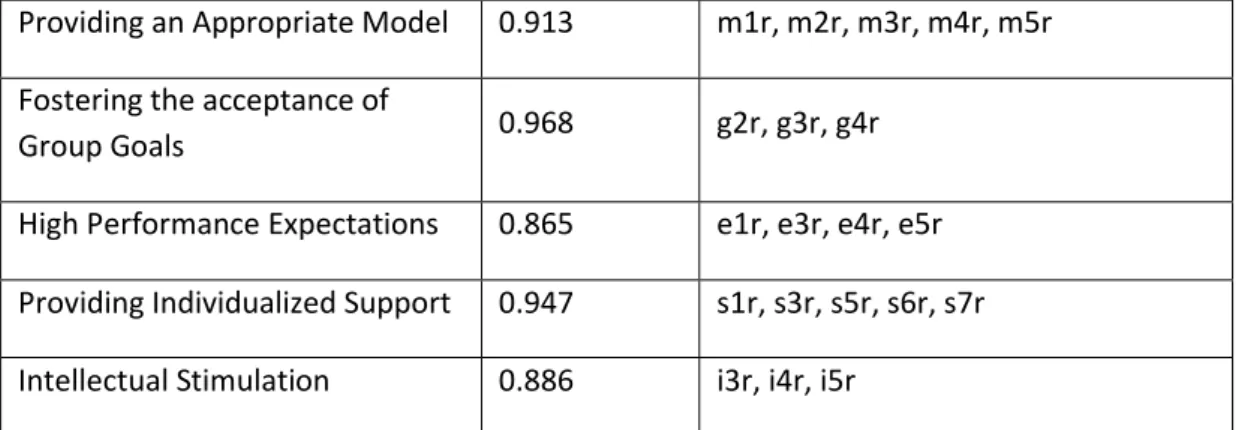
After this item purification process, total Cronbach’s alpha calculated for the 25 items is 0.945, which is highly satisfactory. The author also checked the reliability of the items in the ratio scale. The list of the items included in the dimensions is presented below:
Table 4. Items Left After Item-To-Total Scale Correlations Calculations (Ratio Scale)
Dimension Alpha Items
Identifying and Articulating a
Providing an Appropriate Model 0.913 m1r, m2r, m3r, m4r, m5r Fostering the acceptance of
Group Goals 0.968 g2r, g3r, g4r
High Performance Expectations 0.865 e1r, e3r, e4r, e5r Providing Individualized Support 0.947 s1r, s3r, s5r, s6r, s7r
Intellectual Stimulation 0.886 i3r, i4r, i5r
After this item purification process, total Cronbach’s alpha is 0.966. b. Validity analysis
Reliability, convergent validity and discriminant validity analysis are conducted using MTMM matrix. That’s why; the same questionnaire is redesigned as ratio scale with same questions. The final version of this questionnaire with 25 items is presented in Appendix A. Both questionnaires were sent to respondents at the same time. This may have caused some bias.
Table 5. The Multitrait Multimethod Matrix
Method 1 (Interval) Method 2 (Ratio)
V M G E S I V M G E S I Method 1 (Inte rva l) V 0.84 1 M 0.68 7** 0.86 3 G 0.58 7** 0.82 9** 0.88 5 E 0.58 8** 0.24 2 0.25 0 0.79 9 S 0.60 6** 0.67 2 0.71 4** 0.19 5 0.89 7
109 0.74 0.59 0.50 0.43 0.57 0.83 Method 2 (Rat io) 4** 0** 8** 8** 9** 4 V0.87 0.73 0.62 0.43 0.68 0.79 0.89 6** 3** 7** 0** 9** 4** 3 0.59 0.93 0.80 0.18 0.64 0.51 0.74 0.91 4** 9** 9** 9 5** 9** 0** 3 0.62 0.84 0.92 0.17 0.74 0.52 0.75 0.90 0.96 2** 0** 2** 4 1** 2** 3** 2** 8 0.60 0.32 0.32 0.89 0.20 0.41 0.48 0.29 0.27 0.86 8** 5 7 2** 9 5* 9** 1 5 5 0.58 9** 0.75 2** 0.77 6** 0.16 8 0.93 5** 0.60 1** 0.74 4** 0.79 1** 0.85 4** 0.22 8 0.94 7 0.76 3** 0.67 8** 0.57 6** 0.43 0* 0.54 7** 0.89 7** 0.86 2** 0.66 5** 0.67 2** 0.52 1** 0.66 3** 0. 88 6 **Correlation is significant at the 0.01 level (2-tailed)
* Correlation is significant at the 0.05 level (2-tailed)
(V: Identifying and Articulating a Vision, M: Providing an Appropriate Model, G: Fostering the Acceptance of Group Goals, E: High Performance Expectations, S: Providing Individualized Support, I: Intellectual Stimulation)
The cells with blue color represent the reliability diagonal. These figures are Cronbach’s Alpha values. It is seen from the table that all the reliability values are at high levels. Also, the ratio scale seems to be more reliable than the interval scale. Except for the values in the reliability diagonal, all the other coefficients are computed by Pearson correlations.
For high reliability measures, the reliability values should be the highest figures in the matrix. However, some of the cells in the validity diagonal have higher values than reliability measures. This was an expected situation because same questions were asked to same respondents at the same time; assumption of maximally different methods is violated. Validity diagonal values are just correlations of dimensions between two similar methods. This leads to inflated correlations in validity diagonal. If maximally different methods had been used, validity diagonal values would have been lower.
For convergent validity, coefficients in the validity diagonal should be significantly different from zero and high enough to warrant further investigation. The cells colored in orange represent the validity diagonal. Values on this diagonal are high and significantly different from zero at 0.01 level. This is a strong evidence of convergent validity.
For discriminant validity, three criteria should be met. First, a validity coefficient should be higher than values lying in its column and row in the same heteromethod block. Validity coefficient values in the matrix above are higher than all coefficients in the heterotrait- monomethod block. Second, the validity coefficients should be higher than the correlations in the heterotrait-monomethod triangles. Except one cell, this condition is also fulfilled: the correlation coefficient between G and M in the Method 2 (ratio), 0.902, is higher than validity coefficients 0.876, 0.892 and 0.897. Finally, the pattern of correlations should be the same in all the heterotrait triangles. But, we cannot observe the same pattern of trait interrelationship in all triangles. For instance, at the first column (V), 2nd, 3rd, 4th,5th and 6th
row values have a pattern of decrease (from 0.687 to 0.587), increase a little (from 0.587 to 0.588), increase (from 0.588 to 0.606) and increase again (from 0.606 to 0.744). However, when we look at the 8th, 9th, 10th, 11th and 12th rows of the same column, we see that the
trend is increase (from 0.594 to 0.622), decrease (from 0.622 to 0.608), decrease (from 0.608 to 0.589) and increase from (0.589 to 0.763). Although, the same pattern of trait interrelationship does not exist in all triangles, we can still talk about discriminant validity. Yet, it needs further improvement.
In conclusion, we can say that both methods are reliable. There is also evidence for convergent validity. But, the criteria for discriminant validity are partly met. The main reason is that providing an appropriate model and fostering the acceptance of group goals dimensions are highly correlated. The TLI of Podsakoff et al. (1990) measures six dimensions of transformational leadership. However, three dimensions (articulating a vision, providing an appropriate model, and fostering the acceptance of group goals) were found to be highly intercorrelated and were modeled as indicators of a second-order construct called core transformational leader behavior, as in Podsakoff et al. (1990). In fact, these three dimensions were expected to be highly intercorrelated as mentioned above. But, here, there are other dimensions which are highly correlated like identifying and articulating a vision and intellectual stimulation. In the original model, too, there was a similar situation, the core transformational leadership construct and intellectual stimulation were highly correlated (r= 0.84). Podsakoff et al. (1990) explained that situation by quoting Bass who suggested that transformational leader behaviors (especially articulating and propagating new ideas and beliefs) may be a key determinant of the intellectual stimulation of followers. By the same token, articulating a vision may be understood by the employee that the leader expresses his/her high performance expectations from employees. High performance expectations dimension is not correlated with providing an appropriate model, providing individualized support and fostering the acceptance of group goals dimensions as expected. As for other correlations between other dimensions, like identifying and articulating a vision and providing individualized support, Buttler et al. (1999) identified a similar pattern, their sample was a small one (N=78) and they collected data from one company. In the present study,
111 approximately % 60 of the data was collected from a Turkish bank’s employees. Therefore,
by using large samples, this high intercorrelation problem can be overcome. Podsakoff et al. (1996) collected data from 1539 employees across a very wide variety of different industries, organizational settings, and job levels; the correlations coefficients were lower but still existant. For example, the correlation coefficient between providing individualized support and providing an appropriate model was 0.54. Bommer et al. (2005) explain that high intercorrelation among transformational leadership behaviors dimensions is not unusual in literature examining transformational leadership behavior since they are hypothesized dimensions of an underlying conceptual framework. As the author used the same dimensions and picked some of the original items along with items generated from the qualitative study, high intercorrelations among dimensions were expected.
c. Limitations
There are several limitations to this study. First, sample size is small, 33 is a minimum level. Second, the two questionnaires were sent at the same time. This causes a risk of bias in the results because the respondents may check their answers and try to be consistent with their first answers.
6. The Effects of Transformational Leadership Behaviors on Followers’ Job
Satisfaction
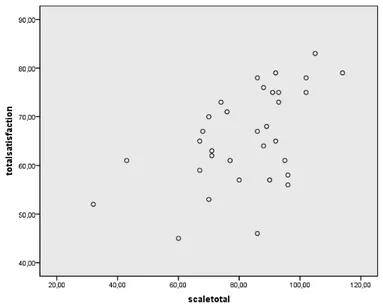
While filling out the newly created Transformational Leadership Scale (TLS), respondents were also asked to fill out the 20-item short form of the Minnesota Satisfaction Questionnaire (MSQ, 1977) (Appendix B). The Minnesota Satisfaction Questionnaire (MSQ) is designed to measure employees’ satisfaction with their particular job. There are five answer choices ranging from very dissatisfied to very satisfied. The MSQ has been shown to possess generally good psychometric properties and correlates well with other measures of job satisfaction. Correlation coefficients between the total score of the scale (interval scale- purified version) and the total score of the MSQ were calculated. The author, first, checked the distribution of data points to see if they are suitable for Pearson correlation calculations.
Figure 1. Distribution of Data Points
It seems that there is a positive relationship between transformational leadership behaviors and followers’ job satisfaction. After that, the bivariate correlation between the total scores of the new scale (TLS) and the MSQ was calculated.
Table 6. Pearson Correlation between the TLS and the MSQ Total
Satisfaction Scale Total Total
Satisfaction
Pearson Correlation 1 ,528**
Sig. (2-tailed) ,002
N 33 33
Scale Total Pearson Correlation ,528** 1
Sig. (2-tailed) ,002
N 33 33
**. Correlation is significant at the 0.01 level (2-tailed).
The Pearson correlation coefficient is 0.528 (significant at the 0.01, 2-tailed), that means that there is a positive correlation between transformational leadership behaviors and followers’ job satisfaction. There is quite a strong relationship between them. The coefficient of determination is 0.279; transformational leadership behaviors help to explain nearly 28% of the variance in respondents’ scores on the job satisfaction scale.
The author, also, checked the correlations among the dimensions of TLS and total satisfaction. The values on the diagonal are Cronbach’s alpha values.
113 Table 7. Reliability Statistics of the MSQ
Cronbach's Alpha N of Items
,833 20
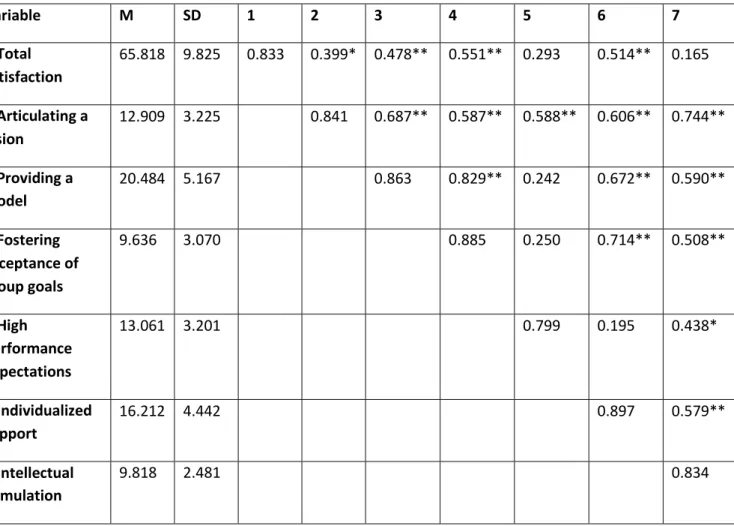
Table 8. Correlation Values among the Dimensions of the TLS and Total Satisfaction
Variable M SD 1 2 3 4 5 6 7 1.Total satisfaction 65.818 9.825 0.833 0.399* 0.478** 0.551** 0.293 0.514** 0.165 2.Articulating a vision 12.909 3.225 0.841 0.687** 0.587** 0.588** 0.606** 0.744** 3.Providing a model 20.484 5.167 0.863 0.829** 0.242 0.672** 0.590** 4.Fostering acceptance of group goals 9.636 3.070 0.885 0.250 0.714** 0.508** 5.High performance expectations 13.061 3.201 0.799 0.195 0.438* 6.Individualized support 16.212 4.442 0.897 0.579** 7.Intellectual stimulation 9.818 2.481 0.834
Note: N= 33. Alpha values are on the diagonal. * Correlation is significant at the 0.05 level (2-tailed) ** Correlation is significant at the 0.01 level (2-tailed
Job satisfaction of the employees’ is significantly correlated with all dimensions except for high performance expectations and intellectual stimulation. In other words, the “core” transformational leader behaviors (the first three dimensions) and individualized support are positively correlated with employees’ job satisfaction. Intellectual stimulation and high performance expectations may not have an effect on the satisfaction of employees because these behaviors require the change of the routine, it means challenge for them. If these behaviors are overemphasized, they may have a negative influence on follower’s job satisfaction as it will increase their stress.
a. Limitations
The relation between job satisfaction and transformational leadership behaviors was measured by the bivariate correlation between the results of the new transformational leadership scale and the MSQ. The respondents providing the measure of the predictor and criterion variable were the same persons. This may have created a common method bias and consequently, the correlation coefficient might be inflated.
7. Conclusion
Transformational leadership has been a subject of interest during the last couple of decades. Many researchers have studied this topic and some developed scales to measure its dimensions. The author tried to develop the scale of Podsakoff et al. (TLI, 1996) and to adapt it for studies conducted in the Turkish organizational setting. Upon completion of the literature review, two focus groups and four in-depth interviews were carried out to generate items. Two questionnaires, one with interval scale and one with ratio scale, composed of 32 items were prepared and sent to respondents. Data were collected from a sample of 33 respondents. The author used the six dimensions of transformational leadership as presented in the original scale of Podsakoff et al. (1996). After the item purification process and reliability analysis, 25 items were left. Cronbach’s alpha values were calculated, and they resulted in satisfactory levels for a newly developed scale. The author employed MTMM matrix for further reliability and validity issues. Although the 2 methods used are not maximally different, the correlation values in MTMM matrix were compared to assess reliability and convergent validity; convergent validity is ensured. As for discriminant validity, the scale might need further improvement. Additionally, a bigger sample would give a better chance to evaluate the psychometric properties of the transformational leadership scale. Then, it would be possible to perform a factor analysis, for example.
After the development of the scale, the author tried to define the relationship between transformational leadership behaviors and followers’ job satisfaction by means of the MSQ sent at the same time with the questionnaires. The scale in the interval form was used to compute Pearson correlation coefficients. The author, first, checked the correlations between the total scores of the scale and the MSQ. Then, correlation coefficients between every dimension of transformational leadership behaviors and followers’ job satisfaction
115 were calculated. Transformational leader behaviors in total were largely correlated with
followers’ job satisfaction, but when the correlations of each dimension with followers’ job satisfaction were checked, high performance expectations and intellectual stimulation were not significantly correlated with job satisfaction. That is a plausible situation because the change of the routine and challenge may not have an effect on the job satisfaction of employees; in fact, if overemphasized, these two dimensions may have a negative influence. As the author used the same respondents, this may have caused a common method variance, the correlation coefficients might be inflated. Also, for future research, it would be interesting to measure the effects of moderators and/or mediators on this relationship between transformational leader behaviors and followers’ job satisfaction.
REFERENCES
Alimo-Metcalfe, Beverly and Robert J. Alban-Metcalfe (2001). “The Development of a New Transformational Leadership Questionnaire”; Journal of Occupational and Organizational
Psychology, 74, s. 1-27.
Avolio, Bruce J., Zhu, Weichun, Koh, William and Bhatia Puja (2004). “Transformational Leadership and Organizational Commitment: Mediating Role of Psychological Empowerment and Moderating Role of Structural Distance”; Journal of Organizational Behavior, 25, s. 951- 968.
Barbuto, John E. Jr. (2005). “Motivation and Transactional, Charismatic, and Transformational Leadership: A Test of Antecedents”; Journal of Leadership and
Organizational Studies, 11(4), s. 26-40.
Barnett, Kerry and John McCormick (2004). “Leadership and Individual Principle-Teacher Relationships in Schools”; Educational Administration Quarterly, 40(3), s. 406-434.
Bass, Bernard M. and Bruce J. Avolio (1990a). Multifactor Leadership Questionnaire, Palo Alto, CA: Consulting Psychologists.
Bass, Bernard M. and Bruce J. Avolio (1990b). Transformational Leadership Development
Manual for the Multifactor Leadership Questionnaire, Palo Alto, CA: Consulting Psychologists.
Bass, Bernard M. (1998). Transformational Leadership: Industrial, Military, and Educational
Impact, Mahwah, NJ: Erlbaum.
Bass, Bernard M. (1999). “Two Decades of Research and Development in transformational Leadership”; European Journal of Work and Organizational Psychology, 8(1), s. 9-32.
Bass, Bernard M., Avolio, Bruce J., Jung, Dong I. and Yair Berson (2003). “Predicting Unit Performance by Assessing Transformational and Transactional Leadership”; Journal of
Applied Psychology, 88(2), s. 207-218.
Bommer, William H., Rich, Gregory A and Robert S. Rubin R. (2005). “Changing Attitudes about Change: Longitudinal Effects of Transformational Leader Behavior on Employee Cynicism About Organizational Change; Journal of Organizational Behavior, 26, s. 733-753. Burns, James M. (1978). Leadership. New York: Harper & Row.
Butler Jr, John K., Cantrell, R. Stephen and Randall J. Flick (1999). “Transformational Leadership Behaviors, Upward Trust, and Satisfaction in Self-Managed Work Teams”
117 Carless, Sally A. (1998). “Assessing the Discriminant Validity of Transformational Leader
Behaviors as Measured by the MLQ”; Journal of Occupational and Organizational Psychology, 71(4), s. 353-358.
Carless, Sally A., Wearing, Alexander J. and Leon Mann (2000). “A Short Measure of Transformational Leadership”; Journal of Business and Psychology, 14(3), s. 389-405.
Dvir, Taly, Eden, Dov, Avolio, Bruce J. and Boas Shamir (2002). “Impact of Transformational leadership on Follower Development and Performance: A Field Experiment”; Academy of
Management Journal, 45(4), s. 735-744.
Harms, Peter D., Credé, Marcus, Tynan, Michael, Leon, Matthew and Wonho Jeung (2017). “Leadership and Stress: A Meta-Analytic Review”; Leadership Quarterly, 28(1), s. 178-194. Judge, Timothy A. and Ronald F. Piccolo (2004). “Transformational and Transactional Leadership: A Meta-Analytic Test of Their Relative Validity”; Journal of Applied Psychology, 89(5), s. 755-768.
Jyoti, Jeevan and Sonia Bhau (2015). “Impact of Transformational Leadership on Job Performance: Mediating Role of Leader–Member Exchange and Relational Identification”; SAGE Open, October-December, s. 1-13.
Kirkman, Bradley L., Chen, Gilad, Farh, Jiing-Lih, Chen Zhen Xiong and Kevin B. Lowe (2009). “Individual Power Distance Orientation and follower Reactions to Transformational Leaders: A Cross-Level, Cross-Cultural Examination”; Academy of Management Journal, 52(4), s. 744- 764.
Kuhnert Karl W. and Philip Lewis (1987). “Transactional and Transformational Leadership: A Constructive/Developmental Analysis”; Academy of Management Review, 12(4), s. 648-657. Lowe, Kevin B., Kroeck, K. Galen and Nagaraj Sivasubramaniam (1996). “Effectiveness Correlates of Transformational and Transactional Leadership: A Metaanalytic Review”;
Leadership Quarterly, 7(3), s. 385–425.
Montoya-Weiss, Mitzi M., Massey, Anne P. and Danial L. Clapper (1998). “On-line Focus Groups: Conceptual Issues and A Research Tool”; European Journal of Marketing, 32(7/8), s. 713-723.
Morgan, David L. (1997). Focus Groups as Qaulitative Research, California, USA: Sage. Pillai, Rajnandini, Schriesheim, Chester A. and Eric S. Williams (1999). “Fairness Perceptions and Trust as Mediators for Transformational and Transactional Leadership: A Two-Sample Atudy”; Journal of Management, 25(6), s. 897-933.
Podsakoff, Philip M., MacKenzie, Scott B., Moorman, Robert H. and Richard Fetter (1990). “Transformational Leader Behaviors and Their Effects on Followers’ Trust in Leader, Satisfaction, and Organizational Citizenship Behaviors”; Leadership Quarterly, 1(2), s. 107- 142.
Podsakoff, Philip M., MacKenzie, Scott B. and William H. Bommer (1996). “Transformational Leader Behaviors and Substitutes for Leadership as Determinants of Employee Satisfaction, Commitment, Trust, and Organizational Citizenship Behaviors”; Journal of Management, 22(2), s. 259-298.
Purvanova, Radostina K., Bono, Joyce E. and Jessica Dzieweczynski (2006). “Transformational Leadership, Job Characteristics, and Organizational Citizenship Performance”; Human Performance, 19(1), s. 1-22.
Rafferty, Alannah E. and Mark A. Griffin (2004). “Dimensions of Transformational Leadership: Conceptual and Emprical Extensions”; Leadership Quarterly, 15(3), s. 329-354. Sparks, John R. and Joseph A. Schenk (2001). “Explaining the Effects of Transformational Leadership: An Investigation of The Effects of Higher-Order Motives in Multilevel Marketing Organizations”; Journal of Organizational Behavior, 22, s. 849-869.
Tejeda, Manuel J., Scandura, Terri A. and Rajnandini Pillai (2001). “The MLQ revisited: Psychometric properties and recommendations”; Leadership Quarterly, 12(1), s. 31-52. Walumbwa, Fred Ochieng and John J. Lawler (2003). “Building Effective Organizations: Transformational Leadership, Collectivist Orientation, Work-Related Attitudes, and Withdrawal Behaviors in Three Emerging Economies”; International Journal of Human
Resource Management, 14(7), s. 1083-1101.
Whitford, Tarli and Simon A. Moss (2009). “Transformational Leadership in Distributed Work Groups: The Moderating Role of Follower Regulatory Focus and Goal Orientation”;
Communication Research, 36(6), s. 810-837.
Yukl, Gary (1999a). “An evaluation of conceptual weaknesses in transformational and charismatic leadership”; Leadership Quarterly, 10(2), s. 285-305.
119 Yukl, Gary (1999b). “An evaluative essay on current conceptions of effective leadership”;
European Journal of Work and Organizational Psychology, 8(1), s. 33-48.
Zacharatos, Anthea, Barling, Julian and E. Kevin Kelloway (2000). “Development and Effects of Transformational Leadership in Adolescents”; Leadership Quarterly, 11(2), s. 211-226. Zhu, Weichun., Avolio, Bruce J. and Fred Ochieng Walumbwa (2009). “Moderating Role of Follower Characteristics with Transformational Leadership and Follower Work Engagement”;
Group & Organization Management, 34(5), s. 590-619.
APPENDIX A. Transformational Leadership Scale (TLS)
Please place a cross mark (x) in the box that best represents your level of agreement with the statement about your superior’s behaviors below.
My superior: Strongly Disagree Disagree Neither Agree nor Disagree Agree Strongly Agree
1. Shares with us the vision of the organization
2. Is consistent in his/her words and actions
3. Makes me feel important
4. Fosters collaboration among work groups
5. Insists performance
on only the best 6. Is fair to every employee
7. Inspires others with his/her plans for the future
8. Conveys consistent messages 9. Develops a team attitude and spirit among employees
10. Shows us that he/she expects a lot from us
12. Has a clear understanding of where we are going
13. Will not settle for second best 14. Builds a personal dialogue with employees
15. Has ideas that have forced me to rethink some of my own ideas I have never questioned before
16. Encourages me to be creative 17. Behaves in a manner thoughtful of my personal needs
18. Encourages employees to be team players
19. Paints an interesting picture of the future for our group
20. Sets challenging goals
21. Has provided me with new ways of looking at things which used to be a puzzle for me
22. Is interested in my professional development
23. Provides a good model to follow 24. Is always seeking new opportunities for the organization 25. Does not give promises that he/she cannot keep
APPENDIX B. MINNESOTA SATISFACTION QUESTIONNAIRE
The purpose of this questionnaire is to give you a chance to tell how you feel about their present job, what things you are satisfied with and what things you are not satisfied with. On the basis of your answers and those of people like you, we hope to get a better
understanding of the things people like and dislike about their jobs. On the next page you will find statements about your present job. 1. Read each statement carefully.
121 Keeping the statement in mind:
• if you feel that your job gives you more than you expected, put a cross mark (x) under “Very Sat.” (Very Satisfied);
• if you feel that your job fives you what you expected, put a cross mark (x) under “Sat.” (satisfied);
• if you cannot make up your mind whether or not the job gives you what you expected, put a cross mark (x) under “N” (Neither Satisfied nor Dissatisfied);
• if you feel that your job fives you less than you expected, put a cross mark (x) under “Dissat.” (Dissatisfied);
• if you feel that your job fives you much less than you expected, put a cross mark (x) under “Very Dissat.” (Very Dissatisfied).
3. Remember: Keep the following guidelines in mind when deciding how satisfied you feel about that aspect of your job.
4. Do this for all statements. Please answer every item.
5. Be frank and honest. Give a true picture of your feelings about your present job. Ask yourself: How satisfied am I with this aspect of my job?
Very Sat. means I am very satisfied with this aspect of my job. Sat. means I am satisfied with this aspect of my job.
N means I can’t decide whether I am satisfied or not with this aspect of my job. Dissat. Means I am dissatisfied with this aspect of my job.
Very Dissat. Means I am very dissatisfied with this aspect of my job. On my present job, this is how I feel about …
Very
Dissat. Dissat. N Sat.
Very Sat. 1. Being able to keep busy all the time
2. The chance to work alone on the job
3. The chance to do different things from time to time
4. The chance to be “somebody” in the community 5. The way my boss handles his/her workers 6. The competence of my supervisor in making decisions
7. Being able to do thinks that don’t go against my conscience
8. The way my job provides for steady employment 9. The chance to do things for other people
10. The chance to tell people what to do
11. The chance to do something that makes use of my abilities
12. The way company policies are put into practice 13. My pay and the amount of work I do
14. The chances for advancement on this job. 15. The freedom to use my own judgment
16. The chance to try my own methods of doing the job
17. The working conditions
18. The way my co-workers get along with each other
19. The praise I get for doing a good job
20. The feeling of accomplishment I get from the job