See discussions, stats, and author profiles for this publication at: https://www.researchgate.net/publication/43255039
Detection of Underdeveloped Hazelnuts from
Fully Developed Nuts by Impact Acoustics
Article · November 2006 DOI: 10.13031/2013.22277 · Source: OAI CITATIONS22
READS72
4 authors, including: Ibrahim Onaran Mevlana University 30 PUBLICATIONS 204 CITATIONS SEE PROFILE T.C. Pearson United States Department of Agriculture 85 PUBLICATIONS 1,264 CITATIONS SEE PROFILE A. Enis Cetin Bilkent University 280 PUBLICATIONS 3,923 CITATIONS SEE PROFILEAll content following this page was uploaded by Ibrahim Onaran on 01 June 2014.
D
ETECTION
OF
U
NDERDEVELOPED
H
AZELNUTS
FROM
F
ULLY
D
EVELOPED
N
UTS
BY
I
MPACT
A
COUSTICS
I. Onaran, T. C. Pearson, Y. Yardimci, A. E. Cetin
ABSTRACT. Shell-to-kernel weight ratio is a vital measurement of quality in hazelnuts as it helps to identify nuts that have
underdeveloped kernels. Nuts containing underdeveloped kernels may contain mycotoxin-producing molds, which are linked to cancer and are heavily regulated in international trade. A prototype system was set up to detect underdeveloped hazelnuts by dropping them onto a steel plate and recording the acoustic signal that was generated when a kernel hit the plate. A feature vector comprising line spectral frequencies and time-domain maxima that describes both the time and frequency nature of the impact sound was extracted from each sound signal and used to classify each nut by a support-vector machine. Experimental studies demonstrated accuracies as high as 97% in classifying hazelnuts with underdeveloped kernels.
Keywords. Aflatoxin, Classification, Detection, Nut, Sound.
azelnuts (Corylus avellana) are widely used in chocolate and flavored coffee products. One of the main attributes that determine quality in raw bulk hazelnuts is the ratio of kernel weight to shell weight. Empty hazelnuts and hazelnuts containing underde-veloped kernels negatively affect this ratio. If the ratio of ker-nel weight to gross weight is less than 0.5, buyers may reject the produce. Occasionally, plant stress from dehydration or lack of nutrients causes a hazelnut shell to develop without a kernel. In addition, insect damage can stunt the maturation process and prevent a kernel from developing fully by harvest time. A nut with an underdeveloped kernel appears like a nor-mal hazelnut from the outside. Currently, raw hazelnuts are processed by an “airleg,” which is a pneumatic device that separates underdeveloped hazelnuts from fully developed nuts. These devices, however, have high classification error rates. There remains a need for more advanced systems to im-prove the segregation of underdeveloped from fully devel-oped hazelnuts. In addition, hazelnuts containing under-developed kernels may also contain the mold Asperguillus
flavus, which produces aflatoxin, a known carcinogen
(Marklinder et al., 2005). Accordingly, a more accurate clas-sification of hazelnuts will also contribute to improved food safety for consumers.
Submitted for review in September 2005 as manuscript number IET 6057; approved for publication by the Information & Electrical Technologies Division of ASABE in September 2006.
Mention of trade names or commercial products in this publication is solely for the purpose of providing specific information and does not imply recommendation or endorsement by the USDA.
The authors are Ibrahim Onaran, Research Assistant, Department of Electrical and Electronics Engineering, Bilkent University, Ankara, Turkey; Tom C. Pearson, ASABE Member Engineer, Agricultural Engineer, USDA-ARS Grain Marketing and Production Research Center, Manhattan, Kansas; Yasemin Yardimci, Professor, Informatics Institute, Middle East Technical University, Ankara, Turkey; and A. Enis Cetin, Professor, Department of Electrical and Electronics Engineering, Bilkent University, Ankara, Turkey. Corresponding author: T. C. Pearson, USDA-ARS GMPRC, 1515 College Ave., Manhattan, KS 66502; phone: 785-776-2729; fax: 785-537-5550; e-mail: [email protected]. edu.
Fully developed hazelnuts can be distinguished from underdeveloped hazelnuts by weighing the nuts individually or by shelling each nut, neither of which is economically viable. A high-throughput, low-cost acoustical system for sorting pistachio nuts has been developed to separate nuts with closed shells from those with cracked shells (Pearson, 2001; Cetin et al., 2004a, 2004b). In this system, pistachio nuts were dropped onto a steel plate and the sound of the impact was analyzed in real-time. As expected, nuts with closed shells produced a different sound than those with cracked shells. Classification accuracy of this system was approximately 97%, with a throughput rate of approximately 20 to 40 nuts per second, and the system works reliably in a food processing environment and requires little maintenance or skill for its operation. An air valve is used to separate closed-shell from open-shell nuts in the processing stream. A similar prototype system is proposed for hazelnuts based on impact acoustics. It was observed that the algorithms described by Pearson (2001) and Cetin et al. (2004a, 2004b) did not produce high classification accuracy in hazelnuts. The purpose of this study is to explore other signal processing techniques such as line spectral frequencies, discrete Fourier transforms (DFTs), and some time domain parameters to determine the most accurate method for classifying full and underdeveloped hazelnuts.
M
ATERIALS ANDM
ETHODS EXPERIMENTAL APPARATUSA prototype system that dropped nuts onto a steel plate and processed the acoustic signal generated when nuts hit the plate was developed. The system was able to process and reject 20 to 40 nuts per second. An air valve removed underdeveloped nuts; however, the study did not take this into consideration in determining the feasibility of this method.
The prototype included a chute, inclined 60° above the horizontal, on which hazelnuts slid down and were projected onto an impact plate, and the acoustic signals were recorded from the impact. The impact plate was a polished block of
1972 TRANSACTIONSOFTHE ASABE
stainless steel with a depth of 2 cm. The mass of the impact plate was much larger than the hazelnuts in order to minimize vibrations from the plate interfering with acoustic signals from the kernels. A unidirectional condenser microphone sensitive to frequencies up to 20 kHz was used to capture impact sounds. The sound card in a typical personal computer was used to digitize the microphone signals at a sampling rate of 48 kHz and 16-bit resolution and then store the microphone signals for analysis.
Two varieties of hazelnuts were used in the experiments: “Levant” hazelnuts from the Duzce region of Turkey, and “Giresun” hazelnuts from the Ordu region of Turkey. All experiments were conducted using 492 impact sounds comprising 231 underdeveloped and 261 full Levant-type hazelnuts and 572 impact sounds of 282 underdeveloped and 290 full Giresun-type hazelnut impact sounds. Levant and Giresun type hazelnuts come from the eastern and western Black Sea regions, respectively. Giresun-type hazelnuts are relatively larger compared to Levant-type hazelnuts. These two varieties cover the range of sizes that a hazelnut classification system would encounter.
SIGNAL PROCESSING
Several features were extracted from the impact sound signal using five different methods: (1) modeling of the signal in the time domain, (2) computing time domain signal variances in short-time windows, (3) maxima values in short-time windows, (4) analysis of the frequency spectra magnitudes, and (5) line spectral frequencies (LSFs). Each of these methods is discussed below. Combinations of several of these features were tested for their ability to yield high classification accuracy.
Time-Domain Signal Modeling
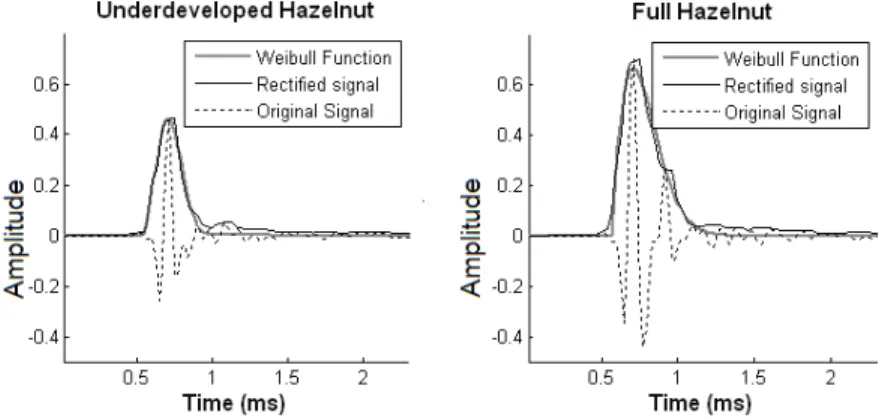
Typical signals from a full hazelnut and from an underdeveloped hazelnut are shown in figure 1. The extreme amplitudes of the signals are quite variable, but in general, the extremes of full hazelnuts are higher than the extremes of underdeveloped hazelnuts. Additionally, the duration of signals emanating from nuts with full kernels tends to be longer than the signals emanating from underdeveloped hazelnuts. To characterize these types of signal responses, each signal was modeled in the time domain after transform-ing it in the followtransform-ing steps:
1. Rectify the signal by taking the absolute value at all points.
2. Filter the signal in a non-linear way by replacing the center data point with the maximum value in a seven-point window.
3. Estimate the four parameters of the Weibull function, shown in equation 1, which has a shape similar to the envelope of the processed time domain signal:
0 ) ( otherwise ; for ) ( 0 ) 1 ( 0 0 = > − = − − − t Y t t e a t t a cb t Y b a t t b (1) The Weibull parameters a, b, c, and R2 (the coefficient of multiple determinations for curve fitting) were used as classifying features. Figure 2 shows rectified and filtered sound signals and the corresponding Weibull functions.
Figure 1. Typical impact sound signals from an underdeveloped hazelnut (left) and a full hazelnut (right). The extreme value of a full hazelnut is usually higher than that of an underdeveloped hazelnut. Sound amplitudes ranged between a minimum of −1 V and a maximum of 1 V.
Figure 2. The rectified signal (black line) and non-linear filtered signal (dashed line) corresponding to the sound signals are shown against the estimated Weibull functions (gray line). The Weibull function captures the envelope of the sound signals.
Short-Time Variances in Frames of Data
In addition to the Weibull function based on envelope modeling of impact sounds, variances of these signals were also computed in short-time windows. The Weibull function captures the shape of the recorded signal globally, and the short-time variance information characterizes the local time-domain variations in the signal. The short-time win-dows were 50 points in duration and increased in increments of 30 points so that each window overlapped by 20 points. The first window began 40 points in front of the maximum of each signal. Eight short-time windows were computed to cover the entire duration of all impact signals. After all variances were computed, they were normalized by the sum of all eight variances as follows:
∑
=σ σ = σ 8 1 2 2 2 i i i ni (2)where s2ni and s2i are the normalized and computed vari-ances from window i, with i = 1 being the first window and
i = 8 being the last. This method takes into account the
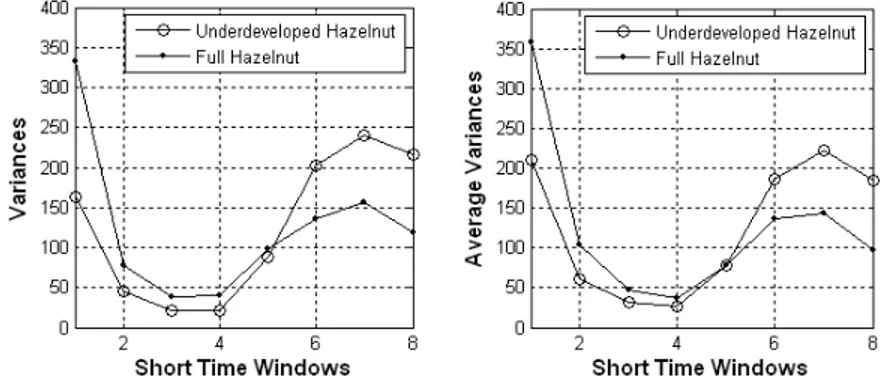
in-creased duration of the signals from underdeveloped hazel-nuts. As can be seen from figure 3, the average normalized variances of the last three windows are greater for underde-veloped hazelnuts compared with full hazelnuts.
Maxima in Short-Time Windows
A window comprising 165 samples starting from 30th sample after the peak sound magnitude was divided into 11
non-overlapping time-domain windows, and the maximum value of each window was selected as a feature value. Maxima in short-time windows also capture the envelope of the impact sound similar to the variances in short-time windows.
Frequency Domain Processing
A 256-point discrete Fourier transform (DFT) was computed from each signal using a Hamming window. The 256-point window covers the impact sound of hazelnuts starting at about 80 data points before the signal maximum slope, which corresponds to the moment of impact for the kernel. The magnitude of each spectrum was computed and then low-pass filtered using a 20-tap finite impulse response (FIR) filter that was applied to remove jagged spikes in the spectra. The low-pass filter had a cutoff frequency of p/4 in the normalized DFT domain. As can be seen in figure 4, the frequency spectrum of underdeveloped nuts has a single sharp peak between 1 and 10 kHz. On the other hand, full hazelnuts generally have two peaks, one sharp peak and another broader peak, in the same frequency range. In this example, peaks of the spectra of full hazelnuts and underde-veloped hazelnuts are clearly distinguishable; however, there are significant numbers of examples in which twin peaks of full hazelnuts are not clearly visible, possibly due to noise. The frequency corresponding to the peak magnitude in the frequency spectra was saved as a potential discriminating feature. In addition, the 15 magnitude values before the peak and 15 points after the peak were saved and normalized by the peak magnitude.
Figure 3. Variances of short-time windows of the time domain signals in figure 1 (left) and average variances from short-time windows of the time do-main signals (right).
Figure 4. Example frequency spectra magnitudes for an underdeveloped hazelnut (left) and a full hazelnut (right). Vertical lines correspond to phase angles of line spectral frequencies for each nut.
1974 TRANSACTIONSOFTHE ASABE
Line Spectral Frequencies
Linear predictive modeling techniques are widely used in various speech coding, synthesis, and recognition applica-tions (Quatieri, 2001). Linear minimum mean square error (LMMSE) prediction-based data analysis is equivalent to auto-regressive (AR) modeling of the data. Line spectral frequency (LSF) representation of the linear prediction (LP) filter was introduced by Itakura (1975) and used in common cell phone communication systems, including the GSM and MELP speech coding systems (Quatieri, 2001). In LMMSE analysis, it is assumed that sound data can be modeled using an mth order linear predictor, i.e.:
] [ ] 2 [ ] 1 [ ] [n a1xn a2xn a xn m xp = − + − +K + m − (3)
where x[n − k] is the sound sample at time instant (n − k)Ts, and xp[n] is the estimated sound sample at time instant nTs (Ts is the sampling period). The error signal at index n is e[n] =
x[n] − xpn. The filter coefficients (ak) are determined by mini-mizing the mean square error: s2e = E[(x[n] − xp[n])2] (Mitra, 2002, 11.4.2: 776-779). The following set of linear equations are obtained by taking the partial derivative of E[(x[n] −
xp[n])2] with respect to the filter coefficients (ak) and setting the results to zero:
] [ ] 0 [ ] 3 [ ] 2 [ ] 1 [ ] 3 [ ] 3 [ ] 0 [ ] 1 [ ] 2 [ ] 2 [ ] 2 [ ] 1 [ ] 0 [ ] 1 [ ] 1 [ ] 1 [ ] 2 [ ] 1 [ ] 0 [ 3 2 1 3 2 1 3 2 1 3 2 1 m r a r a m r a m r a m r r a m r a r a r a r r a m r a r a r a r r a m r a r a r a r m m m m = + + − + − + − = − + + + + = − + + + + = − + + + + K K K K L (4)
where r[k] represents the autocorrelation sequence of the zero mean sound data: r[k] = E[x[n]x[n − k]]. In practice, the autocorrelation sequence is directly estimated from the data, i.e.: ] [ ] [ * 1 ] [ 1 0 k n x n x N k N k n + = −
∑
− = r ^ (5)where N is the number of sound samples. In some cases, the above sum is normalized by (N − k) instead of N leading to an unbiased estimate of the autocorrelation sequence. Line spectral coefficients are computed from the linear prediction filter coefficients. The so-called mth order inverse polyno-mial Am(z) is defined as:
Am(z) = 1 + a1z −1 + ... + amz −m (6) The polynomial Am(z) is used not only in LSF computation but also in spectrum estimation. Notice that s2e/Am(eiw) is called the auto-regressive spectrum estimate of the sound data. In speech processing, m = 10 is selected for speech coding and recognition applications at a sampling frequency (fs) of 8000 Hz.
This article uses LSFs as feature parameters to represent impact sounds. The LSF polynomials of order m + 1, Pm+1(z), and Qm+1(z) are constructed by setting the (m+1)st reflection coefficient to 1 or −1. In other words, the polynomials
Pm+1(z) and Qm+1(z) are defined as:
Pm+1(z) = Am(z)+ z −(m+1) Am(z−1) (7)
Qm+1(z) = Am(z)−z −(m+1) Am(z−1) (8) Zeroes of Pm+1(z) and Qm+1(z) are called the line spectral frequencies (LSFs), and they all lie on the unit circle in the complex z-domain. Zeroes of Pm+1(z) and Qm+1(z) uniquely characterize the LPC inverse filter Am(z); that is, one can uniquely construct the LP filter coefficients from the LSFs. Phase angles of the LSFs tend to concentrate around spectrum peaks, as shown in figure 4. In these plots, phase angle range [0, p] is mapped to range [0, 24 kHz] because the sampling frequency was 48 kHz. Due to this interesting property, LSFs concisely represent the spectrum of the impact sound, and that is why they are selected as a set of sound features in this article. Additionally, computation of the LSFs is not intensive and can be carried out in real-time (Itakura, 1975).
CLASSIFIER
Support-vector machines (SVMs) have been used in a number of applications, including isolated handwritten digit detection (Cortes and Vapnik, 1995; Schölkopf et al., 1995, 1996, 1997), object recognition (Blanz et al., 1996), and face detection in images (Osuna et al., 1997). SVMs were used in this study to identify and distinguish underdeveloped hazel-nuts from fully developed hazelhazel-nuts. SVMs can be briefly explained by comparing them to the well-known method of linear discriminant analysis (LDA). With LDA, a training set is used to estimate variances and co-variances, which are used to compute Mahalanobis distances from an unknown sample to the centroid of each class (Huberty, 1994). The unknown sample is then classified into the group associated with the smallest Mahalanobis distance to the group centroid. The line where the Mahalanobis distance from each group is equal marks the decision boundary between the groups. This method assumes Gaussian distributions of data, and it works well when the data are fairly well clustered. In a two-class problem, however, data far away from the decision boundary (such as on opposite sides of the centroids) are given just as much importance as data near the decision boundary (or in-between centroids of the two classes). Sometimes these data that are far from the decision boundary contribute to higher variance within a class and lead to non-optimal placement of the decision boundary and erroneous classifica-tions.
In contrast, SVMs (Burges, 1998; Hearst, 1998; Schölkopf et al., 1999) seek to define a boundary between classes that maximizes the distance between training set samples from different classes that happen to lie near each other, and they give little importance to samples far away from the decision boundary. For example, figure 5 shows two hypothetical training sets that might be taken from a two-class training set. SVMs seek to define a boundary between two classes as a line that intersects the minimum distance between the hulls (dotted line) between two groups. Thus, classification by SVM is concerned only with data from each class near the decision boundary, called support vectors. Another advan-tage of SVMs is that no assumption needs to be made about the distribution of the data. The data need not be normally distributed nor even continuously distributed. Algorithms to compute the boundary line as a polynomial, a sigmoid, or a radial basis function have been developed.
The radial base function (RBF) or kernel function was used in this study to detect underdeveloped hazelnuts. The
Figure 5. Decision boundary determination by SVM using a linear kernel. Black dots indicate feature vectors of the first class, and white circles indi-cate feature vectors of the second class. Lines (or hyperplanes in higher dimensions) separate the decision regions of the first and second classes.
SVM classification was performed using a free software package called LIBSVM (Chang and Lin, 2001). This pack-age scales the features between −1 and 1. The SVM was trained and tested on randomly selected data subsets of equal sizes. Four groups of test and training sets were constructed by random selection four different times. The SVM was trained and tested on these four groups, and the final classifi-cation results reported are the average of the four training set classification results. The LIBSVM package is written for many programming languages; however, the C version of the package was used for this study.
R
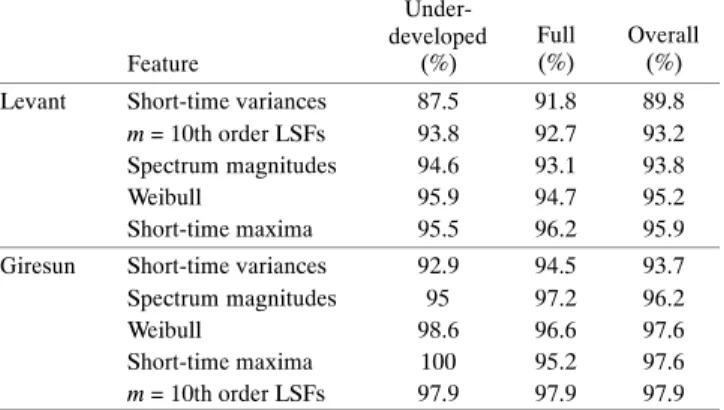
ESULTSClassification results using each type of feature are summarized separately in tables 1 and 2for both Levant and Giresun type hazelnuts. Results using a combination of different feature types are summarized in table 3. The features comprising the eight short-time variances had the lowest classification performance: 89.9% and 93.7% for Levant and Giresun type hazelnuts, respectively. While this feature characterizes the duration of the impact sound, like the Weibull parameters it does not characterize the overall shape of the signal in the time domain as well. The set of short-time maxima alone or the set of Weibull parameters (a, b, c, and R2) had accuracies nearly as high as any other single feature or combinations of features. This is due to their ability to model the shape of the signal in the time domain closely. However, computation of Weibull parameters is rather computationally intensive, while short-time maxima are not. Short-time maxima had the highest classification accuracy for Levant-type hazelnuts and the second highest for Giresun-type hazelnuts. Given the high classification accuracy of short-time maxima features and the simple computations required to generate these, the set of short-time maxima features are likely the best single feature type. The two frequency-based features, spectrum magnitudes and LSFs, also had similar classification accuracies and are easy to compute. The m = 10 LSFs had the highest classification accuracy for Giresun-type nuts by a slight margin over the set of short-time maxima. For Giresun-type nuts, the two
Table 1. Classification accuracies (%) obtained by different feature vectors for Levant and Giresun type hazelnuts. Results are listed
from lowest to highest classification accuracy for each nut type. Feature
Under-developed
(%) Full(%) Overall(%) Levant Short-time variances 87.5 91.8 89.8
m = 10th order LSFs 93.8 92.7 93.2 Spectrum magnitudes 94.6 93.1 93.8
Weibull 95.9 94.7 95.2
Short-time maxima 95.5 96.2 95.9 Giresun Short-time variances 92.9 94.5 93.7 Spectrum magnitudes 95 97.2 96.2
Weibull 98.6 96.6 97.6
Short-time maxima 100 95.2 97.6
m = 10th order LSFs 97.9 97.9 97.9 Table 2. Classification accuracies (%) obtained by various
orders of LSFs for Levant and Giresun type hazelnuts. Order Under-developed (%) Full(%) Overall(%) Levant m = 8 94 88.9 91.3 m = 9 95.7 88.7 92 m = 10 93.8 92.7 93.2 m = 11 94 89.1 91.4 m = 12 92.2 91.8 92 Giresun m = 8 95 93.1 94.1 m = 9 95.7 95.9 95.8 m = 10 97.9 97.9 97.9 m = 11 97.2 97.2 97.2 m = 12 97.2 96.6 96.9
Table 3. Classification accuracies (%) obtained by composite feature vectors containing various features for Levant and Giresun
type hazelnuts. Feature sets are listed from lowest to highest accuracy for each nut type. Feature Vector
Under-developed
(%) Full(%) Overall(%) Levant Weibull and LSFs 96.6 95.4 96.0
Maxima and LSFs 96.1 97.1 96.7 Weibull and maxima 96.1 97.7 97.0 Giresun Weibull and maxima 99.3 96.6 97.9 Weibull and LSFs 99.3 97.9 98.6 Maxima and LSFs 100 99.3 99.7
frequency spectra based features had higher accuracies for full nuts (table 1), probably due to their ability to detect the shape of the sharp peak in the frequency spectrum.
All possible combinations of feature parameters in a SVM machine were studied. Combining feature types improved accuracies slightly. The three feature parameters for each nut type are listed in table 3. Overall accuracies over 97% were achieved for both Levant-type and Giresun-type hazelnuts using various combinations of features, as shown in table 3. Similar results were obtained with SVMs using sigmoid and polynomial kernel functions. The feature vector comprising LSFs and time-domain maxima information produced a 96.7% classification accuracy for Levant-type hazelnuts and 99.7% for Giresun-type nuts. The slightly lower accuracy for Levant-type nuts might be due to these nuts being of smaller size and weight and therefore not producing sound with as much energy. Feature vectors comprising Weibull parame− ters and LSFs had high classification accuracies for both nut
1976 TRANSACTIONSOFTHE ASABE
types (table 3). However, computation of Weibull parameters is computationally intensive, as stated earlier. Algorithms that are more computationally efficient exist for the other fea-ture parameters, which can all be computed in real-time to realize a system capable of processing more than 40 nuts per second. Therefore, a feature vector combining LSFs and time-domain maxima appears to be the best for classifying underdeveloped and full hazelnuts in real-time applications. This vector carries information related to both time and fre-quency of impact sounds.
C
ONCLUSIONSThis article describes an effective and low-cost impact sound-based classification system to distinguish between full and underdeveloped hazelnuts. Impact sounds of hazelnuts were analyzed, and feature parameters describing time and frequency domain characteristics of the acoustic signals were extracted and combined into feature vectors. The feature vector comprising LSFs and time-domain maxima, having both time and frequency information of the impact sound, enabled underdeveloped and full hazelnuts to be classified with over 96% accuracy by using an SVM-based classifier for Levant-type hazelnuts. The prototype classification system used computationally efficient features and methods that are efficient to compute and that require only modest computing hardware. The proposed system has the potential to process more than 40 nuts per second in real-time.
ACKNOWLEDGEMENT
We thank F. Ince and A. H. Tewfik for their help and constructive comments.
R
EFERENCESBlanz, V., B. Schölkopf, H. Bülthoff, C. Burges, V. Vapnik, and T. Vetter, 1996. Comparison of view-based object recognition algorithms using realistic 3D models. In Artificial Neural
Networks − ICANN’96, 1112: 251-256. C. von der Malsburg, W.
von Seelen, J. C. Vorbrüggen, and B. Sendhoff, eds. Berlin, Germany: Springer Lecture Notes in Computer Science. Burges, C. J. 1998. A tutorial on support vector machines for
pattern recognition. Data Mining and Knowledge Discovery 2(2): 121-167.
Cetin, A. E., T. C. Pearson, and A. H. Tewfik. 2004a. Classification of closed- and open-shell pistachio nuts using voice-recognition technology. Trans. ASAE 47(2): 659-664.
Cetin, A. E., T. C. Pearson, and A. H. Tewfik. 2004b. Classification of closed- and open-shell pistachio nuts using impact acoustical analysis, In Proc. 2004 International Conference on Acoustics,
Speech, and Signal Processing (ICASSP 2004). Piscataway,
N.J.: IEEE.
Chang, C. C., and C. J. Lin. 2001. LIBSVM: A library for support vector machines. Taipei, Taiwan: National Taiwan University, Department of Computer Science and Information Engineering. Available at: www.csie.ntu.edu.tw/~cjlin/libsvm. Accessed 15 May 2006.
Cortes, C., and V. Vapnik. 1995. Support vector networks. Machine
Learning 20(3): 273-297.
Itakura. F. 1975. Line spectrum representation of linear predictive coefficients of speech signals. J. Acoust. Soc. America 57(S1): S35.
Hearst, M. A. 1998. Support vector machines. IEEE Intelligent
Systems 13(4): 18-28.
Huberty, C. J. 1994. Applied Discriminant Analysis. New York, N.Y.: John Wiley and Sons.
Marklinder, I., M. Lindblad, A. Gidlund, and M. Olsen. 2005. Consumers’ ability to discriminate aflatoxin-contaminated Brazil nuts. Food Additives and Contaminants 22(1): 56-64.
Mitra, S. K. 2002. Digital Signal Processing. 2nd ed. McGraw-Hill Education.
Osuna, E., R. Freund, and F. Girosi. 1997. An improved training algorithm for support vector machines. In Proc. 1997 IEEE
Workshop on Neural Networks for Signal Processing. J.
Principe, L. Giles, N. Morgan, and E. Wilson, eds. Piscataway, N.J.: IEEE.
Pearson, T. C. 2001. Detection of pistachio nuts with closed shells using impact acoustics. Applied Eng. in Agric. 17(2): 249-253. Quatieri, T. 2001. Discrete-Time Speech Signal Processing:
Principles and Practice. Upper Saddle River, N.J.:
Prentice-Hall.
Schölkopf, B., C. Burges, and V. Vapnik. 1995. Extracting support data for a given task. In Proc. 1st International Conference on
Knowledge Discovery and Data Mining. U. M. Fayyad and R.
Uthurusamy, eds. Menlo Park, Cal.: AAAI Press. Schölkopf, B., C. Burges, and V. Vapnik. 1996. Incorporating
invariances in support vector learning machines. In Proc.
Artificial Neural Networks − ICANN’96, 1112. C. von der
Malsburg, W. von Seelen, J. C. Vorbrüggen, and B. Sendhoff, eds. Berlin, Germany, Springer Lecture Notes in Computer Science.
Schölkopf, B., K. Sung, C. Burges, F. Girosi, P. Niyogi, T. Poggio, and V. Vapnik. 1997. Comparing support vector machines with Gaussian kernels to radial basis function classifiers. IEEE Trans.
Signal Processing 45(11): 2758-2765.
Schölkopf, B., C. Burges, and A. J. Smola. 1999. Introduction to support vector learning. In Advances in Kernel Methods:
Support Vector Learning, 1-16. Boston, Mass.: MIT Press.
View publication stats View publication stats