ANALYSIS OF DIFFERENTIALLY
EXPRESSED GENES IN BIPOLAR
DISORDER: TRANSCRIPTOMIC
SIGNATURE OF ADOLESCENCE AND
YOUNG ADULTHOOD IN WORKING
MEMORY-RELARED AREA
a thesis submitted to
the graduate school of engineering and science
of bilkent university
in partial fulfillment of the requirements for
the degree of
master of science
in
neuroscience
By
Rabia S
¸en
November 2020
Analysis of Differentially Expressed Genes in Bipolar Disorder: Tran-scriptomic Signature of Adolescence and Young Adulthood in Working Memory-Relared Area
By Rabia S¸en November 2020
We certify that we have read this thesis and that in our opinion it is fully adequate, in scope and in quality, as a thesis for the degree of Master of Science.
Timothea Toulopoulou(Advisor)
Ali Osmay G¨ure
Kerem Mert S¸enses
ABSTRACT
ANALYSIS OF DIFFERENTIALLY EXPRESSED
GENES IN BIPOLAR DISORDER: TRANSCRIPTOMIC
SIGNATURE OF ADOLESCENCE AND YOUNG
ADULTHOOD IN WORKING MEMORY-RELARED
AREA
Rabia S¸en M.Sc. in Neuroscience Advisor: Timothea Toulopoulou
November 2020
Bipolar disorder (BD) is a heritable severe illness. One of the indications of BD is working memory (WM) impairment which is a heritable cognitive trait. The aim of the current study is to identify the transcriptomic level developmental biomarkers of BD in WM-related brain regions. We based our analysis on adoles-cence and young adulthood (AYA), the critical period for both BD and cognitive development. We have chosen 4 publicly available microarray datasets from Gene Omnibus database for which one is derived from healthy controls and three from bipolar disorder patients. We compared different developmental periods of the brains of normal subjects to determine healthy brain development at the tran-scriptomic level. After applying the same method to detect bipolar development to show differences between BD and healthy brains. We followed these compar-isons in two steps; on gene-level analysis and geneset level analysis. Next, we identified common genes and pathways from the results of different analyses. As a result of this comparison, while six genes were identified differentially expressed, we observed 5 Gene Ontology (GO) genesets shown different regulation patterns in bipolar and healthy brains. The literature review has been shown that the significant biological pathways might be influenced by the treatment.
Keywords: Bipolar disorder, brain development, workıng memory, microarray data analysis.
¨
OZET
B˙IPOLAR BOZUKLUKTA FARKLI EKSPRESE
GENLER˙IN ANAL˙IZ˙I: C
¸ ALIS
¸MA BELLE ˘
G˙I ˙ILE ˙ILG˙IL˙I
B ¨
OLGELERDE ERGENL˙IK VE GENC
¸ ER˙IS
¸K˙INL˙I ˘
G˙IN
TRANSK˙IPTOM ˙IMZASI
Rabia S¸en
N¨orobilimler, Y¨uksek Lisans Tez Danı¸smanı: Timothea Toulopoulou
Kasım 2020
Bipolar bozukluk (BB) kalıtsal, ciddi bir hastalıktır. BB’nin belirtilerinden biri, bili¸ssel ve kalıtımsal bir i¸slev olan ¸calı¸sma belle˘gi (C¸ B) bozuklu˘gudur. Bu ¸calı¸smanın amacı transkriptomik d¨uzeyde BB’nin ve C¸ B ili¸skili beyin b¨olgelerindeki geli¸simsel biyobelirte¸cleri belirlemektir. Analizimizi hem bili¸ssel geli¸sim hem de BB i¸cin kritik bir d¨onem olan ergenlik ve gen¸c yeti¸skinlik d¨onemine g¨ore kurduk. Gene Omnibus veritabanından, bir sa˘glıklı, ¨u¸c bipolar olmak ¨uzere d¨ort halka a¸cık microdizi verisetini se¸ctik. BB ve sa˘glıklı beyin geli¸simi arasındaki farklılıkları g¨ostermek i¸cin, ¨oncelikle sa˘glıklı ¨ornekleri kar¸sıla¸stırdık, daha sonra aynı adımları bipolar ¨ornekleri i¸cin ayrıca uyguladık. Bu kar¸sıla¸stırmaları gen d¨uzeyinde analiz ve geneset d¨uzeyinde analiz olarak iki adımda izledik. Bir son-raki a¸samada, farklı analizlerden gelen ortak gen ve genesetleri belirledik. Bu kar¸sıla¸stırma sonucunda, altı gen anlamlı olarak tanımlanırken, be¸s Gene On-tology (GO) geneseti bipolar ve sa˘glıklı beyinlerde farklı ¸sekillerde d¨uzenleme g¨osterdi˘gini g¨ozlemledik. Literat¨ur ara¸stırması anlamlı biyolojik gensetlerin te-davi yoluyla etkilendi˘gini g¨osterdi.
Acknowledgement
First of all, I would like to express my gratitude to Timothea Toulopoulou for supervision and giving a chance to be a member of her Brain Development and Psychosis lab and guided me to conduct this research. I am deeply indebted to Ali Osmay G¨ure for sharing his instructive comments, informative feedback that significantly accelerated quality of this study. I am genuinely thankful to Kerem Mert S¸enses for endless support, his understanding, and wholehearted help without hesitation in the path of this thesis. I am grateful all of my jury individually to their trust in me, which was very valuable and motivating.
Michelle Marie Adams always be kind and was more than a instructor for me. It was really valuable to feel her encouragement, I believe I could not continue my masters without her support.
My sincere thanks to my deariest friend and colleague, K¨ubra C¸ elikba¸s who give me the positivity and relief every step of this study. She has always been amazing friend/labmate.
With all my soul, I am more than thankful to Beyza Akkoyunlu. I always feel her love and support in every stage of last three years. I can not think my time at Bilkent without Dilara Eri¸sen. I am grateful for her friendship. Both Dilara and Beyza always there to help and support in every difficulty I encountered.
I also would like to appreciate for amazing friendship offered by Olga Kravchenko and Lukas Knopp. Although, they came into my life unexpect-edly and late, brought great joy to my life.
Lastly, I declere my greatest and profound thanks to my family, Safiye, Ay¸se, Tuba, Bilal S¸en, and Hilal, ˙Ibrahim Kaya; for their endless mental support and love. Additionally, my fluffy family; Safari, Tahsin, Mestan, Siren, I am more than thankful for their unending love and connection.
Contents
1 Introduction 1
1.1 Bipolar Disorder . . . 1
1.1.1 Heritability of Bipolar Disorder . . . 2
1.2 Working memory . . . 3
1.2.1 Working Memory and Bipolar Disorder . . . 4
1.3 Scope of the study . . . 5
2 Materials and Method 6 2.1 Description of the data . . . 6
2.1.1 Healthy Brain Dataset . . . 7
2.1.2 Bipolar Brain Datasets . . . 8
2.2 Microarray Data Analysis . . . 10
CONTENTS vii
2.2.2 Sliding Window Approach and Differential Gene Expres-sion analysis . . . 11
2.2.3 Gene Set Enrichment Analysis . . . 12
3 Results 14
3.1 Normalization of Raw Data . . . 14
3.2 Differentially Expressed Gene Analysis . . . 16
3.2.1 Healthy Brain Dataset-GSE25219 . . . 16
3.2.2 Bipolar Brain Datasets-GSE5388/GSE5389/GSE92538 . . 17
3.2.3 Comparison of results of bipolar brain development and healthy brain development . . . 19
3.2.4 Gene-level changes in bipolar disorder . . . 19
3.3 Gene Set Enrichment Analysis . . . 22
List of Figures
2.1 Detailed diagram of sliding window approach that was used for group comparison . . . 13
3.1 Datasets’ plots change in log2 levels with normalization. . . 15
3.2 Barplot of DEG Analysis results in healthy brain dataset (GSE25219) 17
3.3 Volcano plots of DEG Analysis-healhty brain dataset (GSE25219) 18
3.4 Volcano plots of DEG Analysis-bipolar brain datasets (GSE5388/ GSE5389/GSE92538) . . . 18
3.5 Common significant genes between healthy brain and bipolar datasets’ comparison . . . 19
3.6 Common significant genes between healthy (GSE25219) and bipo-lar datasets’ (GSE5388, GSE5389) comparison . . . 21
3.7 Common significant genes between healthy (GSE25219) and bipo-lar dataset’s (GSE92538) comparison . . . 22
4.1 Possible correlation between bipolar disorder, inflammatory co-morbidity and immunity . . . 30
List of Tables
2.1 Detailed information about datasets included in the study . . . . 7
2.2 Healthy brain dataset (GSE25219), filtered data information . . . 9
3.1 Corrected t-test results for separate ages and developmental stage comparison in healthy brain dataset (GSE25219) . . . 16
3.2 t-test results in bipolar datasets and information of commonly ex-pressed gen . . . 20
3.3 GSEA results of GSE25219 dataset . . . 23
Chapter 1
Introduction
1.1
Bipolar Disorder
Bipolar disorder (BD) is a widespread mental illness which causes severe im-plications for patients’ daily life and in some cases can lead to death. Perlis et al. highlighted people with BD have 20-fold higher suicidal risk than healthy indi-viduals [1, 2]. Diagnosis of BD, like any other mental illness, is contingent upon behavioral manifestations. Although the symptoms are diverse, they can be sep-arated in line with mood phases: manic and depressive [1]. While manic episode mostly shows itself as increased energy, rapid speech, aggressiveness; depressive mode is characterized by tiredness, lack of concentration, low self-worth, distur-bance of sleep [3]. Additionally, some individuals diagnosed with BD reported psychotic symptoms such as hallucinations and delusions [4].
Emergence of BD is another well-studied subject of psychiatry research. While both genetic and environmental factors are shown to contribute to the develop-ment of BD, effect size of the factors is unclear [5]. Another problem about BD is the onset of the disease. Although there is conflicting results about the sub-ject, Balessarini and his colleagues have reported the average of onset as 24.0 by
Complex pathophysiology of BD affects treatment options. Although some treatment options are developed through molecular biology research, cure for BD is only symptomatic. The symptoms are often heterogeneous and can overlap with other psychiatric disorders. This results in high misdiagnosis rates and also cause health and economical problems to people who suffer from BD [7]. It is therefore beyond doubt that filling in the incomplete picture of BD pathophysiology would help many people.
1.1.1
Heritability of Bipolar Disorder
Curiosity about genetics of psychiatric disorders was launched at the beginning of the 20th century [8]. Genetic aspect of etiology on BD research started with twin and adoption studies. These studies have certified contribution of genetic factors to the development of BD [9]. While classical genetics studies demon-strated heritability of the disease, the research headed toward the identification of genetic factors with the development of molecular tools.
Molecular genetic research was initiated with risk loci research on the chro-mosomal locations of susceptibility genes that have effect on development of BD [10]. By using linkage research results, scientists began to investigate disease pathology on closer inspection by acquisition of candidate genes. Candidate-gene studies rely on the determination of susceptible gene that is related with the phenotype of disease. Some of the genes that were identified through the linkage mapping approach were: the serotonin transporter (SLC6A4) [11], catechol-O-methyltransferase (COMT) [12], toll-like receptor 2 (TLR2) [13], d-amino acid oxidase (DAOA) [14], brain-derived neurotrophic factor (BDNF) [15].
Although candidate gene studies have identified some of the genetic markers for BD, the studies had limitations such as sample size, poor experimental design, and false diagnosis [16]. When GWAS was implemented in BD research, many other risk associated genes were discovered. Fundamentally GWAS looks for the single nucleotide polymorphisms in entire genome to determine whether there are genetic markers for the condition of interest. GWAS also have identified
common polymorphisms with other psychiatric disorders such as schizophrenia and major depressive disorder [17, 18]. Stahl et al. published a review about the GWAS study of bipolar disorder in 2019. They used results of 50.000 case investigation, 30 related loci identified in 18 years [19]. Some of them are ankyrin 3 (ANK3), [20], calcium voltage-gated channel subunit alpha1 (CACNA1C) [19], tetratricopeptide repeat and ankyrin repeat containing 1 (TRANK1) [21], and doublecortin like kinase 3 (DCLK3) [22].
While gene expression studies provide insight into the pathology of BD, path-way analysis is important for development of treatment methods. This method is applied for identifying related proteins to understand changes in biological function level. Latest studies show that ion transport, neurotransmitter recep-tors, insulin secretion, and endocannabinoid signalling are critical pathways for BD [19, 23]. Also, once again, heterogeneity and overlapping with other mental illnesses have been shown in molecular aspect [19, 24].
1.2
Working memory
Working memory (WM) is a heritable cognitive trait that has been investigated since 1960s [25]. WM plays role in holding previously experienced information and preserve it even though input is no longer available. In addition to that it allows processing of the information in a brief interval. Although it has short term capacity, neuroimaging studies show that WM activated areas work in col-laboration with long term memory related cognitive ability associated regions, such as attention and decision making [25, 26].
After WM theory is fully formed, research focused on unveiling working-memory relevant areas of brain. Imaging and single neuron activity recording studies show that WM tasks cause an activation in the frontal regions [25]; the regions including dorsolateral prefrontal cortex (DLPFC), ventrolateral prefrontal cortex (VLPFC), rostral prefrontal cortex (rPFC) [27, 28].
Similar to other cognitive abilities WM also has multi-component structure and from psychology to neuroscience, researchers from different fields started to be interested in WM and study its development. The curiosity about WM devel-opment during lifespan has given rise to outstanding findings. For instance, Rieck et al., 2017 demonstrated that cognitive abilities are declined by age including working memory performance [29]. When WM performances were investigated over human lifespan several scientists indicated the most noticeable increase in WM capacity is from the beginning of adolescence to until the end of the young adulthood period [26, 30, 31]. In addition to that, PFC activity have been shown to increase during adolescence period [32, 31, 33]. Therefore, it has been claimed adolescence and young adulthood (AYA) is critical period for cognitive process development.
1.2.1
Working Memory and Bipolar Disorder
Previous research has demonstrated that working memory performance is de-creased with mental illness including bipolar disorder [34, 35, 36]. Dr. MacQueen indicated that BD cycling and cognitive ability is associated with each other. Moreover, it is reported that many studies have been agreed on euthymic phase is noted as a disease state that has emerged cognitive impairment[37]. As it is known euthymia is defined as mental state without cycling, neither depressive nor manic. Thus, it is suggested WM deficits can be use as the predictor of BD before development of the disease [38, 39]. Furthermore, from previous research we know more about WM heritability and some candidate genes overlap with the genes that increase susceptibility of BD; such as catechol- O-methyltransferase (COMT)[40], dopamine transporter (DAT1), [41], and disrupted in schizophrenia 1 (DISC1) [42].
1.3
Scope of the study
It is a fact that adolescence is a critical period for both cognitive improvement and psychiatric disorder development [43, 44]. Analyses of Soraggi et al. which were conducted on long term data of BD patients suggests that WM is negatively influenced in BD. In the same study, intra-group age range comparisons in BD and control groups revealed that adolescents and young adults were individuals with the highest WM performance [45]. On another study, McCormak et al. did not find WM deficit in people with BD between 18-25 age range while there is a significant decrease in WM performance of participants in 26-35 age group [46, 47]. Although, many studies claimed that WM deficit is an important factor for the disease, to our knowledge there is no study investigated WM impairment for the disease onset. Thus we believe that focusing on the AYA period and working memory related areas could help to comprehend the pathology of bipolar disorder. In this study, we aimed to identify transcriptomic biomarkers of BD that also changes during development in working memory related brain regions. We used microarray datasets of normal brain samples and datasets that consisted of bipolar patient samples. We used Affymetrix microarrays for both of the part of analysis and evaluated separately development healthy people’s and patients’ brain. By revealing differences in disease status in transcriptomic level, we believe this study presents another perspective on genetic basis of susceptibility to BD.
Chapter 2
Materials and Method
2.1
Description of the data
Expression profiling of numerous genes at once became available after development of microarray technique [48, 49]. A microarray consists of small spots with already sequenced oligonucleotides that attached to each spot. These oligonucleotide sequences are called probes and are specific to the selected gene. When samples are loaded to the microchip, the hybridization between the probe and the sample provides the expression value of target oligonucleotide by scan-ning the array. It has been started to be commonly used for characterisation of the cell transcriptome in many fields of molecular biology studies, including neuroscience.
Gene Expression Omnibus (GEO) database is a gene expression data re-source that consists of different types of datasets; including microarrays [50]. Thanks to GEO, scientists able to access and make comprehensive inferences by analyzing various datasets collected by different researchers in diverse labo-ratories. In this study, we also took advantage of this opportunity and sought for bipolar post mortem brain microarray datasets and healthy brain microarray datasets. While we found a wide dataset for healthy brain development, there
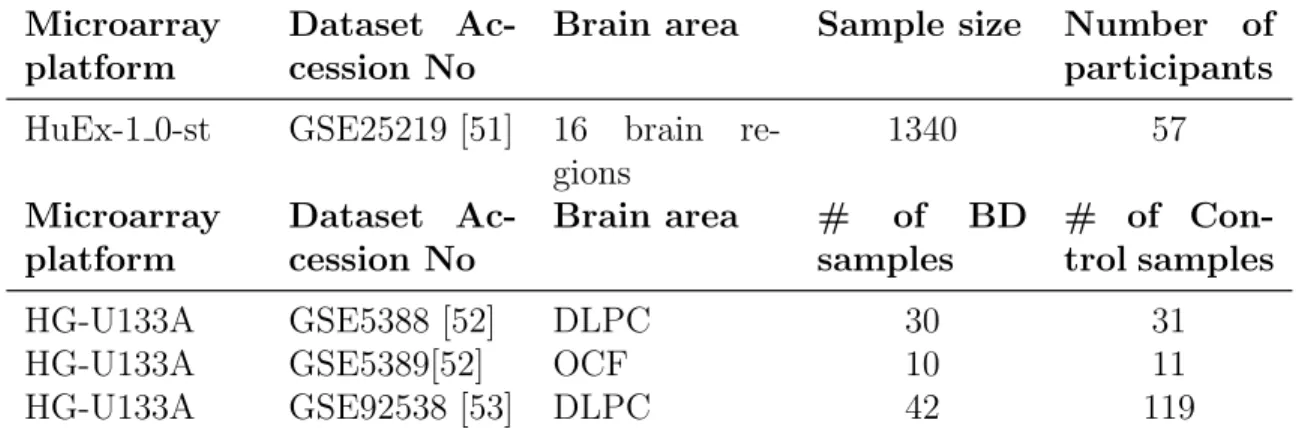
are fewer options for bipolar disorder. We have found 7 datasets that includes Homo Sapiens post mortem tissue. According to our research question; inclusion criteria was; comprising availability of age information, had been collected from prefrontal cortex area, and to track changes development of bipolar brain, involv-ing the samples from young adulthood and adolescence period. Shown in the table 2.1 three bipolar, one healthy brain publicly available microarray datasets are se-lected for analysis. After determining the datasets to be included in the study, we downloaded the raw data from GEO web page, pre-processed(summarizing, normalizing, background correction) and analyzed in R(version 4.0.1).
Table 2.1: Detailed information about datasets included in the study Microarray
platform
Dataset Ac-cession No
Brain area Sample size Number of participants HuEx-1 0-st GSE25219 [51] 16 brain
re-gions 1340 57 Microarray platform Dataset Ac-cession No Brain area # of BD samples # of Con-trol samples HG-U133A GSE5388 [52] DLPC 30 31
HG-U133A GSE5389[52] OCF 10 11
HG-U133A GSE92538 [53] DLPC 42 119
2.1.1
Healthy Brain Dataset
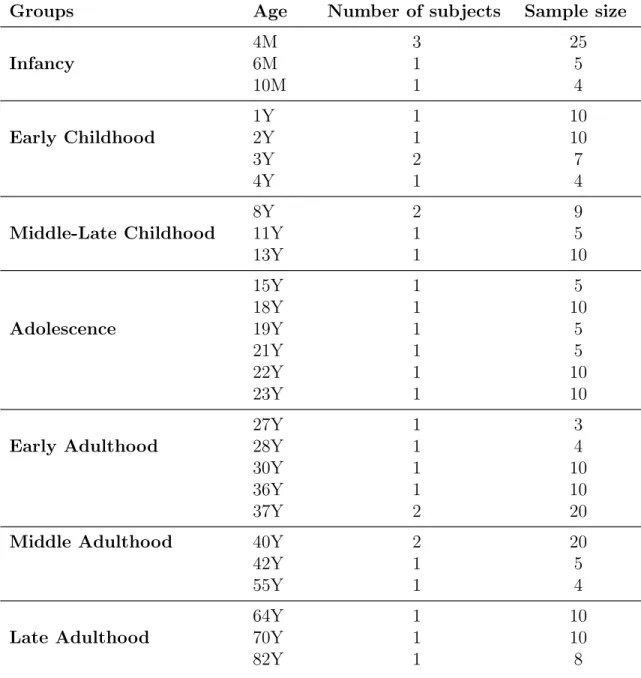
GSE25219 Kang et. al investigated human brain development by exam-ining both gene and exon-level changes in post-mortem brains [51]. The dataset includes 16 brain regions that were collected from 57 healthy individuals between the age of 4 weeks post-conception (PCW) and 82 years old. Since our research question is focused on transcriptomic level change in working memory related areas, we focused our analysis on 5 brain regions: Orbitofrontal cortex (OFC), motor cortex (M1C), medial prefrontal cortex (MFC), dorsolateral prefrontal cor-tex (DLPFC), and ventrolateral frontal corcor-tex (VFC). We included the samples in particular age range; from 4 months old to 82 years old. The remained 238
samples were separated to seven groups based on age; Infancy(INF), Early Child-hood (EC), Middle and Late ChildChild-hood (MLC), Adolescence and Young Adult-hood (AYA) Early AdultAdult-hood(EA), Middle AdultAdult-hood (MA), Late AdultAdult-hood (LA). Detailed information has been shown in table 2.2.
2.1.2
Bipolar Brain Datasets
GSE5388-GSE5389
Bahn and her colleagues conducted a research about gene expression pro-filing of bipolar disorder in 2006. In contrast to majority of studies that in-vestigated schizophrenia and bipolar disorder together, they focused on bipolar disorder alone. They included prefrontal cortex area of post mortem brains of 50 healthy individuals and 50 BD patients from the Stanley Neuropathology Con-sortium (Stanley Medical Research Institute, US) to the study. They published two distinct datasets by using these samples; GSE5388 (DLPFC) and GSE5359 (OFC). While GSE5288 comprised of 30 BD and 31 control samples; GSE5389 consisted of 10 BD and 11 control samples. Results has shown that While there was not significant changes for dorsolateral prefrontal cortex, they reported OFC is involved in BD process. In addition to that, dysregulation of the ubiquitin pathway and synaptic function are two critical pathways they reported as signif-icantly expressed in BD [52].
GSE92538
In this dataset, to create transcriptomic profile of psychiatric illnesses, re-searchers focused on the single cell instead of looking into dissected brain regions. Starting from this point of view, they utilized 7 different datasets from 10 pri-mary brain cell types. After single cell level analysis they also analyzed several microarray datasets constituted by Pritzker Neuropsychiatric Consortium, and the Allen Brain Atlas. In addition to bipolar disorder. Consequentially, this detailed and comprehensive research could not reach a significant inference for
Table 2.2: Healthy brain dataset (GSE25219), filtered data information Groups Age Number of subjects Sample size
4M 3 25 Infancy 6M 1 5 10M 1 4 1Y 1 10 Early Childhood 2Y 1 10 3Y 2 7 4Y 1 4 8Y 2 9
Middle-Late Childhood 11Y 1 5
13Y 1 10 15Y 1 5 18Y 1 10 Adolescence 19Y 1 5 21Y 1 5 22Y 1 10 23Y 1 10 27Y 1 3
Early Adulthood 28Y 1 4
30Y 1 10
36Y 1 10
37Y 2 20
Middle Adulthood 40Y 2 20
42Y 1 5
55Y 1 4
64Y 1 10
Late Adulthood 70Y 1 10
bipolar disorder[53]. According to our research interest, while we excluded sam-ples from other diseases, we included 42 bipolar samsam-ples and 119 control samsam-ples from this dataset.
2.2
Microarray Data Analysis
2.2.1
Normalization of Raw Data
Dr. Irızarry, published a paper about gene expression microarray data analysis in 2003. In this study, they suggested a newly developed method for probe-set analysis; robust multiarray average (RMA). Moreover, they claimed RMA the best way of normalization method. Their conclusion was made by result of comparison of expression values of three different datasets which were normalized with different methods. These datasets are pre-arranged and manipu-lated to give expected results (non specific binding, already known concentrations, samples hybridized at different dilutions). As compared the other methods, RMA provides more sensitive and specific detection especially for low expression values [54].
Here, we conducted the normalization step in two rounds. First, healthy brain dataset (GSE25219) normalization was performed. After that, since the number of bipolar samples were limited, bipolar datasets (GSE5388, GS5389, GSE925) that constituted in the same platform (GPL96) were merged and nor-malized together 2.2.2. As indicated before, 238 samples met inclusion criteria after filtration step. Due to the data size, normalization of GSE25219 was not able to be performed on personal computer. Having been tried on several comput-ers Rstudio encountered the same error of memory insufficiency. Google provides a service to create a high feature computer in its cloud system charged monthly based on the computer engine’s features. However, we were able to use the one month free trial and benefit from the higher memory and high CPU performance
for big data analysis. Thus, we applied the normalization on Google cloud com-pute engine without error.
”OLIGO” which is one of the Bioconductor packages, has been used for Affymetrix data preprocessing [55]. With personally written Rscript first, CEL files were read as the raw intensity files and RMA method has been used for normalization. This algorithm is included background-adjustment/subtraction, quantile normalization and log-transformed perfect match values. To double check the normalization results we took before and after normalization visual-isation with box plot and histogram as shown in figure 2.2.2. Since all of the datasets that included in this study are Affymetrix GeneChip array, same nor-malization steps were applied for both healthy and bipolar datasets.
2.2.2
Sliding Window Approach and Differential Gene
Expression analysis
In the first round of analysis, expression profile of healthy brain was in-vestigated by comparison of AYA period versus remaining developmental stages (as indicated in the ”2.1.1.1 Healthy Brain Dataset-GSE25219”). To sum up, in order to make our analysis more sensitive, the data of adolescence and young adulthood (AYA) group samples, were separated by age to compare individually with other groups (15 years old, 18 years old, 19 years old, 21 years old, 22 years old, 23 years old). Differentially expressed genes were evaluated with student’s t-tests with equal variance (R version 4.0.1). Based on sliding window approach, we compared the mean values of separate ages of AYA group with infancy, early childhood, middle and late childhood, early adulthood, and middle adulthood respectively. After collecting all t-test results of one developmental stage, and merging them together (INF vs 15Y, INF vs 18Y, INF vs 19Y, INF vs 21Y, INF vs 22Y, INF vs 23Y) afterwards, we searched for the shared genes by all com-parisons. Further, same steps were applied for EC, MLC, EA, MA, LA groups as well, like it is shown in figure 2.2.2. After collecting all of statistical analysis
selected probesets according to significant level, Benjamini-Hochberg correction was applied [56] (via FSA package) and candidate probesets were identified and annotated for each group. As it was expected infancy and adulthood period had more differentially expressed genes while middle and late childhood and early adulthood had least by comparison of adolescence period. Plots were drawn with ggplot2 from tidyverse package.
In the second round of analyses, similar to first step, bipolar data is sep-arated by age into developmental stages. Since bipolar disorder is usually diag-nosed after the 20s, the age of samples included in the datasets starts from 19. By combining bipolar samples of three datasets (GSE5388, GSE5389, GSE92538) together we had 4 samples for adolescence group, 20 samples for early adulthood, 39 samples for middle adulthood, and 20 samples for late adulthood. After sep-arating age groups, we investigated the differentially expressed genes to find out bipolar brain development changes in transcriptomic level.
2.2.3
Gene Set Enrichment Analysis
Since we want to investigate differentially expressed genes’ biologically significant inferences, we used the gene lists from previous analysis for gene set enrichment analysis(GSEA). GSEA is applied in R by downloaded package of clusterProfiler, version ”3.8”. Gene Ontology (GO) annotation source were used to classify genesets and understanding significant genesets’ function besides their products. For visualization, dotplots were created with GeneRatio, enrichplot package provided the enrichment map that shows the network of enriched genesets and pathview for their functions image.
Figure 2.1: Detailed diagram of sliding window approach that was used for DEG analysis. Marked figure shows the Infancy and AYA group comparison. As can be seen, the infancy expression values are compared with separate ages microarray measurements of Adolescence and Young Adulthood period (15 years old, 18 years old, 19 years old, 21 years old, 22 years old and 23 years old) respectively. Then, it is investigated whether there are common significant genes between those comparisons. This filtering is given ”INF vs AYA” period in other words, genes that differentially expressed genes between the group of interest and AYA period. Remained sub figures represents other developmental stages which undergo same steps. INF: Infancy, EC: Early Childhood, MLC: Middle and Late Childhood, EA: Early Adulthood, MA, Middle Adulthood, Late Adulthood
Chapter 3
Results
3.1
Normalization of Raw Data
After downloading the raw data from the Gene Omnibus Database, RMA method was applied as normalization method. For GSE25219 dataset the data was filtered by brain regions and age information. For bipolar datasets, 3 different datasets with accession numbers; GSE5388, GSE5389, GSE92538 were collected together and were normalized together [Fig. 3.1] to determine bipolar brain devel-opmental changes. In addition to that, they are normalized separately for patient and control group comparisons. Results of normalization are shown in the figure 3.1. The upper image represents data prior to normalization, the middle image represents the data adjusted for the batch effect and the image below represents data after normalization.
(a) GSE25219-Before normalization (b) GSE25219-After normalization
(c) Bipolar datasets-Before normalization (d) Bipolar datasets-After normalization
(e) Bipolar datasets-Before normalization
(f) Bipolar datasets-After normalization
Figure 3.1: Datasets’ plots change in log2 levels with normalization. (a) and (b) show density plots of healthy brain dataset (GSE25219) and (c), (d), (e), (f) demonstrate the combined bipolar datasets (GSE5388, GSE5389, GSE92538). As it is expected, range of the data is diminished and feature of the data became more smooth in terms of density level. However, the range change is not as smooth as the transition in GSE25219. Because the data combined of three different datasets, and that may be influence the distribution scale.
3.2
Differentially Expressed Gene Analysis
To identify differentially expressed genes, student’s t-test was applied to the normalized data. Adjusted p-value was calculated with Benjamini Hochberg (BH) method. Significant probesets were describes with —log 2 FC (fold-change)> 0 and an adjusted P value < 0.01. Annotation of significant transcripts was identified with custom written function.
3.2.1
Healthy Brain Dataset-GSE25219
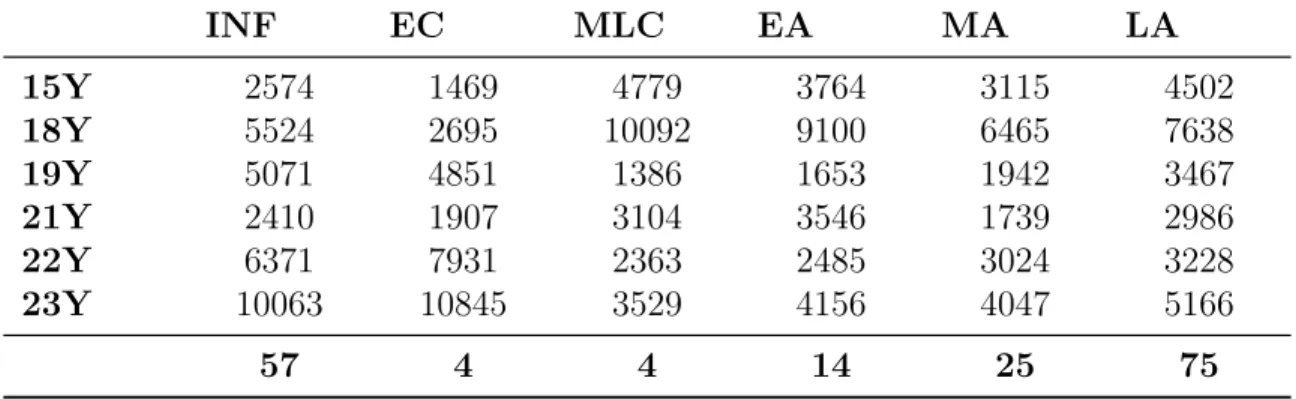
As stated in the method section, we had divided the GSE25219 dataset into 7 separate groups; Infancy(INF), Early Childhood (EC), Middle and Late Childhood (MLC), Adolescence and Young Adulthood (AYA) Early Adulthood (EA), Middle Adulthood (MA), Late Adulthood (LA). Instead of evaluating the AYA period as a group we also separated it into the ages; 15 years old, 18 years old, 19 years old, 21 years old, 22 years old and 23 years old. After separating age groups, we applied t-test to each group. Next step was revealing shared probesets for each development group in different age comparisons. As a result of this, 57 genes for INF, 4 genes for EC, 4 genes for MLC, 14 genes for EA, 25 genes for MA, 75 genes for LA are identified with AYA comparison as shown in Table 3.1. In the appendix A you can see the detailed list of these genes.
Table 3.1: Corrected t-test results for separate ages and developmental stage comparison in healthy brain dataset (GSE25219)
INF EC MLC EA MA LA 15Y 2574 1469 4779 3764 3115 4502 18Y 5524 2695 10092 9100 6465 7638 19Y 5071 4851 1386 1653 1942 3467 21Y 2410 1907 3104 3546 1739 2986 22Y 6371 7931 2363 2485 3024 3228 23Y 10063 10845 3529 4156 4047 5166 57 4 4 14 25 75
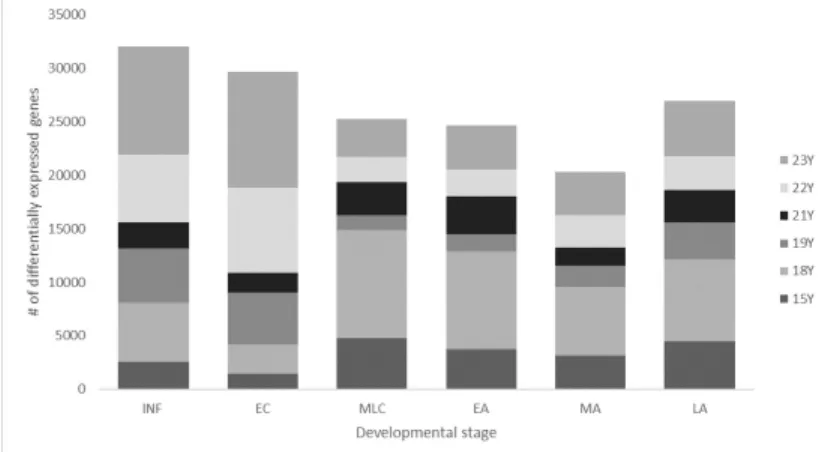
Figure 3.2: Barplot of DEG Analysis results in healthy brain dataset (GSE25219). While x-axis demonstrates the different groups of ages, y-axis shows the number of differentially expressed genes. Different colors of boxes show result of sepa-rate age comparison. INF:Infancy, EC:Early Childhood, MLC: Middle and Late Childhood, EA:Early Adulthood, MA: Middle Adulthood, LA:Late Adulthood
Since AYA period is in the middle of developmental stages (INF, EC, MLC, AYA, EA, MA, LA) results of gene expression changes are proven this pattern: as age of the group closes to AYA period, the number of differentially expressed genes are reduced as shown in the Figure 3.2. The full list of common significant genes and their t-test p values are given in APPENDIX A.
3.2.2
Bipolar Brain Datasets-GSE5388/GSE5389/GSE92538
Since 3 post-mortem microarray datasets are related with our research question and they conducted by using same platform (Affymetrix Human Genome U133A Array), we combined and normalized them together. We divided the sam-ples according to the age information provided. Since bipolar disease diagnosis is made based on showing symptoms in early 20s, datasets only included samples starting from 19 years old. So, after combining samples, we had 4 AYA,20 EA, 39 MA, 20 LA samples. EA vs AYA gives 91 probesets and 87 genes, MA vs AYA gives 213 probesets and 206 genes, LA vs AYA gives 199 probeset and 194 genes. Same steps of applying t-test, were repeated for bipolar datasets as well.
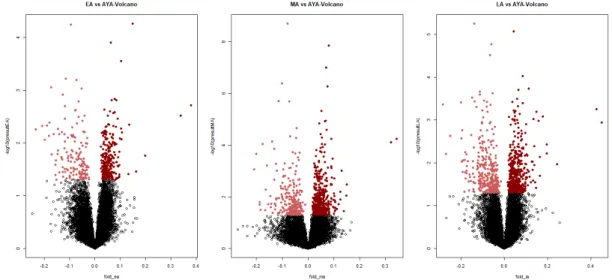
Figure 3.3: Volcano plots of DEG Analysis-healhty brain dataset (GSE25219). It shows differentially expressed genes by plotting log2 (fold change) against the –log10 of the pvalue of the statistical test used. The circle dots indicates differ-entially expressed genes, light red show downregulated genes and dark red dots show upregulated genes
Figure 3.4: Volcano plots of DEG Analysis-bipolar brain datasets (GSE5388/ GSE5389/GSE92538). It shows differentially expressed genes by plotting log2 (fold change) against the –log10 of the p-value of the statistical test used. The circle dots indicates differentially expressed genes, light red show downregulated genes and dark red dots show upregulated genes
(a) Healthy brain dataset (GSE25219) (b) Bipolardatasets(GSE5388/GSE5389/GSE92538)
Figure 3.5: Common significant genes between healthy brain and bipolar datasets’ comparison. Colourful lines represent one different gene, x axis shows develop-mental stages and y axis represents genes’ expression values. While (a) represents genes behavior in healthy brain, (b) illustrates its behavior on bipolar samples
3.2.3
Comparison of results of bipolar brain development
and healthy brain development
After the significance test with ages we compared the results for common differential expressed genes. We had found 6: CSFR1, LPL, LPPR1, MT1G, and RPS4Y1, SLCO2B1 genes. After drawing expression graphics both for healthy and bipolar samples, unfortunately we did not find difference. While CSF1R, LPPR1, RPS4Y1, SLCO2B downregulated with age increase, LPL, MT1G up-regulated by age.
3.2.4
Gene-level changes in bipolar disorder
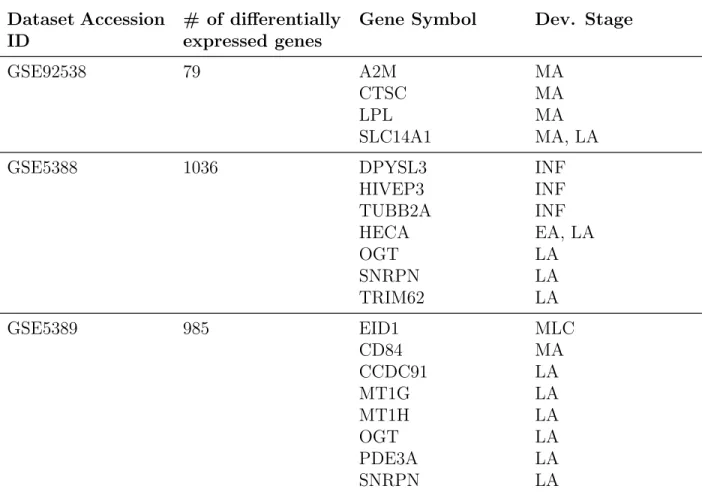
We also analyzed the bipolar datasets as individually by given disease status. We did not combined datasets together because each dataset had already enough sample size for the comparison. In table 3.2 you can see the number
a result of this GSE92538 has 4, GSE5388 had 7, GSE5389 had 8 commonly expressed genes. After that, we had drawn the expression level graphics to see changes both with development and with bipolar disorder separately.
Table 3.2: t-test results in bipolar datasets and information of commonly ex-pressed gen
Dataset Accession ID
# of differentially expressed genes
Gene Symbol Dev. Stage
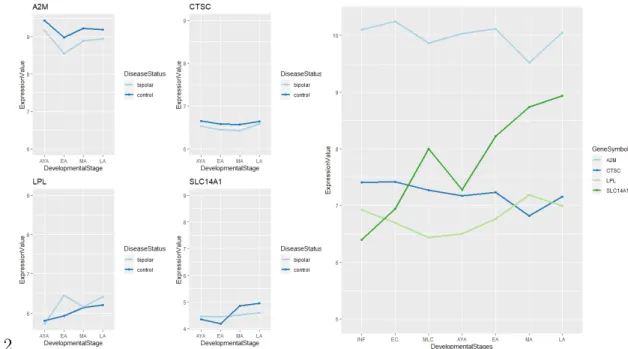
GSE92538 79 A2M MA
CTSC MA
LPL MA
SLC14A1 MA, LA
GSE5388 1036 DPYSL3 INF
HIVEP3 INF TUBB2A INF HECA EA, LA OGT LA SNRPN LA TRIM62 LA GSE5389 985 EID1 MLC CD84 MA CCDC91 LA MT1G LA MT1H LA OGT LA PDE3A LA SNRPN LA
(a) GSE5388
(b) GSE5389
Figure 3.6: Common significant genes between healthy (GSE25219) and bipo-lar datasets’ (GSE5388, GSE5389) comparison. Colourful lines represent each significant gene, x axis shows developmental stages and y axis represents genes’
1.2
Figure 3.7: Common significant genes between healthy (GSE25219) and bipolar dataset’s (GSE92538) comparison. Colourful lines represent each significant gene, x axis shows developmental stages and y axis represents genes’ expression values.
3.3
Gene Set Enrichment Analysis
Transcriptomic level analysis was followed by geneset enrichment analy-sis. For this method BH-correction was used for multiple-testing was p-value cut off had chosen as < 0.01. Significant pathways were identified by using Gene Ontology (GO) source. Enrichment networks and dotplots were created via ”clus-terProfiler” packages of R programming language.
For GSE25219 dataset, we followed same steps in gene-level analysis and compared developmental stages with separate ages. Then, we looked for the same genesets between each comparison. In table ??. you can see the detailed GSEA results of GSE25219. Common pathways were; 2, 133, 37, 67, 95, 118 GO pathways for INF vs AYA, EC vs AYA, MLC vs AYA, EA vs AYA, MA vs AYA, and LA vs AYA comparisons.
For GPL96 platform bipolar datasets, divided data (according to age) is compared for genesets. EA and AYA comparison, MA and AYA comparison, LA
and AYA comparison resulted with 682, 579 and 470 GO pathways respectively.
After applying GSEA for both bipolar and healthy samples by development we looked for the common geneset. This way, we found 10, 5, 8 common genesets for EA, MA, LA comparisons both differentially expressed in healthy and bipolar datasets. 3 of them were differentially regulated with the disease; these distinct pathways might be used for the identification of disease susceptibility and develop effective treatment methods. The full list of all significant pathways and their t-test p values are given in APPENDIX A.
Table 3.3: GSEA results of GSE25219 dataset
INF EC MLC EA MA LA 15Y 786 1787 3099 3087 3145 3322 18Y 751 1919 3092 3627 3365 3276 19Y 1108 3948 2122 2898 2967 3031 21Y 759 2264 2980 2283 2045 2596 22Y 1059 4327 2263 2165 2280 2374 23Y 1279 3554 1891 2401 1886 3053 2 133 37 71 95 118
Table 3.4: Common enriched pathways between bipolar and healthy brain Early Adulthood
Dataset description BD Healthy
humoral immune response negatively enriched positively enriched RNA splicing negatively enriched negatively enriched mRNA splicing, via spliceosome negatively enriched negatively enriched Sm-like protein family complex negatively enriched negatively enriched small nuclear ribonucleoprotein complex negatively enriched negatively enriched lysosomal membrane negatively enriched negatively enriched lytic vacuole membrane negatively enriched negatively enriched endopeptidase inhibitor activity negatively enriched positively enriched peptidase inhibitor activity negatively enriched positively enriched detection of chemical stimulus negatively enriched positively enriched
Middle Adulthood
Dataset description BD Healthy
peptide cross-linking positively enriched positively enriched histone acetyltransferase activity negatively enriched negatively enriched humoral immune response negatively enriched positively enriched killing of cells of other organism positively enriched positively enriched serine-type peptidase activity positively enriched positively enriched
Late Adulthood
Dataset description BD Healthy
spliceosomal complex negatively enriched negatively enriched cellular transition metal ion homeostasis negatively enriched negatively enriched oxidoreductase activity negatively enriched negatively enriched mitochondrial membrane negatively enriched negatively enriched mitochondrial inner membrane negatively enriched negatively enriched mitochondrial envelope negatively enriched negatively enriched sensory perception of chemical stimulus negatively enriched positively enriched organelle inner membrane negatively enriched negatively enriched
Chapter 4
Discussion
The main purpose of this study is to identify molecular signature of devel-opment of bipolar disorder. To achieve this goal, we examined the transcriptomic level changes in working memory areas from both bipolar and healthy brain sam-ples that were collected from individuals who were in different life stages. We had used one dataset that comprised of samples from different ages of healthy individuals, and 3 different datasets which contained samples from bipolar and control groups. For each comparison, students’ t-test and Benjamini-Hochberg correction applied and the transcripts whose p value less than 0.01 are listed as significant genes.
At the first stage of analysis, we examined healthy brain dataset by sep-arating data into six different developmental stages (infancy, early childhood, middle and late childhood, early adulthood, middle adulthood, late adulthood) and comparing them with the ages of adolescence stage individually (15Y, 18Y, 19y, 21Y, 22Y, 23Y) to collect more significant results. Hence, for each group comparison, 6 different t-test results were collected and by gathering them to-gether we aimed to find number of commonly expressed genes. As a result of this examination we have found 57 transcripts for INF, 4 transcripts for EC, 4 transcripts for MLC, 14 transcripts for EA, 25 transcripts for MA, 75 transcripts
decreased from infancy to adolescence and young adulthood than increased again starting from early adulthood to late adulthood; detailed information can be seen in figure 3.2
After revealing the transcriptomic signature of healthy brain accordingly our research question, we had started to work on bipolar datasets. When we took out the control samples only bipolar samples were remained, and the age range of bipolar brains were limited. Since we wanted to find differentially expressed genes by age, and to collect significant results; we combined 3 different bipolar datasets which conducted in the same microarray platform. After merging, we had 4 samples for AYA, 20 samples for EA, 39 samples MA, 20 samples for LA. Since we did not have samples from infancy and childhood period, we compared AYA group with early adulthood, middle adulthood, and late adulthood. As a result of DEG analysis of bipolar brains 87 genes for EA, 206 genes for MA and 194 genes for LA were identified as significantly changed by age.
Following obtaining healthy and bipolar brain development in transcrip-tomic level, we checked the results to find whether there are common genes that differentially expressed in both comparisons. In conclusion, even though we de-tected six common significant genes (CSF1R, LPL, LPPR1, MT1G, RPS4Y1, SLO2B1) we did not see different pattern for expression level changes as it can be seen in figure 3.4. Since we could not observe distinct way of regulation in healthy brain and bipolar brain development, we could not target a new bio marker transcript for bipolar disorder development.
It was a remarkable finding 6 common differentially expressed genes among comprehensively analyzed healthy and bipolar datasets. When significant genes were identified, we wanted to check if they were already associated with mental illnesses in previous reports. We found out that CSF1R (macrophage colony stim-ulating factor 1 receptor gene) and LPL (lipoprotein lipase gene), are strongly associated with immune system [57, 58]. In addition to CSF1R being associated with psychiatric disorders [59], it was also shown while it had low expression in MDD and SCZ samples, researchers can not detect any changes from BD sam-ples [60]. Although LPL gene encoding has not been associated with psychiatric
disorders yet, it was found to have different regulation in some neurological dis-eases; such as Alzheimer’s Disease [61]. When we checked that specifically men-tal illnesses, previous reports about second generation anti psychotics also affects lipoprotein metabolism [62]. Therefore, we believe that if we could identify how LPL is affected by the disease, in addition to developing better treatment meth-ods, it could reduce misdiagnosis rate. Moreover, literature review shows that, even if LPPR1, (phospholipid phosphatase-related protein type 1) has not been found in relation to BD, its variants might be good candidates for Parkinson’s disease diagnosis [63]. Furthermore, the expression of LPPR1 was detectable in SCZ [64].
Among other significant genes, MT1G, that is a metallothionenin gene family member, was reported in many psychiatric studies. Adolfo Sequeira and his colleagues conducted a research on suicide and mood disorder relationship in gene-level by comparing different microarray datasets. They illustrated that MT1G was significantly downregulated with the samples whose death cause was suicide [65]. Another meta analysis has shown metallohionein encoding genes were over expressed in BD and SCZ patients [66]. In addition to being a possible target gene for mood disorders, Seifuddin et al. reported that MT1G was highly expressed in the prefrontal cortex [67]. Another gene might be related with mental illnesses is Solute Carrier Organic Anion Transporter family member 2B1 (SLCO2B1) gene. It has been shown to be significantly associated with suicidal behavior in mood disorders: depression and anxiety [68]. Lastly, our final significant gene is located in Y chromosome and reported in a study which was conducted to detect bipolar susceptibility in different sexes. They claimed that it may be used to classify lithium response changes in male patients [69].
In addition to previous analysis, we did another examination to check whether significant genes in GSE25219 comparisons, are also determined in bipo-lar datasets or not. However while working on this hypothesis, we used a slightly different approach which is independent from age. Fundamentally, we only changed second step of the previous analysis. Instead of comparing only bipolar samples among different ages, we compared control and bipolar group that are
provided in the same dataset. As a result of this approach; we have found differ-ent genes for differdiffer-ent datasets. To be more specific we listed; A2M, CTSC, LPL, SLC14A1 genes for GSE92538. In GSE 5388 dataset DPYSL3, HECA, HIVEP3, OGT, SNRPN, TRIM62, TUBB2A was shared with healthy datasets’ results. We found CCDC91, CD84, EID1, MT1G, MT1H, OGT, PDE3A, SNRPN for GSE5389. By looking expression graphics of these genes, 7 genes were demon-strated to have different type of regulation in healthy and BD samples. Therefore, we claimed that these 7 genes can be candidate genes for bipolar disorder which are detectable for adolescence period in healthy brain. If we look at the graphs in a closer view, while SLC14A1, OGT, SNRPN, CCDC91, EID1 were upreg-ulated in healthy brain after AYA period, they were downregupreg-ulated by bipolar disorder. Literature review presents that SLC14A1 was reported as a suicide sus-ceptibility candidate gene for bipolar and schizophrenia patients [70]. OGT was identified as one of gene that is responsible from impairment in glycan biosynthe-sis metabolism in BD and SCZ [71]. Even if SNRPN had no direct link between to BD, its methylation levels affects many genes’ expression levels [?]. For a side note, OGT and SNRPN have been found in two datasets comparison. On the other side of the coin there were two genes that were regulated in opposite directions. Furthermore, our analysis results and previous studies were on the same page about down regulation of CCDC91 with BD [72]. GWAS reports show that EID1 plays a fundamental role in neuron cell development and neuronal cell functionality and it has been found association with neurodevelopmental dis-order. Although it has not been associated with BD yet, Budde et al. claims because of its biological function EID1 might be a target for BD as well [73]. Apart from these genes, HIVEP3, PDE3A were downregulated in healthy brain and upregulated in bipolar disorder. A comprehensive CNV study noted that HIVEP3 is related to the developmental brain disorders but has not specifically been indicated in BD [74]. PDE3A is another gene that related with lithium re-sponse in BD patients [75]. TRIM62 is upregulated from infancy to AYA period and downregulated from AYA to late adulthood. Interestingly, we found that TRIM62 which is mostly associated with cell proliferation and tumour cells is upregulated in bipolar disease [76].
It is crucial to convert this measurements to biologically meaningful re-sults. Since only microarray results does not give robust information about BD, for further analysis, we applied geneset enrichment analysis to identify biological functions. Although significant transcripts have been found in our analysis was associated with bipolar disorder directly or indirectly, we also want to see brain development and bipolar disorder in terms of geneset analysis. For this purpose we applied GSEA to datasets separately. Our results provided three possible target pathways that regulated differently in bipolar and healthy brain samples. Notably immune system activity was significant in both bipolar disorder and brain development. Immune system is still a conflicted subject in psychiatric re-search. Many studies focused on revealing the link between bipolar disorder and immune system. Yet, how they affect each other is still unclear. To overcome this issue Rosenblot suggested four possible scenarios about their association based on previous reports. Figure 4.1 summarizes these possible scenarios [77]. Under-standing the relationship between immune system and BD will be an important step towards effective treatment and diagnosis of BD.
Second significant geneset is Endopeptidase inhibitor activity and it plays crucial role for the cell metabolism and regulatory process. When we investigated its association with mental illnesses we saw by several scientist, different type of enzymes have been indicated as a target. For instance, Maes et al. conducted a study to check enzyme activity alterations in individuals with BD and SCZ according to treatment conditions. They observed that while activity of ”prolyl oligopeptidase”,one of the endopeptidase, was increased in untreated BD patients, surprisingly it was decreased in treated BD patients. [78]. Breen et al checked the peptidase inhibitor activity in human plasma from mental patients and measured the influence levels of the enzyme. They found the pathway had low expression in BD, but shown no change in SCZ [79]. Therefore, our results also point that it may be affected by development of bipolar disorder.
The last geneset is detection of chemical stimulus involved in sensory per-ception. We found that it was negatively enriched in BD whereas upregulated in healthy dataset. Sensory perception is a cognitive process which receive
chemi-Figure 4.1: Possible correlation between bipolar disorder, inflammatory comor-bidity and immunity. Four different interaction types are shown with sub figures; a, b, c, d. While ”a” illustrates how immune dysfunction gives rise to BD and causes inflammatory comorbidity, in ”b” bipolar disorder lead to immune system impairment therewith inflammatory problems arise. Sub figure ”c” shows the opposite direction of ”b”. Lastly, ”d” demonstrates bidirectional effects of three medical problems.[77]
undoubtedly is a neurological process. Also, we know that cognitive impairments are common for individuals who suffers from BD. Interestingly, a literature review about sensory perception and the relationship with BD is poor. While one re-cent study focuses on the olfactory responses from different mood phases for BD patients [80], other study measures the olfactory and visual processes in major depressive disorder according to treatment [81]. Even though we could not find a clear explanation about sensory perception and mood disorders, we know that it is affected and altered the sensitivity. A comprehensive study about Major depressive disorder (MDD) genetics study also shown that both immune system processes and detection of chemical stimulus in sensory perception is affected in MDD.[82]
Overall, current study suggests some of the possible targets for BD, but it is important to indicate potential limitations. First, for healthy brain dataset, we had uneven sample distribution for different developmental stages. For future aspects, the analysis could be conducted for larger sample size.
Second, to detect association of small effects we performed a number of analyses. Due to number of analysis steps, the study is prone to false negatives. Moreover, for bipolar dataset, we completely disregard the treatment effects. Because, besides anti psychotic treatment, it is possible to take immune system regulators that also changes the transcriptomic levels. Related with previous limitation, three different bipolar was used datasets to compare one healthy brain datasets thus, heterogeneity was another problem of this study. Furthermore, we did not explore the effect of brain development separately on different mood phases. Both gene-level and geneset level analysis show a potential target for BD which is immune system and its regulations. Therefore, targeting the immune system promises to improve understanding of BD pathology.
By using age information, the study could be also conducted for RNA-seq data instead of microarray. If we want to do some clinical investigation besides in silico work, we could validate potential biomarkers with real time PCR method from blood samples. Moreover, more in silico work may help to take out treatment
effects on the analysis results. If there is a confusion factor for both treatment ef-fects, sex and sample size, by combining bioinformatics method and blood samples from patients may improve prediction of development effects in bipolar disorder. Also it may help to understand drug efficiency in patients according to genetic background and sure thing that it also contribute to the personal medicine part of psychiatry. Lastly, our results suggest that the methodology could be used in treatment analysis and extended to other platforms or RNA-Seq data and provide insight to brain development based bipolar disorder transcriptome.
It was surprising that most of the molecular pathways are related with immunity. As it is indicated in table 3.4. The literature also indicate that these pathways might be affected by treatment. So further studies are required to clarify if the disease affect these pathways’ expression or not.
This is to our knowledge the first study to investigate development of BD in WM-related areas. Based on transcriptomic and geneset level analysis, our results point to immune system pathways as potential molecular target for BD. In addition, the present findings point to a close relation between immune system and brain development. Replication studies with larger groups of postmortem samples and blood samples are required to validate the results of this study.
Bibliography
[1] A. P. Association et al., Diagnostic and statistical manual of mental disorders (DSM-5®). American Psychiatric Pub, 2013.
[2] R. H. Perlis, M. J. Ostacher, J. F. Goldberg, D. J. Miklowitz, E. Friedman, J. Calabrese, M. E. Thase, and G. S. Sachs, “Transition to mania during treatment of bipolar depression,” Neuropsychopharmacology, vol. 35, no. 13, pp. 2545–2552, 2010.
[3] K. R. Merikangas, L. Cui, L. Heaton, E. Nakamura, C. Roca, J. Ding, H. Qin, W. Guo, Y. Yao-Shugart, C. Zarate, and J. Angst, “Independence of familial transmission of mania and depression: Results of the NIMH family study of affective spectrum disorders,” Molecular Psychiatry, vol. 19, no. 2, pp. 214– 219, 2014.
[4] C. L. Vandeleur, K. R. Merikangas, M. P. Strippoli, E. Castelao, and M. Preisig, “Specificity of psychosis, mania and major depression in a con-temporary family study,” Molecular Psychiatry, vol. 19, no. 2, pp. 209–213, 2014.
[5] E. P. Hayden and J. Nurnberger Jr, “Molecular genetics of bipolar disorder,” Genes, Brain and Behavior, vol. 5, no. 1, pp. 85–95, 2006.
[6] R. J. Baldessarini, L. Tondo, G. H. V´azquez, J. Undurraga, L. Bolzani, A. Yildiz, H.-M. K. Khalsa, M. Lai, B. Lepri, M. Lolich, et al., “Age at onset versus family history and clinical outcomes in 1,665 international bipolar-i disorder patients,” World Psychiatry, vol. 11, no. 1, pp. 40–46, 2012.
[7] R. H. Perlis, “Misdiagnosis of bipolar disorder,” American Journal of Man-aged Care, vol. 11, no. SUPPL. 9, pp. 57–63, 2005.
[8] N. J. Bray and M. C. O’Donovan, “The genetics of neuropsychiatric disor-ders,” Brain and Neuroscience Advances, vol. 2, p. 239821281879927, 2018.
[9] P. McGuffin, F. Rijsdijk, M. Andrew, P. Sham, R. Katz, and A. Cardno, “The heritability of bipolar affective disorder and the genetic relationship to unipolar depression,” Archives of General Psychiatry, vol. 60, no. 5, pp. 497– 502, 2003.
[10] S. Prathikanti and F. J. McMahon, “Genome scans for susceptibility genes in bipolar affective disorder,” Annals of Medicine, vol. 33, no. 4, pp. 257–262, 2001.
[11] X. Z. Hu, A. J. Rush, D. Charney, A. F. Wilson, A. J. Sorant, G. J. Papani-colaou, M. Fava, M. H. Trivedi, S. R. Wisniewski, G. Laje, S. Paddock, F. J. McMahon, H. Manji, and R. H. Lipsky, “Association between a functional serotonin transporter promoter polymorphism and citalopram treatment in adult outpatients with major depression,” Archives of General Psychiatry, vol. 64, no. 7, pp. 783–792, 2007.
[12] G. M. Hosang, H. L. Fisher, S. Cohen-Woods, P. McGuffin, and A. E. Farmer, “Stressful life events and catechol-O-methyl-transferase (COMT) gene in bipolar disorder,” Depression and Anxiety, vol. 34, no. 5, pp. 419– 426, 2017.
[13] J. Oliveira, B. Etain, M. Lajnef, N. Hamdani, M. Bennabi, D. Bengoufa, A. Sundaresh, A. B. Chaabane, F. Bellivier, C. Henry, J. P. Kahn, D. Char-ron, R. Krishnamoorthy, M. Leboyer, and R. Tamouza, “Combined effect of TLR2 gene polymorphism and early life stress on the age at onset of bipolar disorders,” PLoS ONE, vol. 10, no. 3, pp. 1–13, 2015.
[14] S. D. Detera-Wadleigh, C. Y. Liu, M. Maheshwari, I. Cardona, W. Corona, N. Akula, C. J. Steele, J. A. Badner, M. Kundu, L. Kassem, J. B. Potash, R. Gibbs, E. S. Gershon, and F. J. McMahon, “Sequence variation in DOCK9
and heterogeneity in bipolar disorder,” Psychiatric Genetics, vol. 17, no. 5, pp. 274–286, 2007.
[15] L. Liu, T. Foroud, X. Xuei, W. Berrettini, W. Byerley, W. Coryell, R. El-Mallakh, E. S. Gershon, J. R. Kelsoe, W. B. Lawson, D. F. MacKinnon, M. McInnis, F. J. McMahon, D. L. Murphy, J. Rice, W. Scheftner, P. R. Zandi, F. W. Lohoff, A. B. Niculescu, E. T. Meyer, H. J. Edenberg, and J. I. Nurnberger, “Evidence of association between brain-derived neurotrophic factor gene and bipolar disorder,” Psychiatric Genetics, vol. 18, no. 6, pp. 267–274, 2008.
[16] M. H. Park, E. Sanders, M. Howe, M. Singh, J. Hallmayer, E. Kim, and K. Chang, “Association of anxiety symptoms in offspring of bipolar parents with serotonin transporter-linked polymorphic region (5-HTTLPR) geno-type,” Journal of Child and Adolescent Psychopharmacology, vol. 25, no. 6, pp. 458–466, 2015.
[17] N. Craddock and P. Sklar, “Bipolar Disorder 1 - Genetics of bipolar disor-der,” The Lancet, vol. 381, no. 9878, pp. 1654–1662, 2013.
[18] D. M. Ruderfer, A. H. Fanous, S. Ripke, A. McQuillin, R. L. Amdur, P. V. Gejman, M. C. O, O. A. Andreassen, and S. Djurovic, “Polygenic dissec-tion of diagnosis and clinical dimensions of bipolar disorder and schizophre-nia Cross-Disorder Working Group of the Psychiatric Genomics Consortium HHS Public Access,” Mol Psychiatry, vol. 19138, no. 9, pp. 1017–1024, 2014.
[19] E. A. Stahl, G. Breen, A. J. Forstner, A. McQuillin, S. Ripke, V. Trubetskoy, M. Mattheisen, Y. Wang, J. R. Coleman, H. A. Gaspar, et al., “Genome-wide association study identifies 30 loci associated with bipolar disorder,” Nature genetics, vol. 51, no. 5, pp. 793–803, 2019.
[20] P. B. Mahon, M. Pirooznia, and F. S. Goes, “Genoma-Biologia Art,” 2011.
[21] D. Chen, X. Jiang, N. Akula, Y. Shugart, J. Wendland, C. Steele, L. Kassem, J. Park, N. Chatterjee, S. Jamain, et al., “Genome-wide association study
loci associated with bipolar disorder,” Molecular psychiatry, vol. 18, no. 2, pp. 195–205, 2013.
[22] M. J. Gandal, P. Zhang, E. Hadjimichael, R. L. Walker, C. Chen, S. Liu, H. Won, H. Van Bakel, M. Varghese, Y. Wang, et al., “Transcriptome-wide isoform-level dysregulation in asd, schizophrenia, and bipolar disorder,” Sci-ence, vol. 362, no. 6420, 2018.
[23] M. E. Breen, F. Seifuddin, P. P. Zandi, J. B. Potash, and V. L. Willour, “Investigating the role of early childhood abuse and HPA axis genes in sui-cide attempters with bipolar disorder,” Psychiatric Genetics, vol. 25, no. 3, pp. 106–111, 2015.
[24] S. Chang, J. Wang, K. Zhang, and J. Wang, “Pathway-based analysis for genome-wide association study data of bipolar disorder provides new insights for genetic study,” Protein and Cell, vol. 6, no. 12, pp. 912–915, 2015.
[25] M. D’Esposito and B. R. Postle, “The cognitive neuroscience of working memory,” Annual review of psychology, vol. 66, 2015.
[26] N. Cowan, M. Naveh-Benjamin, A. Kilb, and J. S. Saults, “Life-span de-velopment of visual working memory: When is feature binding difficult?,” Developmental psychology, vol. 42, no. 6, p. 1089, 2006.
[27] J. Fuster, “Neuropsychiatry of frontal lobe lesions,” Neuropsychiatry. Balti-more, Williams & Wilkins, 1995.
[28] D. L. Masterman and J. L. Cummings, “Frontal-subcortical circuits: the anatomic basis of executive, social and motivated behaviors,” Journal of Psychopharmacology, vol. 11, no. 2, pp. 107–114, 1997.
[29] J. R. Rieck, K. M. Rodrigue, M. A. Boylan, and K. M. Kennedy, “Age-related reduction of bold modulation to cognitive difficulty predicts poorer task accu-racy and poorer fluid reasoning ability,” Neuroimage, vol. 147, pp. 262–271, 2017.
[30] S. E. Gathercole, L. Brown, and S. J. Pickering, “Working memory assess-ments at school entry as longitudinal predictors of national curriculum at-tainment levels,” Educational and Child Psychology, vol. 20, no. 3, pp. 109– 122, 2003.
[31] H. Kwon, A. L. Reiss, and V. Menon, “Neural basis of protracted develop-mental changes in visuo-spatial working memory,” Proceedings of the Na-tional Academy of Sciences, vol. 99, no. 20, pp. 13336–13341, 2002.
[32] B. Casey, J. D. Cohen, P. Jezzard, R. Turner, D. C. Noll, R. J. Trainor, J. Giedd, D. Kaysen, L. Hertz-Pannier, and J. L. Rapoport, “Activation of prefrontal cortex in children during a nonspatial working memory task with functional mri,” Neuroimage, vol. 2, no. 3, pp. 221–229, 1995.
[33] M. E. Thomason, E. Race, B. Burrows, S. Whitfield-Gabrieli, G. H. Glover, and J. D. Gabrieli, “Development of spatial and verbal working memory capacity in the human brain,” Journal of cognitive neuroscience, vol. 21, no. 2, pp. 316–332, 2009.
[34] E. Bora, M. Y¨ucel, C. Pantelis, and M. Berk, “Meta-analytic review of neu-rocognition in bipolar ii disorder,” Acta psychiatrica scandinavica, vol. 123, no. 3, pp. 165–174, 2011.
[35] R. S. Lee, D. F. Hermens, J. Scott, M. A. Redoblado-Hodge, S. L. Naismith, J. Lagopoulos, K. R. Griffiths, M. A. Porter, and I. B. Hickie, “A meta-analysis of neuropsychological functioning in first-episode bipolar disorders,” Journal of psychiatric research, vol. 57, pp. 1–11, 2014.
[36] M. d. C. Neves, M. R. Albuquerque, F. S. Neves, G. M. Lage, L. Malloy-Diniz, R. Nicolato, and H. Corrˆea, “Sensorimotor performance in euthymic bipolar disorder: the mpraxis (penncnp) analysis,” Brazilian Journal of Psy-chiatry, vol. 36, no. 3, pp. 248–250, 2014.
[37] G. MacQueen, T. Hajek, and M. Alda, “The phenotypes of bipolar disorder: relevance for genetic investigations,” Molecular psychiatry, vol. 10, no. 9,
[38] O. Gruber, H. Tost, I. Henseler, C. Schmael, H. Scherk, G. Ende, M. Ruf, P. Falkai, and M. Rietschel, “Pathological amygdala activation during work-ing memory performance: Evidence for a pathophysiological trait marker in bipolar affective disorder,” Human brain mapping, vol. 31, no. 1, pp. 115– 125, 2010.
[39] C. McCormack, M. Green, J. Rowland, G. Roberts, A. Frankland, D. Hadzi-Pavlovic, C. Joslyn, P. Lau, A. Wright, F. Levy, et al., “Neuropsychological and social cognitive function in young people at genetic risk of bipolar dis-order,” Psychological medicine, vol. 46, no. 4, p. 745, 2016.
[40] S. Shifman, M. Bronstein, M. Sternfeld, A. Pisant´e, A. Weizman, I. Reznik, B. Spivak, N. Grisaru, L. Karp, R. Schiffer, et al., “Comt: a common sus-ceptibility gene in bipolar disorder and schizophrenia,” American Journal of Medical Genetics Part B: Neuropsychiatric Genetics, vol. 128, no. 1, pp. 61– 64, 2004.
[41] J. K. Pinsonneault, D. D. Han, K. E. Burdick, M. Kataki, A. Bertolino, A. K. Malhotra, H. H. Gu, and W. Sadee, “Dopamine transporter gene variant affecting expression in human brain is associated with bipolar disorder,” Neuropsychopharmacology, vol. 36, no. 8, pp. 1644–1655, 2011.
[42] K. E. Burdick, C. A. Hodgkinson, P. R. Szeszko, T. Lencz, J. M. Ekholm, J. M. Kane, D. Goldman, and A. K. Malhotra, “Disc1 and neurocognitive function in schizophrenia,” Neuroreport, vol. 16, no. 12, pp. 1399–1402, 2005.
[43] H. C. Brenhouse and S. L. Andersen, “Developmental trajectories during adolescence in males and females: a cross-species understanding of under-lying brain changes,” Neuroscience & Biobehavioral Reviews, vol. 35, no. 8, pp. 1687–1703, 2011.
[44] T. Paus, M. Keshavan, and J. N. Giedd, “Why do many psychiatric disorders emerge during adolescence?,” Nature Reviews Neuroscience, vol. 9, no. 12, pp. 947–957, 2008.
[45] C. Soraggi-Frez, F. H. Santos, P. B. Albuquerque, and L. F. Malloy-Diniz, “Disentangling working memory functioning in mood states of bipolar dis-order: A systematic review,” Frontiers in psychology, vol. 8, p. 574, 2017.
[46] J. Gruber, A. L. Purcell, M. J. Perna, and J. A. Mikels, “Letting go of the bad: Deficit in maintaining negative, but not positive, emotion in bipolar disorder.,” Emotion, vol. 13, no. 1, p. 168, 2013.
[47] A. Sabater, A. C. Garcia-Blanco, H. M. Verdet, P. Sierra, J. Ribes, I. Villar, M. J. Lara, P. Arnal, L. Rojo, and L. Livianos, “Comparative neurocognitive effects of lithium and anticonvulsants in long-term stable bipolar patients,” Journal of affective disorders, vol. 190, pp. 34–40, 2016.
[48] U. Alon, N. Barkai, D. A. Notterman, K. Gish, S. Ybarra, D. Mack, and A. J. Levine, “Broad patterns of gene expression revealed by clustering analysis of tumor and normal colon tissues probed by oligonucleotide arrays,” Pro-ceedings of the National Academy of Sciences, vol. 96, no. 12, pp. 6745–6750, 1999.
[49] D. J. Lockhart, H. Dong, M. C. Byrne, M. T. Follettie, M. V. Gallo, M. S. Chee, M. Mittmann, C. Wang, M. Kobayashi, H. Norton, et al., “Expression monitoring by hybridization to high-density oligonucleotide arrays,” Nature biotechnology, vol. 14, no. 13, pp. 1675–1680, 1996.
[50] E. Clough and T. Barrett, “The gene expression omnibus database,” in Sta-tistical genomics, pp. 93–110, Springer, 2016.
[51] H. J. Kang, Y. I. Kawasawa, F. Cheng, Y. Zhu, X. Xu, M. Li, A. M. Sousa, M. Pletikos, K. A. Meyer, G. Sedmak, et al., “Spatio-temporal transcriptome of the human brain,” Nature, vol. 478, no. 7370, pp. 483–489, 2011.
[52] M. Ryan, H. Lockstone, S. Huffaker, M. Wayland, M. Webster, and S. Bahn, “Gene expression analysis of bipolar disorder reveals downregulation of the ubiquitin cycle and alterations in synaptic genes,” Molecular psychiatry, vol. 11, no. 10, pp. 965–978, 2006.
[53] M. H. Hagenauer, A. Schulmann, J. Z. Li, M. P. Vawter, D. M. Walsh, R. C. Thompson, C. A. Turner, W. E. Bunney, R. M. Myers, J. D. Barchas, et al., “Inference of cell type content from human brain transcriptomic datasets illuminates the effects of age, manner of death, dissection, and psychiatric diagnosis,” PloS one, vol. 13, no. 7, p. e0200003, 2018.
[54] R. A. Irizarry, B. Hobbs, F. Collin, Y. D. Beazer-Barclay, K. J. Antonellis, U. Scherf, and T. P. Speed, “Exploration, normalization, and summaries of high density oligonucleotide array probe level data,” Biostatistics, vol. 4, no. 2, pp. 249–264, 2003.
[55] B. Carvalho, H. Bengtsson, T. P. Speed, and R. A. Irizarry, “Exploration, normalization, and genotype calls of high-density oligonucleotide snp array data,” Biostatistics, vol. 8, no. 2, pp. 485–499, 2007.
[56] Y. Benjamini and Y. Hochberg, “Controlling the false discovery rate: a practical and powerful approach to multiple testing,” Journal of the Royal statistical society: series B (Methodological), vol. 57, no. 1, pp. 289–300, 1995.
[57] G. Raivich, M. Bohatschek, C. U. Kloss, A. Werner, L. L. Jones, and G. W. Kreutzberg, “Neuroglial activation repertoire in the injured brain: graded response, molecular mechanisms and cues to physiological function,” Brain research reviews, vol. 30, no. 1, pp. 77–105, 1999.
[58] Y. Essaji, Y. Yang, C. J. Albert, D. A. Ford, and R. J. Brown, “Hydrolysis products generated by lipoprotein lipase and endothelial lipase differentially impact thp-1 macrophage cell signalling pathways,” Lipids, vol. 48, no. 8, pp. 769–778, 2013.
[59] V. Mondelli, A. C. Vernon, F. Turkheimer, P. Dazzan, and C. M. Pariante, “Brain microglia in psychiatric disorders,” The Lancet Psychiatry, vol. 4, no. 7, pp. 563–572, 2017.
[60] J. Zhang, L. Chang, Y. Pu, and K. Hashimoto, “Abnormal expression of colony stimulating factor 1 receptor (csf1r) and transcription factor pu. 1
(spi1) in the spleen from patients with major psychiatric disorders: a role of brain–spleen axis,” Journal of Affective Disorders, 2020.
[61] T. Gotoda, K. Shirai, T. Ohta, J. Kobayashi, S. Yokoyama, S. Oikawa, H. Bujo, S. Ishibashi, H. Arai, S. Yamashita, et al., “Diagnosis and manage-ment of type i and type v hyperlipoproteinemia,” Journal of atherosclerosis and thrombosis, pp. 1111290444–1111290444, 2011.
[62] J. W. Newcomer, “Second-generation (atypical) antipsychotics and metabolic effects,” CNS drugs, vol. 19, no. 1, pp. 1–93, 2005.
[63] Z. D. Wallen, H. Chen, E. M. Hill-Burns, S. A. Factor, C. P. Zabetian, and H. Payami, “Plasticity-related gene 3 (lppr1) and age at diagnosis of parkinson disease,” Neurology Genetics, vol. 4, no. 5, 2018.
[64] L. Jouan, S. L. Girard, S. Dobrzeniecka, A. Ambalavanan, M.-O. Krebs, R. Joober, J. Gauthier, P. A. Dion, and G. A. Rouleau, “Investigation of rare variants in lrp1, kpna1, als2cl and znf480 genes in schizophrenia pa-tients reflects genetic heterogeneity of the disease,” Behavioral and Brain Functions, vol. 9, no. 1, p. 9, 2013.
[65] A. Sequeira, M. V. Martin, B. Rollins, E. A. Moon, W. E. Bunney, F. Maccia-rdi, S. Lupoli, E. N. Smith, J. Kelsoe, C. N. Magnan, M. van Oven, P. Baldi, D. C. Wallace, and M. P. Vawter, “Mitochondrial mutations and polymor-phisms in psychiatric disorders,” Frontiers in Genetics, vol. 3, no. JUN, pp. 1–16, 2012.
[66] M. Logotheti, O. Papadodima, N. Venizelos, A. Chatziioannou, and F. Koli-sis, “A comparative genomic study in schizophrenic and in bipolar disorder patients, based on microarray expression profiling meta-analysis,” The Sci-entific world journal, vol. 2013, 2013.
[67] F. Seifuddin, M. Pirooznia, J. T. Judy, F. S. Goes, J. B. Potash, and P. P. Zandi, “Systematic review of genome-wide gene expression studies of bipolar disorder,” BMC psychiatry, vol. 13, no. 1, p. 213, 2013.