ANALYSIS OF p73 GENE IN HfePATOCeLLULAR GARCINQM
ATHESfS SUBMITTEDTO
THE DEPARTMENT OF MOLECULAR BIOLOGY AND GENETICS AND THE INSTITUTE OF ENGINEERING AND SGIENCE OF
BILKENT UNIVERSITY
IN PARTIAL FULFILIMENT OF THE REQUIREMENTS FOR THE DEGREE OF MASTER OF SCIENCE
NECATİ FI ΝΟΙΚΙ. AUGUST 1998 ^ .· ■ . --γ"
S3£
• r S £/33B
ANALYSIS OF p73 GENE IN HEPATOCELLULAR CARCE^OMA
A THESIS SUBMITTED TO
THE DEPARTMENT OF MOLECULAR BIOLOGY AND GENETICS AND THE INSTITUTE OF ENGINEERING AND SCIENCE OF
BILKENT UNIVERSITY
IN PARTIAL FULFILLMENT OF THE REQUIREMENTS FOR THE DEGREE OF MASTER OF SCIENCE
BY
NECATI FINDIKLI AUGUST 1998
W C
I certify that I read this thesis and that in my opinion it is fully adequate, in scope and in quality, as thesis for the degree of Master of Science.
Prof. Dr. Melunet Oztiirk;
I certify that I read this thesis and that in my opinion it is fully adequate, in scope and in quality, as thesis for the degree of Master of Science.
I certify that I read this thesis and that in my opinion it is fully adequate, in scope and in quality, as thesis for the degree of Master of Science.
s s i5 ^ r o ^ ^ ^ ur Yavuzer
Approved for Institute of Engineering and Science.
ABSTRACT
ANALYSIS OF p73 GENE IN HEPATOCELLULAR CARCINOMA
Necati Fındıklı
M.S. in Molecular Biology and Genetics Supervisor; Prof. Dr. Mehmet Óztürk
August 1998
Hepatocellular carcinoma (HCC) is the eighth most frequent cancer worldwide, iipidemiologically-studied risk factors include hepatitis B virus (greater than 80%), hepatitis C virus and aflatoxins. Molecular mechanisms of hepatocarcinogenesis are poorly understood. The only gene known to be consistently involved in these tumors is the p53 tumor suppressor gene. However, this gene was found to be mutated or ifiactivated in about 30% of HCC. There is a need to study additional genes in order to fully understand hepatocellular carcinogenesis. p73 has been identified recently as a p5i -homolog gene. In this study, we analyzed the possible involvement of this gene in HCC. We investigated both the expression and structure of p73 gene in HCC for possible alterations.We first developed a novel method to analyze the expression of alternatively spliced transcripts of p73 (p73a and p73p) simultaneously. This technique, based on RT-PCR, allows the analysis of p73 transcripts semi-quantitatively. We found that p73a was expressed ubiquituously in 8 cell lines derived from normal liver or HCC tumors. Interestingly, p73|3 was present only in 5 differentiated but not in 3 undifferentiated cell lines. The differentiation status of these cell lines were tested by the analysis of albumin and a-fetoprotein transcripts by RT-PCR. These transcripts were present in 3/5 differentiated but not in 3 undifferentiated cell lines. Next, we screened 25 HCC samples for possible mutations of p73 gene at selected exons with non-radioactive heteroduplex test, radioactive SSCP analysis, restriction enzyme analysis and DNA sequencing. No alterations were found in exons homologous to those of p53 known to harbor mutational hotspots.From these observations, we conclude that i) /3 gene is not mutated in HCC, but it may play a critical role in hepatocellular differentiation. As p73p was found in differentiated cell lines, this form may be involved in transcriptional regulation of liver-specific genes. Additional studues are needed to confirm this hypothesis.
ÖZET
KARACİĞER KANSERİNDE p73 GENİNİN ANALİZİ
Necati Fındıklı
Moleküler Biyoloji ve Genetik Yüksek Lisans Tez Yöneticisi: Prof. Dr. Mehmet Öztûrk
Ağustos 1998
Hepatoselüler karsinom (HCC) dünyada sekizinci en yaygın kanserdir. Epidemiyolojik olarak araştınimış risk faktörleri arasında hepatit B virüsü (%80’den fazla), hepatit C virüsü ve aflatoksinler başta gelmektedir. Hepatoselüler karsinogenezin moleküler mekanizmalan çok iyi bilinmemektedir. Bu tümörlerde sıkça rolü olduğu saptanan tek gen p53 tümör baskılayıcı genidir. Ancak, bu genin mutasyonu ya da
inaktivasyonu HCCTerin yaklaşık %30’unda gözlenmiştir. Hepatoselüler
karsinogenezin tam olarak anlaşılabilmesi için diğer genlerin de incelenmesi gerekmektedir. p73 yakın zamanda p53-homoloğu bir gen olarak bulunmuştur. Bu çalışmada, bu genin hepatoselüler karsinomdaki olası rolü araştınimıştır. p73 geninin HCC’deki yapısı ve ifadesi, olası değişimler açısından incelenmiştir. Önce p73’ün alternatif olarak ifade edilen iki transkriptini (p73a ve p73Ş) ayni zamanda incelemek için yeni bir yöntem geliştirilmiştir. RT-PCR’a dayanan bu teknik, p73 transkriptlerinin miktannı kabaca belirleyebilmektedir. Böylece HCC tümörlerden ve normal karaciğerden türetilmiş 8 hücre hattında p73a’nm ifade edildiği gözlenmiştir. Buna karşılık p73p sadece 5 farklılaşmış hücre hattında görüldü. Farklılığını yitirmiş 3 hücre hattında ise p73p bulunamadı. Bu hücrelenin farklılaşma durumlan RT-PCR tekniği ile albümin ve alfa-fetoprotein transkriptleri incelenerek test edildi. Bu transkriptler 5 farklılaşmış hücrenin 3’ünde görüldü ancak 3 farklılığını yitirmiş hücre hattında görülmedi. Daha sonra, 25 HCC örneği p73 geninin seçilmiş ekzonlanndaki olası mütasyonlan belirlemek amacıyla non-radyoaktif heterodupleks testi, radyoaktif SSCP analizi, restriksiyon enzim analizi ve DNA dizi analizi yöntemleri ile tarandı. p53 geninin en çok mütasyona uğradığı bilinen ekzonlanna benzerlik gösteren p73 eksonlannda mutasyon bulunmadı. Bu gözlemlerden yola çıkarak, p73 geninin HCC’de mütasyona uğramadığı, ama hepatoselüler farklılaşmada kritik bir rol oynayabileceği sonucunu çıkardık. p73Ş sadece farklılaşmış hücrelerde görüldüğünden, bu form karaciğere-özgün genlerin RNA ifadesinin düzenlenmesinde rol oynayabilir. Bu hipotezin ek çalışmalarla doğrulanması gerekmektedir.
To my parents Vahit and Fatma
and
to my sisters Zuhal and Hilal.
ACKNOW LEDGEMENT
First and foremost my most sincere thanks go to my supervisor Prof Dr. ^/'f';h^net Öztürk who gave me invaluable support, guidance and motivation in completing this thesis. It has been a privilege to work under his direction. I am indebted to him for showing me the beauty of molecular biology and genetics and for teaching me how to be a good scientist.
I would particularly like to thank to my family who continuously gave encouragement and support in every way. This work could not be made without their love and optimism.
I would also like to thank to Assoc. Prof. Dr. Tayfun Özçelik, Dr. Ergün Pmarbaşı, Assist. Prof. Işık G. Yuluğ and Dr. Cengiz Yakıcı er for teaching me invaluable concepts and for their very helpful and useful conversations at times of particular crisis.
Very special thanks to Emre for always sharing my loneliness in Ankara and giving me a helpful hand in hard times. I am very much happy about sharing the same apartment with him with all his motivating conversations on my thesis work, computers :md cars.
Specially, I would like to thank to Çağla for her love, support and for putting up with me. It was a great pleasure to share the same office with her intimate questions about flowers. She also improved my knowledge on cats.
My most special thanks go to Emre, Berna, Esma, and Kezi for their continuous help and understanding. Nights in Ankara would not be that enjoyable without their presence.
My special thanks also go to Bemaby for her sincere friendship and help. She is one of the few people who really understands me.
I would also like to thank to other members of the lab, Reşat, Buket, Esra, Hilal, Emre Öktem, Korkut, Cemaliye, Tuba, Tolga Çağatay, Alper, Burcu, Birsen, Gürol, Tolga Emre, Arzu, Gülayşe, Aslı, Hani and Bilada and ali the other people in the department for their firiendship and help. They all really taught me what is a group work. Thanks to Lütfıye Hanım and Abdullah Bey for their continuous and immediate technical support.
Special thanks to Sevim and Füsım for their friendship, optimism and help. I will really miss spending lunch time with them.
Finally, I would like to thank all the individuals and institutions that made this thesis work possible.
TABLE OF CONTENTS Contents: Page: Abstract Özet Acknowledgement Table of contents List of tables List of figures Abbreviations 1-INTRODUCTION
1.1. Molecular pathogenesis of HCC and role of p53 1.2. p53 tumor suppressor gene and cancer
1.3. Cellular functions of p53
1.4. Biochemical characterization of the p53 1.5. Inactivation and activation of p53
1.6. Identification and characterization of p73 gene
1.7. Functional and structural similarities between p53 and p73 1.8. Aim of the project
2-MATERIALS AND METHODS 2.1. MATERIALS 11 111 Vlll ix xi 1 1 6 10 15 16 20 20 24 25 25
2.1.1. Cell lines and primary tumor samples 2.1.2. Chemicals
2.1.3. Stock solutions and buffers 2.1.4. Plastics and disposables 2.1.5. Apparatus
2.2. METHODS
2.2.1. Growth medium preparation
2.2.2. Cyropreservation of stock cells and thawing frozen stock of cells 2.2.3. Subculturing of cells
2.2.4. Total RNA preparation 2.2.5. Electrophoresis of RNA
2.2.5.1. Formaldehyde-containing 1% agarose gel 2.2.5.2. Sample preparation
2.2.5.3. Staining and visualization 2.2.6. cDNA preparation
2.2.7. PCR amplification
2.2.8. Agarose gel electrophoresis 2.2.9. Isolation of genomic DNA 2.2.10. PCR amplification of p73 gene 2.2.11. Agarose gel electrophoresis
2.2.12. Non-radioactive heteroduplex analysis 2.2.13. Radioactive SSCP analysis 25 27 30 31 32 32 33 34 34 35 36 36 36 37 37 38 41 41 41 42 43 25
2.2.14. Restriction enzyme analysis 2.2.15. Direct DNA sequencing 3-RESULTS
3.1. The expression of p73 in HCC cell lines
3.1.1. Establishment of a new method for combined analysis of alternatively spliced p73 transcripts
3.1.2. p73a and p73(3 form in HCC and liver-derived cell lines 3.2. p73 gene mutation analysis in primary tumors
3.2.1. PCR amplification of p73 exons 3.2.2. Results p73 mutation analysis 4- DISCUSSION 5- PERSPECTIVES 6- REFERENCES 7- APPENDIX 47 48 48 50 55 58 58 58 72 77 79 100 45
LIST OF TABLES
Tables: Page:
Table 1.1. p53-responsive elements of target genes 12
Table 2.1. Synthetic oligonucleotide primers used for RT-PCR analysis 39
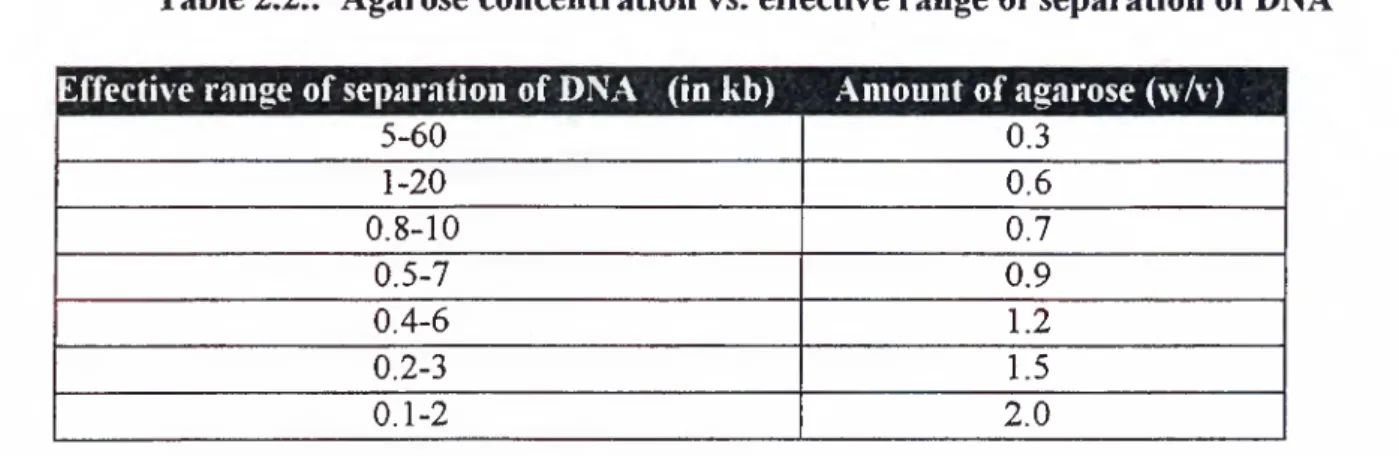
Table 2.2. Agarose concentration vs. effective range of separation of DNA 40
Table 2.3. Synthetic oligonucleotide primers of p73 DBD exons used for 41
heteroduplex and radioactive SSCP analysis
Table 3.1. Reference figures of p73 exonic amplifications 59
Table 3.2. Results of mutation analysis in p73 DBD exons and conserved 62
hotspots
Table 4.1. Data collected from previous reports and p73 expression status of 75 cell lines
Figures:
LIST OF FIGURES
Page:
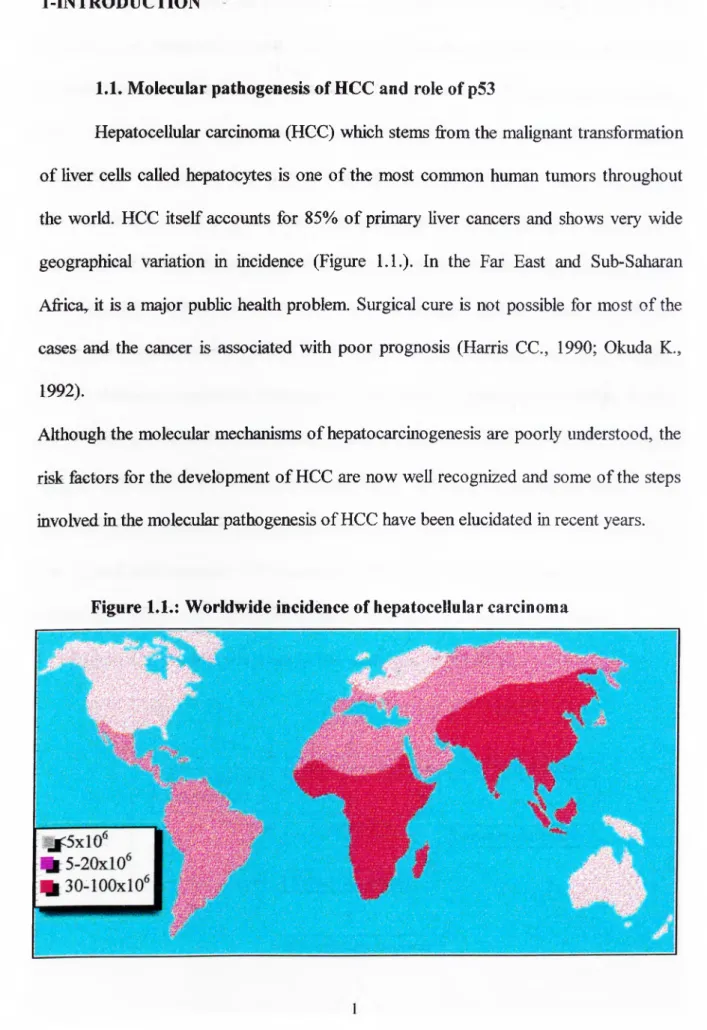
Figure 1.1. Worldwide incidence of hepatocellular carcinoma 1
Figure 1.2. Factors involved in the pathogenesis of HCC 2
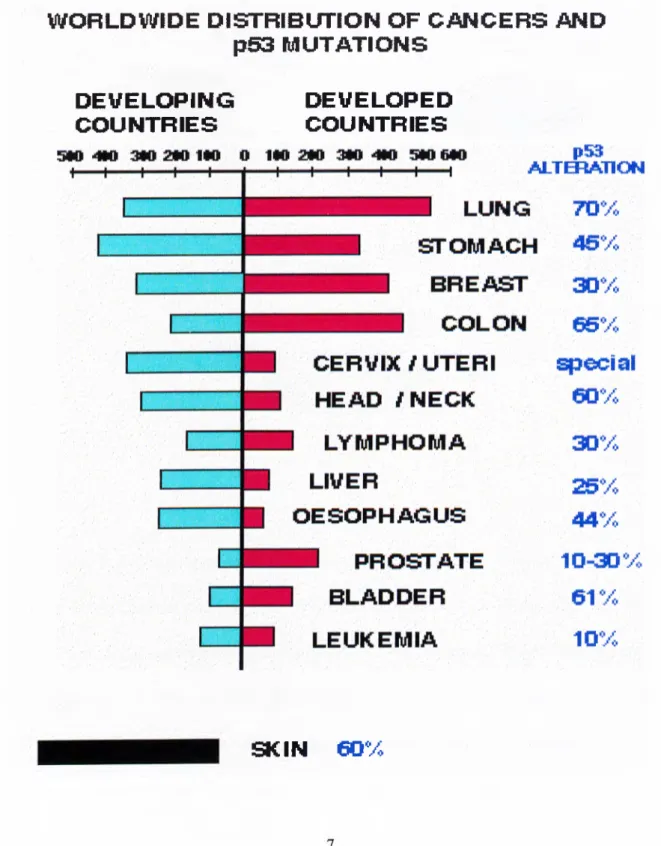
Figure 1.3. Worldwide distribution of cancers and p53 mutation rates 7
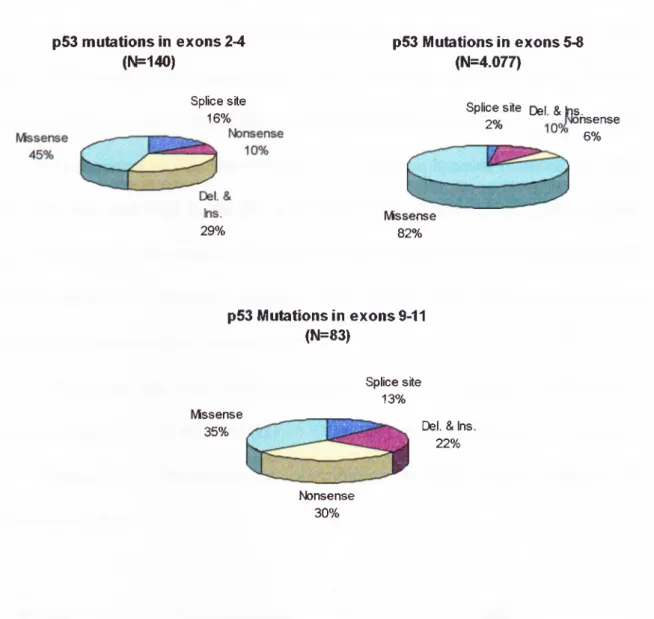
Figure 1.4. Distribution of p53 mutations in different exons 8
Figure 1.5. Comparison of base changes between all cancers and
HCC
9
Figure 1.6. p53 hotspots in all cancers and in HCC 10
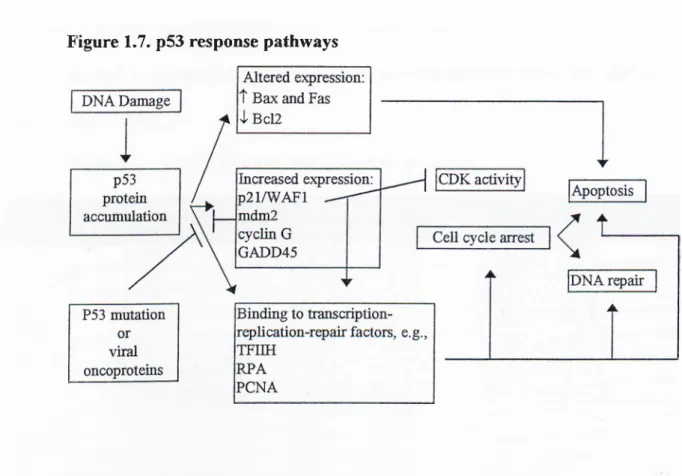
Figure 1.7. p53 response pathways 11
Figure 1.8. Functional domains of TP53 16
Figure 1.9. Homology between p73a and p53 21
Figure 1.10. p73 variants 22
Figure 2.1. Mutational hotspots that are conserved also in p73 and the
enzymes used for the REA
46
Figure 3.1. Total RNAs as tested by Et-Br staining 49
Figure 3.2. Nested-PCR amplification diagram and results 50
Figure 3.3. Amplification diagram of p73 forms. 51
Figure 3.4. Specificity test of p73a and p73p-specific PCR primers 52
Figure 3.5. Multiplex amplification of p73 forms 53
Figure 3.6. Multiplex amplification of p73 forms and G3PDH
Figure 3.7. RT-PCR results of two p73 forms
54 55
Figure 3.8. AFP and albumin expression during hepatocyte 56
development
Figure 3.9. Amplification of a-fetoprotein and albumin in cell lines 57
Figure 3.10. 10% non-denaturing PAGE 59
Figure 3.11. PCR Amplification of p73 exon 5 63
Figure 3.12. PCR Amplification of p73 exon 6 64
Figure 3.13. PCR Amplification of p73 exon 7 65
Figure 3.14. PCR Amplification of p73 exon 8 66
Figure 3.15. Heteroduplex analysis of p73 exon 5 67
Figure 3.16. Heteroduplex analysis of p73 exon 6 68
Figure 3.17. Heteroduplex analysis of p73 exon 7 69
Figure 3.18. Heteroduplex analysis of p73 exon 8 70
ABBREVIATIONS
A<iE Agarose gel electrophoresis
APS Ammonium per sulfate
cDNA Complementary DNA
C-terminus Carboxy terminus
DBD DNA-binding domain
DEPC diethyl polycarbonate
DEPC Diethyl polycarbonate
DMEM Dulbecco’s modified Eagle’s medium
DMSO Dimethyl sulfoxide
l^NA Deoxyribonucleic acid
dNTP Deoxynucleotide triphosphate
DS DNA sequencing
EDTA Ethylene diamino tetra acetic acid
PCS Fetal calf serum
F-medium Freezing medium
G3PDH Glucose-3-phosphate dehydrogenase
HBV Hepatitis B virus
HCC Hepatocellular carcinoma
HCV Hepatitis C virus
HDA Heteroduplex analysis
HPV Human papillomavirus
kDa Kilo dalton
LOH Loss of heterozygosity
MOPS 3 -(N-morpholino)propanesulfonic acid
mRNA Messenger RNA
N-terminus Amino terminus
PAGE Polyacrylamide gel electrophoresis
PBS Phosphate buffered saline
PC R Polymerase chain reaction
PI(3)K Phosphotidyl inositol 3 ’ kinase
RBI Retinoblastoma gene
REA Restriction enzyme analysis
RNA Ribonucleic acid
rpm Revolution per minute
RT-PCR Reverse transcription-polymerase chain
reaction
SSCP Single strand conformation polymorphism
SV40 Simian virus 40
TAE Tris-acetic acid-EDTA
TBE Tris-boric acid-EDTA
TBP TATA-binding protein
TEMED
u v
N,N,N,N-tetramethyl-1,2 diaxninoethane Ultraviolet
1-INTRODUGTION
1.1. Molecular pathogenesis of HCC and role of p53
Hepatocellular carcinoma (HCC) which stems from the malignant transformation of liver cells called hepatocytes is one of the most common human tumors throughout the world. HCC itself accounts for 85% of primary liver cancers and shows very wide geographical variation in incidence (Figure 1.1.). In the Far East and Sub-Saliaran Africa, it is a major public health problem. Surgical cure is not possible for most of the cases and the cancer is associated with poor prognosis (Harris CC., 1990; Okuda K.,
1992).
Although the molecular mechanisms of hepatocarcinogenesis are poorly understood, the
risk factors for the development of HCC are now well recognized and some of the steps
involved in the molecular pathogenesis of HCC have been elucidated in recent years.
Most HCCs develop as a result of chronic liver disease induced by hepatitis B virus (HBV) or hepatitis C virus (HCV). Chronic exposure to aflatoxins and certain metabolic diseases of the liver also cause HCC. (Figure 1.2.). In both cases resulting genetic mutations are common events before hepatocellular carcinoma develops (Wands JR., 1995).So far, the most extensively studied etiological factors are HBV, HCV and certain toxins ingested via contaminated food. In sub-Saharan Africa and certain parts of Asia including Japan relatively high number of the HCC patients carry serological markers of hepatitis B virus (>90% for southern Africa; Wands JR., 1995). Although the mechanisms by which HBV enhances hepatocellular carcinogenesis are not well defined, insertional mutagenesis has been suggested but appears to be important only in the woodchuck model in which insertional activation of N-myc gene is common (Fourel et al., 1990). In human HCC, only a few hepatomas have been found with viral integration near genes associated with growth control (for example cyclin A) and differentiation (for example retinoic acid receptor; Wang et al., 1992; Dejean et al., 1986). It has also been suggested that viral protein HBx, encoded by
Figure 1.2. Factors involved in the pathogenesis of HCC.
HBV Alcohol HCV
ir I
Growth factor activation
Chronic liver injui^ 4— [ Metabolic disorders
I Regeneration Genetic alterations / Environmental factors I Hepatocellular carcinoma
hepatitis B virus may act as an effector of cellular transcription factors (Maguire et al, 1991) or may inactivate the function of p53 by sequestering the protein in the cytoplasm (Henkler et al.,1995; Elmore et al., 1997; Ueda et al., 1995).
Like HBV, percentage of HCC patients infected by HCV varies from population to population and depends in part on the exposure of general population to this virus. In that marmer, HCV appears to be a major cause of HCC in Japan, Italy, and Spain whereas it seems to play a less important role in South Africa and Taiwan where HBV is predominant. So far, there is no evidence to suggest that HCV has a direct role in the molecular pathogenesis of HCC. HCV is associated with this disease by its ability to produce chronic liver injury, followed by regeneration and the eventual development of cirrhosis (Colombo et al., 1991; Liang et al., 1993; Raedle et al., 1997).
Many attempts have been made to characterize the chromosomal abnormalities in HCC, although karyotyping of primary HCC was difficult and achieved only in limited cases (Bardi et al., 1992; Simon et al., 1990) including HCC cell lines in which a high rate of aneuploidy was detected (Chen et al., 1993). In HCC, chromosome gains especially chromosomes 4, 6, 7, 8, 16 and 17 were observed whereas total chromosome loss was seen more rarely. Multiple abnormalities of chromosome 1 was noticed. Aberrant chromosome number, as well as deletions and translocations that resulted in loss of the distal region were described (Yeh et al., 1994). Chromosomal regions including 4q, 5q, lOq, lip , 13q, 16q and 17p and 22q have frequently been found to show allelic losses, chromosome 17p in which p53 tumor suppressor gene resides giving the highest rate. As in the case of p53 in 17p, these losses or alterations in chromosome number and the regions may reveal the genes that are important for the
HCC development (Simon et al., 1991; Takahashi et al., 1993; Yeh et al., 1994; Zimmermann et al., 1997).
Activation of known protooncogenes such as Ki-ras, N-ras and IGF2 does not seem to play an important role in HCC, however in several cases, amplification and over expression of cyclin D1 has been reported (Takada et al., 1989; Tsuda et al., 1989; Zhang et al., 1993; Nishida et al., 1994).
Among the known tumor suppressor genes, only a few of them have been tested for the possible involvement in HCC. So far, the most extensively studied tumor suppressor gene is p53 gene, which encodes a nuclear phosphoprotein that acts as an important factor in the control of normal cell proliferation. It has been reported that this gene shows genetic aberrations in 30% of the hepatocellular carcinomas. It has also been reported that HCC-specific codon 249 mutation of p53 is frequent in geographic areas where there is a high risk of exposure to aflatoxin p i, which is a known mutagen inducing G“> T transversions (Bressac et al., 1991; Hsu et al., 1991; Ozturk et al.,
1991; Aguilar et al., 1993; Fujimoto et al., 1994). HCC samples from other regions show low frequency of p53 mutations and codon 249 mutation is rare or absent. (De Benedetti et al., 1995; Debuire et al., 1993; Kubicka et al., 1995; Kazachkov et al., 1996; Unsal et al., 1994).
As another important tumor suppressor gene, retinoblastoma gene (RBI) has been reported to show frequent loss of heterozygosity (LOH) and loss of expression. RBI mutations have been described only rarely. This could be due to the very large size
of the gene which is difficult to study systemically (Farshid et al., 1994; Hada et al., 1996; Puisieux et al., 1993; Friedman et al., 1997).
pl6/INK4A /MTSl gene, which was found to show germ-line mutations in half of the familial melanomas, has also been reported to show rare germ-line and somatic mutations in HCC. The loss of p l6 protein expression was also reported for several HCC cell lines (Kita et al., 1996; Piao et al, 1997; Biden et a l, 1997; Chaubert et al, 1997; Kaino et a l, 1997; Bonilla et a l, 1998). Finally, pl6/INK4A/MTSl gene promoter was shown to be silenced by de novo méthylation. This type of inactivation is frequently observed in human cancers including hepatocellular carcinoma (Merlo et al, 1995; Chaubert et al, 1997).
Another gene that is reported to be mutated in HCC is the mannose-6- phosphate/insulin-like grov^h factor-Il receptor (M6P/IGF2R) gene. Its gene product plays a role in the activation of the TGFP and the degradation of IGF2 (De Souza et a l, 1995; Piao et al, 1997).
Compared to other genes, it appears that p53 gene plays an important role in hepatocarcinogenesis. But so far, p53 has been found to be mutated in 30-50% of the cases. The remaining 50% of the cases can be attributable to the other gene(s) that play critical roles in liver carcinogenesis. Other genes with p53-like activity could also be involved in HCC development. p73 has been identified recently as a new relative of p53 gene (Kaghad et a l, 1997). Although there is not enough data about its implications in cancer as well as its cellular function, its high homology to p53 suggests that it can also play an important role in cancer. The study of p73 in HCC was interesting because this
gene is located at chromosomal locus lp36 which is known to be deleted in HCC (Yeh et al., 1994). Before presenting the aim of our work, we will summarize the present state of literature about p53 and p73 with a specific emphasis on HCC-related observations.
1.2. p53 tumor suppressor gene and cancer
p53 protein was discovered in 1979 by different groups as a cellular antigen associated with the large T viral antigen of the simian 40 tumor virus (Deleo et al., 1979; Linzer et al., 1979). Later, a murine p53 cDNA was cloned and this clone was found to immortalize cells in vitro or transform primary fibroblasts together with ras. These initial observation led to the mis-classification of p53 as a dominantly acting oncogene (Jenkins et al., 1984; Parada et al., 1984). However, subsequent studies showed that this particular mouse cDNA was mutant and that wild-type p53 was a tumor suppressor gene (Eliyahu et al., 1988; Hinds et al., 1989). Also it was showed that normal p53 gene product negatively regulates cell growth of some cells (Mowat et al., 1985) and abolishes the tumorigenic potential of a cell line in culture (Chen et al., 1985). Hovewer, growth advantage has been observed in the presence of wild-
type/mutant genotype as compared with the two wild-type possessing controls
(Srivastava et al., 1993) indicating that the mutant protein can act as a dominant negative by forming multimeric complexes with wild-type p53 gene product and inhibiting its normal role in a cell (Milner et a l, 1991).
During the last ten years, many observations from different laboratories have established the fact that p53 is the most frequently mutated gene in human cancer. The mutation spectra of p53 shows differences in frequency, distribution and nature (Figure
1.3.). Distribution of mutations in different exons is shown in figure 1.4. In this picture, it is clear that the percentage of missense mutations resulting in the inactive protein is relatively higher in the exons that span consensus DNA binding domain (82%) than
Figure 13.; Worldwide distribution of cancers and p53 mutation rates
W O RLDW tDE D IS T R IB L m O N OF C A N C E R S AND
p53 M U T A T IO N S
D E V E L O P IN G
C O U N TR IE S
D EVELO PED
C O U N TR IE S
SKIN
eOVo
those encoding the acidic transactivation domain and the basic carboxy terminal domain (Wang et al., 1997).
Figure 1.4. Distribution of p53 mutations in different exons
p53 mutations in exons 2-4 (N=140) Splice site 16% 29% p53 Mutations in exons 5-8 (N=4.077)
Splice site Del. &|ns.
2% nsense 6% Missense 82% p53 Mutations in exons 9-11 (N=83) Missense 35% Splice site 13%
Del. & Ins.
22%
Nonsense 30%
G:C-^ A:T base transitions represent about 40% of all p53 mutations in human cancers. These changes occur at CpG dinucleotides in about 60% of the cases and they seem to arise from spontaneous deamination of 5-methylcytosine, which yields thymine (Greenblatt et al., 1994). In HCC, the conversion of G;C·^ T:A is found to be much more common than any other base changes as shown in figure 1.5. (Soussi T., 1997). Moreover, this conversion was found to be a specific G-> T transversion of the third
base of codon 249, leading to a substitution of arginine to serine in a significant number of patients from southern Africa and the Qidong area in China (Bressac et al., 1991; Hsu et al., 1991). It was suggested that this mutation was associated with high aflatoxin B1 intake in food and may have contributed to the high incidence of HCC in these areas. This finding is also supported by in vitro studies in which p53 codon 249 was preferentially targeted to form adducts with aflatoxin B1 (Aigular et al., 1993; Figure 1.6.). It is important to note that five of the six mutation hotspots (Codons 175, 245, 248, 249, 273, and 282) in the p53 gene occur at CpG nucleotides. These hotspots encode arginines at sites that are essential for the maintenance of contact between the protein and its DNA consessus sequence: this contact in turn responsible for DNA binding and transactivation (Cho et al., 1994).
P53 protein was also found to complex with viral proteins (SV40 large T antigen, adenovirus ElB and HPV type 16 E6 protein) and such complexes of p53 were
Figure 1.5.: Comparison of distribution of base changes between all cancers and HCC "“t 35. 3U| 25., 204 tsi r~ toil '■! m HCC N=382
found to be inactive (reviewed by zur Hausen H., 1996). Thus, functional inactivations of p53 also appears to be frequent in cancers, as it will be discussed later in detail.
Figure 1.6. p53 hotspots in all cancers and in HCC.
1.3. Cellular functions of p53
Possible biological functions of p53 have been studied by different groups and the results published so far indicate multiple cellular functions such as the control of cell cycle checkpoints, genetic stability (Kastan et al., 1992) and the initiation of programmed cell death or apoptosis (Figure 1.7 ). All of these p53 functions are possibly related to its ability to act as a powerful tumor suppressor gene. Experiments show that initiation events which triggers the p53 response can be DNA damage, activated oncogenes or certain stress conditions. It is crucial to point out that p53
response generated by such signals can differ in different cell types or in the presence of different extracellular signals (Lane DP., 1992).
Figure 1.7. p53 response pathways
Following DNA damage, p53 is activated and it transactivates a number of downstream genes whose products contribute to the cellular response to DNA damage with diverse biological activities. The following genes are the most important p53 target genes: p21 (El-Diery et al., 1993), mdm2 (Wu et al., 1993), GADD45 (Kastan et al.,1992; Sun et al.,1995) , HIC (Vales et al.,1995), cyclin G (Okamoto et al.,1995; Zauberman et al.,1995), Bax (Miyashita et al.,1995), proliferating cell nuclear antigen (PCNA; Shivakumar et al.,1995), IGF-BP3 (Buckbinder et al., 1995), hMSH2 (Scherer et al., 1996) and BTG2 (Rouault et al., 1996). The products of these genes were shown to have a direct effect on cellular growth, DNA repair or DNA replication. p53 binds to
specific p53-responsive elements on either the promoter or intronic regions in these genes and these responsive elements are outlined in table 1.1.
Other candidates for the p53 response genes are TGF-a, thrombospondin-1, fas/APOl, Rb, EGF receptor, cyclin D and p53 itself. Other target genes will continue to be identified as the roles of p53 in cellular metabolism becomes more clear (Ko LJ. and Prives C.,1996).
Table l.L : p53-responsive elements of target genes '?pne:·
' •c '/· '
Position*.'. Sequences:
(Pii Pu Pii C A/T T/A G Py Py Py) (0-13 bp apart)
p21 2303 GAACATGTCC CAACATGTTC
GADD45 3832 AGACCTGCCC GGGCAAGCCT
Bax 488 TCACAAGTTA AGACAAGCCT
MCK 119 TGGCAAGCCT TGACATGGCC
Cyclin G 262 AGACCTGCCC GGGCAAGCCT
IGF-BP3 5064 (intron I) AAACAAGCCA CAACATGCTT
5983 (intron I) GGGCAAGACC TGCCAAGCCT
hMSH2 447 AGGCTAGTTT AAGTTTCCTT
MDM2 139 GGTCAAGTTG GGACACGTCC
BTG2 97 AGTCCGGGCA AGCCCGAGCA
* Position of the response sequence according to Genbank’s map positions
One of these downstream genes is p21, the CDK2 inhibitor (also known as universal CDK inhibitor) that inhibits the activity of cyclin-dependent kinases. Experimentally, a p53-dependent inhibition of cyclin E/CDK2 was observed in fibroblasts and this inhibition was shown to be mediated p21. Recently developed p21 null mice showed a normal developmental pattern but mouse embryo fibroblasts that lack p21 were partially deficient in their ability of G1 arrest in response to DNA damage. This observation is another confirmation of the importance o f p21 in G1
checkpoint. It has been implied that contribution of p53 into G1 checkpoint is to preserve the genetic stability. In the absence of p53, genomic instability results from checkpoint loss creating gene amplifications, aneuploidy and other chromosomal aberrations (Smith et al., 1995).
However, p21-independent cell cycle arrest also exists (Deng et al., 1995; Bmgarolas et al., 1995). Fibroblasts with elevated p53 expression also causes minor G2 anest. Furthermore wild-type p53 overexpression in a human ovarian cancer cell line resulted in a transient G2 delay (Vikhanskaya et al., 1994). So it has been suggested that in addition to G1 cell cycle arrest, p53 also participates G2 cell cycle checkpoint and length of this arrest duration is dependent on cell type (Kastan et al., 1991).
p53-dependent apoptosis was first detected in experiments using myeloid leukemic cell lines with overexpressed exogeneous wild-type p53. In these experiments, the cell viability was rapidly lost, in a manner characteristic of apoptosis (Yonish et al., 1991). From the reverse approach, thymocytes isolated from p53-deficient mice did not undergo apoptosis after ionizing radiation as compared with the normal thymocytes confirming the involvement of p53 in physiological apoptosis process (Lowe et al., 1993). Recently it was shown that expression of bax is induced in slow growing apoptotic tumors indicating the role of p53-induced bax gene (Yin et al., 1997). Furthermore tumour growth is accelerated and the apoptotic ratio drops by 50% in bax-deficient mice, suggesting the requirement of bax for a full p53-dependent response (Yin et al.,1997). Under conditions such as highly damaged nuclear DNA and absence of required survival factors, certain cell types are observed to go through p53 dependent programmed cell death with the possible function of elimination of unstable genomes
and inadequately-fed cells, diminishing the probability of having cancerous phenotype. Beside the involvement of Bax gene in the p53-dependent apoptosis, recently, it has been proposed that p85 protein, which is the regulatory subunit of pi 10 PI(3) kinase, is upregulated by p53 under oxidative stress conditions leading to cell death and this involvement is independent of PI(3)K (Yin et al., 1998).
A recent study utilized the oncogenic ras that was formerly shown to transform immortal rodent cells to a tumorigenic state and in this study it was found that the expression of oncogenic form of the ras in primary human or rodent cells resulted in a permanent G1 arrest, in which the accumulation of p53 and pl6 was observed. Also, disruption of either p53 or pl6 was shown to abolish the ras induced growth arrest, concluding that oncogenic ras provokes premature senescence in primary rodent and human cells in association with the induction of p53 and p i6. This suggests that besides other functions, p53 has an important role in the induction of the senescence program (Serrano et al., 1997).
Most of the experiments, performed to analyze the possible role of p53 in differentiation and development, were done using cells of the haemopoietic lineage. When wild-type p53 is overexpressed in early pre-B cell line, the cytoplasmic p. heavy chain and B-cell specific antigen which are the indicators of more mature stage are expressed (Shaulsky et al., 1991). Likewise, a Friend erythroleukemia cell line overexpressing wild-type p53 is observed to start expression of hemoglobin, a marker o f erythroid differentiation (Johnson et al., 1993). Together, these reports can be interpreted that p53 is involved in haemopoietic development. The mechanism may not be through a direct induction of differentiation but the differentiation could be
facilitated by the inhibitory action of p53 in cell cycle (Hu et al., 1995). It has been described that p53 knock-out mice shows a normal viable development; but in another experiment a fraction of the p53-deficient embryos displayed neural tube defects (Sah et al., 1995). Thus, p53 may also be involved in the development and differentiation independently of its ability to act as a tumor suppressor.
1.4. Biochemical characterization of the p53
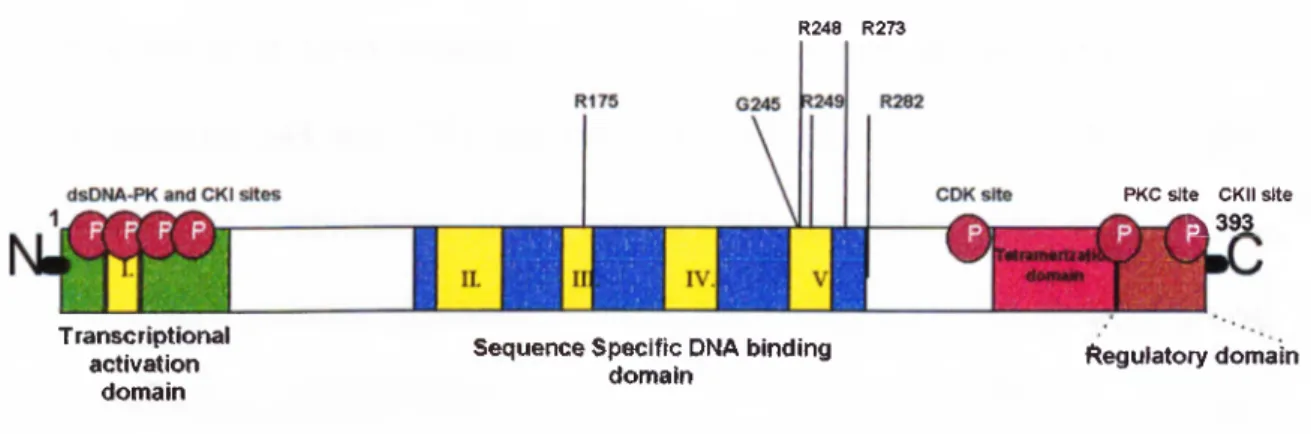
Human p53 gene covers 16-20 kb of DNA in chromosome 17pl3, having 11 exons. Exons between 2 and 11 encodes an mRNA of 2,2-2,5 kb that is translated into a protein of 53 kDa with 393 amino acids. The protein contains five distinct evolutionarily conserved boxes numbered as I-V and the residues between II to V are encoded by exons 4 to 9. Most of the p53 mutations occur in this region. p53 protein has several distinct structural domains (Figure 1.8.) one of which resides in N terminus
and contains acidic transcriptional activation domain that interacts with the
transcription initiation machinery. Next to transcriptional activation domain, there is a proline-rich region. This hydrophobic domain appears to be important for the maintaining the overall structural stability of p53 protein (Levine et al., 1991). Recently, this domain was shown to be involved in p53-mediated apoptosis (Ruaro et al., 1997). The central portion of p53 located between amino acids 120-290 is the DNA binding domain. This domain recognizes a specific DNA motif (5 - Pu Pu Pu C A/T T/A G Py Py Py) which is repeated on target genes and shown in table 1.l.(El-Deiry et al.,1992; Zambetti et al., 1992). Another charged basic domain through C-terminus was found to be essential for the tetramerization (Iwabuchi et al.,1993) and subsequent nuclear transport signal containing region resides between amino acids 316 and 325
(Shaulsky et al.,1990). At the very end of the carboxy-end a regulatory domain is found and this domain regulates the activation of the wild-type TP53. This last domain is absent in protein product of an alternatively spliced mRNA of p53 (Wolkowicz et al., 1995)
Figure 1.8.: Functional domains of TP53
R248 R273
T ranscriptionaf activation
domain
Sequence Specific DNA binding domain
PKC site CKII site
^393
Regulatory domain
Recent studies about the transcriptional activation and repression functions of p53 have revealed that the consensus p53 response element plays a crucial role. The genes which have this sequence are transcriptionally activated by p53 and the absence of the response element is thought to be sufficient for the repression. The key mechanism that mediates the activation/repression process involves TATA-binding protein (TBP). Experiments show that TBP interacts with both the amino and carboxy terminus o f p53 and it is proposed that this difference plays a switching role between p53-dependent transcriptional activation and repression of target genes (Horikoshi et al., 1995).
1.5. Inactivation and activation of p53
p53 function can be inactivated in several ways one of which is the mutation that occur on p53 gene in nearly 60% of all human cancers (Hollstein et al., 1991;
Greenblatt et al., 1994). In most cases, only the mutant allele is detected in tumor cells. Thus, the loss of wild type allele in most cases is followed with a mutation on the other allele. Vast majority of missense mutations are clustered in the sequences encoding the central region of the p53 protein. The analysis of p53 crystal structure and mutation distribution patterns has revealed that p53 mutational hotspots are on amino acid
residues involved in DNA binding. Two of them abolish the p53 DNA binding
function (residues 248 and 273) and the remaining four (175, 245, 249 and 282) interfere with the stabilization of the protein-DNA interaction (Cho et al., 1994). Analysis of p53 mutation databases showed that, with more that three thousand different mutations collected from the human tumor cell lines, different tumor types have distinct p53 mutation profile. These profiles are very helpful in understanding the cancer aethiology, clinical basis of tumorigenesis and functions of p53 domains.
Another mechanism for the loss of p53 function is the inactivation of the protein by viral proteins. p53 has been shown to form complexes with the SV40 large T antigen (Linzer DI. and Levine AJ..,1979), adenovirus type 5 ElB 58 kDa antigen (Samow et al., 1982; Zantema et al., 1985; Braithwaite et al., 1991) and the E6 protein of human papilloma virus type 16 (HPV-16; Wemess et al., 1990). The region o f p53 bound by large T antigen closely correlates with the conserved core domain and is contained within residues 94 to 293. This large T antigen-p53 complex inhibits p53 mediated transcriptional activation by inhibiting DNA binding as it is shown by in vitro experiments. Similarly ElB , one of the genes encoded by adenovirus, forms a complex with p53 and inhibits transcriptional activator function but binding o f this molecule to p53 does not prevent its DNA binding ability. As different from the E lB and large T
antigen, the association o f E6 protein with p53 targets it effectively for degradation through ubiquitin pathway, leading to a deficit of p53 activity for the control of normal cell proliferation. (Scheffner et al., 1990).
In addition to these abrogation-in-function states of p53 protein, deregulation of p53 activity by the overexpression of cellular proto-oncogene mdm-2 is reported and characterized by several groups (reviewed by Oliner JD., 1993; Picksley et al., 1993). Ill certain tumors (particularly sarcomas) with wild-type p53 the amplification of mdm- 2 gene was observed suggesting the alternative inactivation pathway of p53 protein. The mdm-2 gene was first identified originally by virtue of its amplification in transformed mouse lines. Overproduction of this protein was shown to be tumorigenic (Fakkarzadeh et al., 1991). Interestingly, mdm-2 gene is also found to be transcriptionally activated by p53 protein and it is proposed that p53 function is controlled by p53/Mdm-2 autoregulatory feedback loop where p53 stimulates mdm-2 expression and its own function is impaired by being sequestered in an inactive p53- Mdm-2 complex (Barak et al., 1993; Wu et al., 1993). The main inhibitory role of rndm-2 is its ability to bind to the transcriptional activation domain of p53 and to block the p53-target gene activation. It was recently reported that mdm-2 also promotes the rapid degradation of p53 (Haupt et al.,1997).
p53 protein is extensively modified by phosphorylation (Meek et al., 1994).The serine/threonine phosphorylations are clustered into two distinct domains at the N and C-termini of the protein and the enzymes that are responsible for this process in vitro are found to be DNA dependent protein kinase (DNA-PK), casein kinase I-like enzyme and casein kinase Il-like enzyme (Fiscella et al.,1993).
In most cells, wild-type p53 is present in extremely low quantities and has a short half-life (6-20 minutes). Ionizing radiation or UV light and alkylating agents induce p53 and the presence of DNA strand breaks is critical for this induction (Nelson atid Kastan 1994). It is generally agreed that the inductive response is post- transcriptional (Kastan et al., 1991; reviewed by Ko and Prives, 1996).
Also, recently identified factor ref-1, previously named as redox/repair protein, wa.s found to be an extremely potent activator of the latent p53 protein. It was further stated that ref-1 stimulates p53 both in redox-dependent and redox independent manner in vivo and in vitro suggesting that this factor may play a critical sensor role for the genotoxic stress that can activate latent p53 (Jayaraman et al., 1997).
Vaziri et al. investigated the possible relationship between the telomere loss and the p53 activity and they concluded that in ataxia-telengiectasia fibroblasts which show accelerated telomere loss and premature senescence when compared with normal fibroblasts also shows increased specific activity of p53. It has further been shown that p53 can associate with PARP (poly ADP-ribose polymerase) and inhibition of PARP activity leads to abrogation of p21AVAFl and mdm2 expression in response to DNA damage. So p53 can not only be activated in response to DNA damage but also in response to telomere shortening (Vaziri et al., 1997).
In summary, p53 protein is transcriptional activator which upregulates the functions of several genes involved in the control of cellular growth. Under normal conditions p53 has a short half-life. Following DNA damage (X-rays, DNA alkylating agents etc.) p53 protein is stabilized and accumulates in cells leading to its transcriptional activation. One of the p53 target genes, p21 encodes an inhibitor of
cyclin-dependent kinases, inducing cell cycle arrest at both G1 and G2/M phases. p53 induces apoptosis in certain cells either directly or by the induction of bax expression. In tumor cells, this role of p53 is lost either by mutational inactivation or functional inactivation.
1.8. Identification and characterization of p73 gene
p73 gene is a newly discovered gene that shows considerable homology with p'fl tumor suppressor gene (Kaghad et al.,1997). Interestingly, the gene was identified while pursuing research into growth factors called cytokines. The group was performing a hybridization screen of a COS cell cDNA library using degenerate oligonucleotides corresponding to IRS-1 binding domains. Coding sequence gave no considerable homology with IRS-1 binding domain sequence but later it was found that the molecule shows homology with p53 in both aminoacid and DNA sequence (figure
1.9.),
For almost 20 years, many researchers were searching for the possible homologs of p53 since many oncogenes and tumor suppressor genes found so far exist as a family like myc (c-myc, N-myc and L-myc), ras (H-ras, K-ras and N-ras) and Rb (Rb, p i05 and p i 30) family of genes. Suprisingly all the low stringent hybidization and degenerate PCR techniques gave no positive results. This negative results led people to think that p53 function was unique and there was no redundant genes. The discovery of p73 demonstrated that, p53, like many other genes, belong to a family which shows structural and probably functional similarities (Oren M., 1997).
Figure 1.9.: Homology between p73a and p53
p53 MAj^--TATS|D GGT||EH^S sIePDSTYFD LPQSSRG||^E WGGTDSSi p73 m e e pU d p s v e pIl SQE^SIsdM k lIIPE-j LSPLPSQA!
v f h|e g m t t s v m a|f n l l s s tm|q m s s r a a s|s|y t|eh| |sv|t h s|y a
DLMI---SPD DIElWFTEDP Gp|eAPRMPE a|p|v a1a p| |pt|a-aIaP
QHSTFDTMS P A P V I ^ T D YP|PHH|EVT iQQlsiAKiA |w|y s|l|k| ^PL--- SSSViiQKT YqIsYgIrLG i L H i G i ^ V IcMsiAiNi M F ^ L U r c i VlLWlDSTil » R v i l i A I H oSOHmIeI |ELG
SHiE-I
DFNEGQSii ASBLIRI CSDSDGLSI PQJiKiRl |P|QiiTEF| LRVEiLMRlxi iFRHitiM^ IpIe^ S DcI m i J l i i n U M R D i Q V ^ R H |f c iil^ A C | M M TiiTiiD s W / i l c i№
KAr^DHY| EQQALNESSA KNGAASl^F KQSPPAVPAL GAGvB|RRHC FArEiENLl KKGEPHHELP --PGST^^L PNNTSSSPQ- ---pB|kPL-I
EDTYY||fivi ^ N ^ I L M K |k e s|M|m: GEYFtH iI » i « M F R E I N E A B Ik; EL VPQPLVDSYi QQQQLIqRPS DA QAGKEPGGSI AHSSh|kSKK HL|r
I
PPISTlRHKK I— iFiTElPyGPV ISPiNlVPllGMNKLPSVNQL VGQPPPHSSA ATPNLGPVGP DSD 3„
GMLNNHGHAV PANGEMSSSH SAQSMVSGSH CTPPPPYHAD PSLVSF’LTGL
GCPNCIEYFT SQGLQSIYHL QNLTIEDLGA LKIPEQYRMT IWRLGQDLKQ GHDYSTAQQL LRSSNAATIS IGGSGELQRQ RVMEAVHFRV RHTITIPNRG GPGGGPDEWA DFGFDLPDCK ARKQPIKEEF TEAEIH
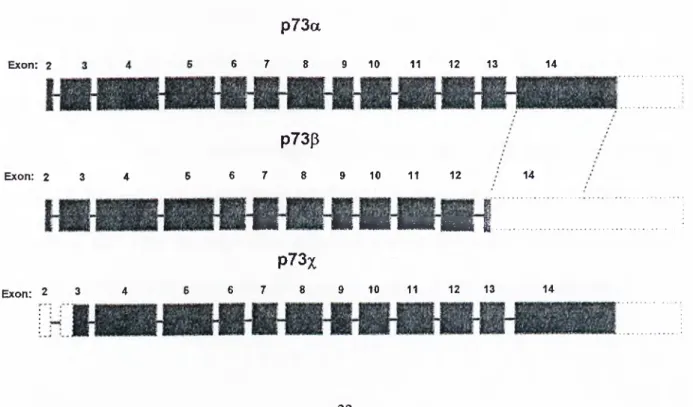
p73 gene shows similarities and differences with p53 tumor suppressor gene in several aspects. It is localized in chromosome lp36 and has 14 exons. It has two splicing variants differing at their C termini, termed as p73a and p73p (lacks 96 nucleotides corresponding to exon 13) respectively. It is also reported that there exists a third form of p73 protein resulting from the alternative start codon at the N terminus. P73a form codes for a protein of 636 amino acids long whereas |3 form , due to exon 13 deletion, yields a polypeptide with 499 amino acids (Figure 1.10.). On the other hand, p53 gene resides in short arm of chromosome 17. Although they are mapped to different chromosomes, the organization of these two genes are similar in exonic structures and coding / non-coding parts (In both, exon 1 is non-coding e.g.). Since p73 has a longer ORF, the resulting transcript sizes of two forms are 4.4 kb and 2.9 kb whereas p53 has a transcript size of 2.5 kb.
Figure 1.10.: p73 variants.
p73a
1.7. Functional and structural similarities between p53 and p73
Exon: 2 6 7 8 9 10 11 12 13 14 p73p Exon: 2 3 4 14 Exon: 2 3 4 6 6 7 8 9 10 11 12 I BhI H i H№ HWK HHI i .. p73x 6 6 7 8 9 10 11 12 13 14
According to the protein product, p73a and p73p forms, though they are longer than p53, resemble the latter in three regions; N terminus, which is responsible for transcriptional activation, is 29%; DNA binding domains are 63% and oligomerization domain is 38% identical. Furthermore, the amino acid residues that are frequently found to be mutated in variety of cancer types (R175, G245, R248, R249, R273 and R282 which are also shown in purple in figure 1.9.) are also conserved in p73. No significant homology was reported between the C-terminal domain of mammalian p53 and p73 indicating that this unique region might be responsible for the interaction with other factors that cooperate with p73 or regulate its function(s). However, this C terminal region of p73a form is similar to invertebrate p53 homologs and this opens another debate about the evolution pattern of p53 gene. It has now been speculated that p53 may have evolved from a p73-like gene.
Also, p53 and p73P (but not the p73a) have been shown to form homo oligomers in yeast two-hybrid assays. In these experiments it has also been observed that p73P showed significant but relatively weak interactions with p53 but the actual existance o f these mixed oligomers in vivo still needs to be determined.
Another important finding about p73 is that, it transcriptionally activates one o f the main p53 target genes p21AVAFl in transient-transfection experiments. Interestingly, when the Arg residue of p73 at position 292 (which is analogous to Arg residue at position 273 of human p53 gene) is mutated to His, this p73-dependent
activation of p21AVAFl is abolished. Arg 273 in p53 has been shown to be mutated in variety of cancer types and this change abrogates the ability of p53 to act as a transcriptional activator (Kaghad et al., 1997).
Although overexpressed p73 has been shown to induce apoptosis, the mechanism is not well understood. The analysis of apoptosis-asociated genes such as bax and Fas/Apol are needed to clarify the role of p73 in apoptotic response (lost et al.,
1997).
1.8. Aim of the project
Molecular pathogenesis of HCC remains poorly understood. High frequency of p53 mutations in HCC cells and possible functional inactivation by Hbx o f HBV virus suggest that one major pathway of hepatocellular carcinogenesis is the inactivation of tiepatocellular functions mediated by p53. However, p53 is found to be mutated in 30% o f these tumors. The malignant transformation of other HCCs might be due to gene aberrations other than p53 mutations. The chromosome location of p73 (lp36) was known to be frequently altered in HCC. This is why we decided to study whether HCC cells display aberrations of p73 gene. If so, this would help to find another pathway of malignant transformation of HCC mediated by the loss of p73 function. Before starting any functional studies of p73 in hepatocytes and HCC cells, it was important to know whether p73 gene expression is lost or modified by genetic mutation. We decided to study first the expression of p73 in HCC cells and then the primary tumors for possible mutations in p73 gene by using non-radioactive heteroduplex test, radioactive SSCP analysis, restriction enzyme analysis and DNA sequencing.
2-MATERIALS AND METHODS 2.1. MATERIALS
2.1.1. Cell lines and prim ary tum or samples
The following cell lines were used in this study; HT29 (Huet et al., 1987), Chang (Chang RS., 1954), WRL68 (Apostolov K., U.S. Pat.:3,935,066 ), Mahlavu (Alexander JJ., 1984), Hep3B (Aden et al., 1979), Hep3B-TR (Hasegawa et al., 1995), HepG2 (Aden et al., 1979), FOCUS (He et al., 1984) and PLC/PRF/5 (Alexander et al., 1976). All cell lines were maintained in Dulbecco’s modified Eagle’s medium (DMEM) supplemented with 10% fetal calf serum, glutamine (2 mM), non-essential amino acids, penicillin and streptomycin. All cell lines were negative for mycoplasma contamination except PLC/PRF/5 and Mahlavu.
DNA samples from primary HCCs have also been studied. These samples have been collected from different geographical locations in the world. They have been previously studied for their status of p53 gene and HBV DNA sequences. The data on patients (age, sex, viral markers etc.) was also known (Unsal et al., 1994).
2.1.1. Chemicals
NAME: PRODUCER:
Agarose Prona basica
Ammonium persulfate Carlo Erba
Boric acid Sigma
Bromo phenol blue Sigma
DNA ladder, 1 kb MBI Fermentas
MgCl^ (25 mM) Promega
Reverse transcription lOX buffer Promega
dNTP mixture (10 mM) Promega
Rec. Rnasin© ribonucléase inhibitor Promega
AMV reverse transcriptase Promega
OIigo(dT)i5 Primer Promega
DNA ladder, 100 bp MBI Fermentas
dNTP mix (10 mM) MBI Fermentas
Dulbecco’s PBS Biological
EDTA Sigma
Ethidium bromide Sigma
Formamide Cario Erba
Formaldehyde Cario Erba
Gel extraction kit Qiagen
Glycerol Cario Erba
Guanidium thiocyanate Merck
L-Glutamine Biochrom-Seromed
Non-essential amino acids Biological
Nusieve agarose FMC
""P dCTP Izotop
Phenol Merck
Sodium acetate Carlo Erba
Sodium chloride Carlo Erba
Sodium Hydroxide Carlo Erba
Taq DNA Polymerase MBI Fermentas
lE M E D Sigma
Trypsin-EDTA Sigma
Xylene cyanol FF Sigma
2.1.3. Stock solutions and buffers
SOLUTION METHOD OF PREPARATION
For Agarose Gel Electrophoresis:
5X formaldehyde gel running buffer Add 10 ml of 2M sodium acetate and 10.3 gr of MOPS into 390 ml of DEPC-treated water. Dissolve and adjust the pH to 7.0 with sodium hydroxide. Add 5 ml of 0.5M EDTA (DEPC- treated) pH:8.0 and fill up to 500 ml with DEPC-water.
Add 186.1 g of disodium
ethylenediaminetetraacetate- 2H2O to 800 ml of dHjO. Stir vigorously on a magnetic stirrer. Adjust the pH to 8.0 with NaOH.
Formaldehyde gel loading buffer
TBE lOX
Ethidium Bromide (10 mg/ml) Add 1 g of ethidium bromide to 100 ml of
dHoO. Stir on a magnetic stirrer for several hours to ensure that the dye has dissolved. Wrap the container in aluminum foil or transfer the solution to a dark bottle and store at room temperature.
Prepare appropriate amount that contains 50% Glycerol, 1 mMEDTA (pH;8.0), 0.25% Brom Phenol Blue and 0.25% Xylene cyanol. Dissolve 108 g Iris base and 55 g of Boric acid in 800 ml dH20. Then add 40 ml of 0.5 M EDTA and adjust volume to 1 liter with dH20.
For Polyacrylamide Gel Electrophoresis:
Acrylamide 30% Dissolve 29 g of acrylamide and 1 g of
N,N’-methylenebisacrylamide in a total volume of 60 ml of dHjO. Heat the solution to 37°C to dissolve the chemicals. Adjust the volume to 100 ml with dHjO. Check that the Ph is 7.0 or less and sterilize the solution by filtration. Store the solution in dark bottles at room temperature.
Acrylamide 50%
SSCP Loading buffer
Ammonium persulfate 10%
For RNA Extraction;
Dénaturation Solution (stock)
Dissolve 49.5 g of acrylamide and 0.5 g of N,N’-methylenebisacrylamide in a total
volume of 60 ml of dH20. Heat the solution to 37°C to dissolve the chemicals. Adjust the volume to 100 ml with dHjO. Check that the Ph is 7.0 or less and sterilize the solution by filtration. Store the solution in dark bottles at room temperature.
In an 50 ml falcon tube add the following in an appropriate volume; Formamide 95% (v/v), bromophenol blue 0,01 (w/v) and NaOH (final cone. 10 mM). Store at -20 °C. For fresh use: Dissolve 0.1 g of ammonium persulfate with 1 ml dH2 0.
Prepare a stock solution by dissolving 250 g guanidium thiocyanate in a solution of 293 ml dH20, 17.6 ml of 0.75 M sodium citrate, pH:7.0, and 26.4 ml of 10% Sarkosyl at 60°C to 65°C with stirring. The stock solution can be stored up to 3 moths at room temperature.
Dénaturation Solution (working)
Phenol, water-saturated
Sodium acetate 2M
Sodium dodecyl sulfate 10% (SDS)
Prepare working solution by adding 0.35 ml of 2-ME per 50 ml of stock solution. The working denaturing solution can be sotred 1 month at room temperature.
Dissolve 100 g phenol crystals in dH^O at 60°C to 65°C. Aspire the upper water phase and store up to 1 month at 4°C
Add 16.42 g of sodium acetate (anhydrous) to 40 ml dHjO and 35 ml of glacial acetic acid. Adjust solution to pH; 4.0 with glacial acetic acid and the final volume to 100 ml with dH20. The solution is 2 M with respect to the sodium ions.
Dissolve 100 g of electrophoresis-grade SDS in 900 ml of dHjO. Heat to 68°C to assist dissolution. Adjust the pH to 7.2 by adding a few drops of concentrated HCl. Adjust volume to 1 liter with dHjO.
2.1.4. Plastics aud disposables
1.5 ml Eppendorf tubes Eppendorf
0.2 ml PCR tubes 10 ul white pipette tips 200-1000 ul blue pipette tips 5-200 ul yellow pipette tips Falcon tubes (50 ml)
Falcon tubes (15 ml) Gloves
Parafllm
Sterile plastic pipettes Bottle filter system (500 ml)
75 cm^ straight neck flask
162 cm^ straight neck flask 225 cm^ straight neck flask
Perkin Elmer LP LP LP Costar Costar Beybi plastics
American National Can LP Costar Costar Costar Costar 2.1.5. Apparatus APPARATUS: PRODUCER: <1>40 pH meter Axiovert 25 Microscope Biofuge p ic o bench centrifuge CS-15R Centrifuge DU640 Spectrophotometer Beckman Zeiss Heraeus instruments Beckman Beckman
EC175 Adjustable vertical gel system E-C apparatus corporation
EC250-90 Power supply E-C apparatus corporation
EC350 Midicell Electrophoretic gel system E-C apparatus corporation
EC370M Minicell Electrophoretic gel system E-C apparatus corporation
Geneamp PCR system 9600 thermal cycler Perkin-Elmer
Locator 6 p lu s Liquid nitrogen tank Thermolyne
Micro chef microwave Moulinex
Mirak magmetic stirrer Thermolyne
Oligo lOOOM DNA synthesizer Beckman
Pipette 1000 ul Eppendorf
Pipette 20 ul Eppendorf
Pipette 200 ul Eppendorf
Slab gel drier SGD2000 Savant
SpeedVac SCI 10 Savant
Tempette™ TE-8D water bath Techne
The butterfly Cell House 170 Heto
2.2. METHODS
2.2.1. Growth Medium Preparation
DMEM is prepared from lOX concentrated stock solution as follows:
800 ml dHjO
49.3 ml Sodium bicarbonate 7.5% (pH:7.3) fill up to 1 liter with dH ,0
At that stage, DMEM solution can be stored at 4°C. Add:
10 ml non-essential amino acids
10 ml penicillin/streptomycin
10 ml L-glutamine (200 mM)
100 ml Fetal calf serum
Sterilize the solution by filtration and store at +4°C. DMEM solution at that state can be used up to 30 days.
2.2.2.Cyropreservation of stock cells and thawing frozen stock of cells About 1-2x10® of cells were recovered by 10 ml of DMEM after trypsin treatment. They were then spinned at 1500 rpm for 5 minutes. After washing with 10 ml of PBS, cells were again spirmed down at 1500 rpm for 5 minutes. 2 ml of F- medium containing 80% DMEM, 10% DMSO and 20% FCS were added and suspension was transferred into freezing vials. Cells were stored at -70 °C for one day and then transferred into liquid nitrogen for cyropreservation.
In order to achieve rapid thawing, vials containing frozen cells were transferred directly to a 37°C water bath without submerging the cap. Once thawed, vials were then sterilized by swapping the outer surface with 70% ethanol. The contents were transferred into a sterile plate containing pre-warmed, fresh growth medium with the help of a pipette and plated into small flasks. Thawed cells were examined daily using a microscope and subcultured as soon as confluency was reached.
2.2.3. Subculturing of cells
Old medium was removed by the help of an aspirator and cells were washed with 1-3 ml of PBS. In order to detach the cells from the plate, 0.5-1 ml of trypsin was added onto the plate and the plate was incubated at 37 °C for 2-3 minutes to quicken the detachment. Cells were then examined under microscope to make sure that all the cells were efficiently detached. DMEM was added to a new plate that was sterile and labeled (8 ml for 75 cm^ plates, 25 ml for 225 cm^ plates). 2-3 ml of DMEM was placed over the detached cells. After the cells were properly suspended with newly-added medium, they were removed, and placed into the new plate.
2.2.4. Total RNA Preparation
Guanidium thiocyanate total RNA isolation method was used (Adapted from Chomczynski P., Sacchi N., 1987). The procedure is as follows;
• Cells were washed with 10 ml PBS two times • 4 ml of dénaturation solution was added • Cell lysis is aided by mixing with pipette.
• Lysate was then transferred into 15 ml sterile tube • 0.1 volume of 2M sodium acetate was added • Mixture was aliquoted into four tubes ( 4 X 1 ml) • 1 ml of water-saturated phenol was added and mixed
• 0.2 volume of 49:1 chloroform/isoamyl alcohol was added and mixed • Tubes were stored at 4°C for 15 minutes, being resuspended frequently
• Tubes were then centrifuged at 10.000 rpm for 15 minutes at 4°C. • Aqueous phase was taken to a fresh tube
• 1 volume of 100% isopropanol was added and mixture was stored at -20°C overnight
• Samples were centrifuged at 10.000 rpm for 10 minutes at 4°C
• Supernatant was discarded, pellet was dissolved in 300 ul of denaturation solution
• Precipitation was carried out using 300 ul 100% isopropanol • Samples were stored again at -20°C overnight
• Tubes were centrifuged at 10.000 rpm for 15 minutes at 4°C
• After discarding the supernatant, pellet was dissolved in 75% EtOH • Tubes were mixed and left for 10-15 minutes at room temperature • They were then centrifuged again at 10.000 rpm for 15 minutes at 4°C • Pellet was dried with Speedvac
• Finally, pellet was resuspended in 100-200 ul DEPC-treated water
• Samples were aliquoted and were stored at -70°C by adding 1 ml of EtOH and 10 ul of sodium acetate.
2.2.5. Electrophoresis of RNA
Electrophoresis of RNA was performed according to the procedure from Molecular Cloning (Sambrook et al., 1989) in which total RNA was loaded and run on the agarose gel containing formaldehyde. This method was adapted from those of Lehrach et al. (1977), Goldberg (1980) and Seed (1982).
2.2.5.1. Formaldehyde-containing 1% Agarose Gel
After the casting step, 11 ml of 5X formaldehyde gel running buffer, 35 ml of DEPC-treated water and 0.5 g of agarose were added into a beaker and the solution was heated in microwave oven until the agarose was melted completely. When the solution cooled down to approximately 65°C, 10 ml of formaldehyde was added and the mixture was poured into the casted apparatus.
2.2.5.2. Sample Preparation
Extracted total RNAs were diluted to 5ug/ul with DEPC-treated water. Into fresh tubes:
4.5 ul RNA
2.0 ul 5X formaldehyde gel running buffer
3.5 ul formaldehyde
10.0 ul formamide
were added and the tubes were incubated at 65°C for 15 minutes for the dénaturation of RNA, chilled on ice for 5 minutes and instantly centrifuged . Samples were then loaded into the corresponding wells on the gel with the addition of 2.0 ul formaldehyde gel loading buffer.
Electrophoresis was then carried out at 70 V for 2 hours at room temperature.
2.2.5.3. Staining and Visualization
After the run, the gel was put into the 0.1 M ammonium acetate containing 0.5 ug/ml ethidium bromide for 30-45 minutes. Then the gel was destained with DEPC-treated water for at least 30 minutes and the gel was visualized under UV light.
2.2.6. cDNA Preparation
For cDNA preparation, Promega Reverse Transcription System was used. According to the original protocol, into each tube:
1 Ug RNA
4 u l MgCl2(25mM)
2 u l Reverse transcription 1 OX buffer
2 u l dNTP mixture (10 mM)
0.5 ul Recombinant Rnasin© Ribonucléase Inhibitor
15u AMV Reverse Transcriptase
0.5 ug 01igo(dT),5 Primer
and nuclease-free water was added to a final volume of 20 ul.
The reaction was incubated at 42°C for 15 minutes and the AMV Reverse transcriptase was inactivated by heating the sample at 99°C for 5 minutes followed by a 5 minute incubation at 0-5°C.
2.2.7. PCR Amplifîcation
The PCR which was invented by Kary Mullis (Mullis et al., 1987) is an in vitro method for enzymatic synthesis of specific DNA sequences, using two oligonucleotide primers that hybridize to opposite strands and flank the region of interest in the target DNA. A repetitive series of cycles involving template dénaturation, primer annealing and the extension of the annealed primers by DNA polymerase results in the exponential accumulation of a specific fragment whose termini are defined by the 5’ ends of the primers.
In this study, in order to amplify the p73 cDNA or gene fragments this method was applied by using different sets of primers given in table 2.1. and 2.3.
A standard 50 ul reaction set up in a 0.2 ml PCR tube with the amounts listed below:
Primers (10 pmol/ul): 1 ul of each primer (reverse and forward)
dNTPs (10 nM): 1 ul
Buffer; 5 ul from the lOX stock
MgCl2 (25 mM); 3 ul
Template DNA: 1 ul of cDNA
Enzyme: 3 unit of Taq Polymerase enyzme
MiliQ water; adjusted to the final volume of 50 ul.
In order to amplify the desired region, a temperature profile was set to be:
Initial dénaturation: 95 °C, 3 minutes
For 30 cycles:
Dénaturation; 95 °C, 30 seconds.
Primer annealing; 60 °C, 30 seconds.
Primer Extension: 72 °C, 30 seconds.
For final extension: 72 °C, 10 minutes
Termination: 4°C
2.2.8. Agarose Gel Electrophoresis
To check the amplification status, the amplified fragments are tested with the Agarose Gel Electrophoresis (AGE) technique. In this technique, within the linearly