Vol. 134 (2018) ACTA PHYSICA POLONICA A No. 1
Special Issue of the 7th International Advances in Applied Physics and Materials Science (APMAS 2017)
Determination of Ambient Turbulence Intensities
for Stratified Atmospheric Flow
H. Yazicioglu
a, T. Kara
band M. Ozbek
b,∗aTechnical University of Denmark, Department of Wind Energy, Denmark
bIstanbul Bilgi University, Faculty of Engineering and Natural Sciences, 34060 Istanbul, Turkey The purpose of this study is to develop a numerical methodology which will allow the user to generate ambient turbulence intensities with respect to ambient wind speed for various flow conditions over completely flat terrain. The wind characteristics to be used in the analyses will be directly acquired by wind turbine sensors and mea-surement tower. The main objective of the work is to show that ambient and wake turbulence levels can be well presented with the developed methodology. The time resolution can be easily adjusted by the user. The developed framework has been validated with the nacelle and rotor effective wind speed model based turbulence intensity levels for all defined atmospheric stratification conditions. It is clear that the wake propagation is stimulated quite accurately and dissipation of the wake depends on the wake model in terms of deficit. The results have shown very good consistency with various ambient conditions.
DOI:10.12693/APhysPolA.134.451
PACS/topics: ambient and wake turbulence intensity, flow over flat terrain, atmospheric stratification, wake prop-agation modeling
1. Introduction
Performance of a wind turbine is highly dependent on the ambient turbulence intensity level which varies with the atmospheric boundary layer. Diurnal cycle character-izes the dominant source of atmospheric turbulence and is mainly divided into three basic regimes such as convec-tive, stable, and neutral. These regimes are highly influ-enced by instantaneous temperature profile. The sun, as the source of uprising heat, principally drives wind char-acteristics by enhancing the length of atmospheric eddies and increasing the turbulence.
The wake zone is the region of disturbed flow down-stream of the rotor, caused by the interaction between the turbine and the incoming flow. This region is charac-terized by rotor loading and atmospheric boundary layer and mainly divided into three sub-regions as near, in-termediate, and far wake regions. Flow characteristics vary enormously within each region. In near-wake re-gion, the flow is excited by the rotor characteristics, thus turbulence intensity increases with gradually increasing velocity deficit. Turbulent mixing begins in intermediate-wake region and it keeps the turbulence intensity in cer-tain range and velocity deficit begins to decrease. Flow becomes less dependent in further downstream sections since far-wake region characterizes the wind where flow characteristics are only influenced by the total loading acting on the rotor and atmospheric large eddies by ne-glecting geographical features (e.g. complex terrain and roughness heights).
∗corresponding author; e-mail: [email protected]
In literature, many engineering models exist to predict induced wind speed at specific downstream positions for neutrally stratified flow conditions [1, 2]. Extensions of the models have been done to cover the entire stratifi-cation conditions [3, 4]. The most commonly used wake models use wake decay coefficient to account for ambient turbulence intensity. This coefficient is taken as constant depending on environment and it is taken as 0.075 for onshore projects.
Dynamic wake meandering model is developed by Larsen et al. [5] that is physically based on wake me-andering phenomenon. Its present version is limited to single wake situations. The model is basically that wake transportation in atmospheric boundary layer (ABL) is driven by large scale turbulence components except hor-izontal part. It requires wake deficit, the stochastic wake meandering process, and the added wake turbulence as a parameter.
According to study of Larsen and Vincent [6], the low frequency mesoscale part has the same behavior in both onshore and offshore sites. Further, the low frequency part of the spectrum does not depend on stability or the average wind speed. Primary analysis of wake sit-uation for very large wind farms accounting neighboring wind farms are recently presented by using the Jensen wake model [7]. Motivation of such analysis was encour-aged due to external power losses in such a large wind turbine clusters. It is found that the model underesti-mates wake losses dramatically for certain turbine array, although it was compensated by considering high ambi-ent turbulence intensities. Unfortunately, stability clas-sification has not been applied to this site hence a clear conclusion cannot be made.
Ishihara et al. [2] developed an analytical model that is taking the impact of turbulence (both the ambient turbulence and the mechanically generated turbulence)
452 H. Yazicioglu, T. Kara, M. Ozbek on the wake recovery rate. The model assumes that wake
recovery rate is constant. It predicts high rate of wake recovery when the thrust coefficient is high either ambi-ent turbulence intensity or mechanically generated tur-bulence is large.
In the present work, results of developed numerical methodology is discussed. Larsen and Ishihara wake models have been used to determine the ambient tur-bulence intensities and to characterize the wake deficits as function of atmospheric stratification with respect to ambient wind speed for completely flat terrain where is located in northern Netherlands.
2. Methodology
Measurements have been provided from Energy Re-search Center of the Netherlands (ECN) test site and part of the site is drawn in Fig. 1. The test data has been acquired on a 2.5 MW–80 m diameter wind turbine and consists of 32 Hz resolution SCADA measurements on Nacelle based sensors and 4 Hz resolution met mast mea-surements. The entire dataset first was averaged to 4 Hz resolution for equal time increments. Measurements are binned to equal ambient conditions for estimation ambi-ent turbulence intensities regarding to stability classes.
Fig. 1. The layout of ECN test site. T2 is the pro-vided wind turbine and square represents the location of measurement tower (MM).
The classification of stratification can be done by sev-eral ways [8, 9] and these models classify the stability based on temperature and wind speed measurements at different heights. However, classification can also be done by wind shear coefficient. According to Wharton and Lundquist [10] different range of wind shear coefficients represent stability cases as shown in Table I.
In present study, three sets of shear coefficient are cal-culated and their occurrence rates are shown with respect to each other in Fig. 2.
Three different sets of coefficients result with varying occurrence rates. However, only third shear coefficient is considered for the classification. Main reason behind this is that the position of the met-mast is at wake of
TABLE I Stability classification according to Wharton and Lundquist [10]
Stability class Wind shear Turbulence strong stable (SS) α > 0.3 lowest stable (S) 0.2 <α <0.3 low neutral (N) 0.1 <α <0.2 moderate convective (C) 0.0 <α <0.1 high strongly convective (SC) α < 0.0 highest
Fig. 2. Frequency of the stability classification within a day based on three sets of shear coefficient. α1, α2
and α3 are calculated respectively by 80 m to 108 m,
52 m to 80 m, and 52 m to 108 m heights.
wind turbine for certain wind direction range and 80 m corresponds to hub height, thus it constantly measures the bottom of the single Gaussian shaped wake profile when meandering of the wake center is neglected. Hence, shear profile in such wake situation will always result with negative coefficient sets, therefore the shear coefficient is based on heights from 52 m to 108 m for stability classes. Larsen [1] and Ishihara [2] wake models are imple-mented in the framework to estimate wake deficit at met-mast location. Further readings can be done for model descriptions. These models require ambient turbulence intensity as an input parameter beside wind turbine spe-cific ones. Nacelle and met-mast measurements have been binned to represent each wind speed bin for spe-cific stability class under certain wind direction. Further, wake models have been iterated until the condition is met resulting with ambient turbulence intensity for each sta-bility class as a function of wind speed.
3. Results
Entire data set has been evaluated for appropriate wind direction and speed bins within firstly separated stability class bins. Measurements have been evaluated for wind direction range of 28±10◦ where interested
re-gion is defined within since met-mast measures the wake characteristics in this range, since instruments are
per-Determination of Ambient Turbulence Intensities for Stratified Atmospheric Flow 453 fectly aligned for met-mast to stand in the wake of test
turbine. In order to neglect influence of dynamic wake meandering, wind direction range of ±10◦is selected and
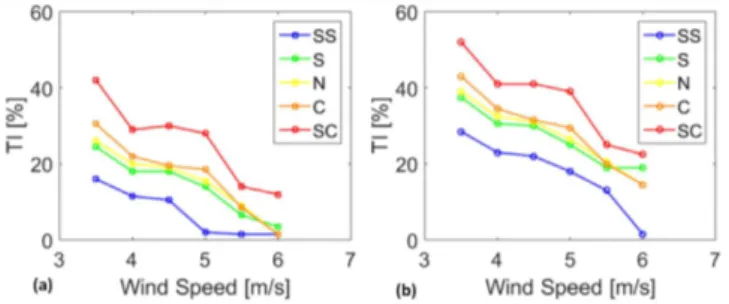
averaged with over the frequency domain. Latter, third binning operation is done for each available wind speed bins. Unfortunately, presented dataset has been recorded in 1 day, while hence higher wind speeds were not avail-able for the specific wind direction. Highest TI is found in strong convective, whereas lowest TI has been estimated to be in strong stable condition. Yet, closer relations have been estimated in stable, neutral, and convective conditions as in the literature [11].
4. Discussion
Future investigations should extend the content of the study for evaluating the ambient and wake conditions over higher wind speed ranges. Lower wind speed bins are much representative of the ambient and wake turbulence intensities [4] due to weaker flow perturbations on higher wind speeds. In this study, as expected highest TI lev-els correspond to strong convective condition due to high temperature difference produced by the heating of the sun. Both wake models estimate the ambient turbulence intensities within a certain range due to their fundamen-tal assumptions which are explained in model descrip-tions. The Ishihara wake model includes its own wake added turbulence model and it slightly overestimates the ambient levels due to its formulation. Consequently, around 10% of discrepancy occurs for each wake model estimation compared to each other as shown in Fig. 3.
Fig. 3. Estimated ambient turbulence intensities for classified stability bins: (a) Larsen wake model, (b) Ishi-hara wake model.
Main limitation related to the validation of the proposed model is lack of sufficiently long measurement periods. Unfortunately, only one day while measure-ments are not enough to verify the model for yearly changes due to changing characteristics of mean flow within a year. Another limitation of the study is absence of unaffected met-mast near assessed site for certain wind direction, temperature, pressure, humidity,
and ambient turbulence intensity measurements at multi-ple heights. This will provide for further stability calcula-tions and can be compared with shear calculated stability conditions.
5. Conclusion
In present study, it is shown that five main stabil-ity classes can be determined using calculated shear co-efficient at different met-mast locations. Consistency of such classification can only be explained by fur-ther measurements of potential temperature, humidity and temperature levels at various heights. Although, brief relation between stability classes is revealed based on shear coefficient.
Eventually, developed framework is capable to run its selected case examinations by measured atmospheric properties to estimate the ambient turbulence levels. However, numerical methodology still requires for fur-ther validations on different terrain conditions for ex-tended measurements with respect to wind direction and wind speeds.
References
[1] G.C. Larsen, A Simple Stationary Semi-Analytical Wake Model, Risø-R-1713(EN), Risø National Lab-oratory, Roskilde 2009.
[2] T. Ishihara, A. Yamaguchi, Y. Fujino,Development of a new wake model based on a wind tunnel experiment, Global Wind, 2004.
[3] A. Peña, O. Rathmann, Wind Energy 17, 1269 (2014).
[4] A. Peña, P.E. Réthoré, M.P. van Der Laan, Wind Energy 19, 763 (2016).
[5] G.C. Larsen, H. Aagaard Madsen, F. Bingöl, J. Mann, S. Ott, J.N. Sørensen, Dynamic Wake Meandering Modeling, Risø-R-1607(EN), Risø National Lab., Den-mark 2007.
[6] X.G. Larsen, C. Vincent, S. Larsen,Quart. J. R. Me-teorol. Soc. 139, 685 (2013).
[7] N.G. Nygaard, J. Phys. Conf. Series 524, conf. 1 (2014).
[8] J. Sanz Rodrigo, E. Cantero, B. García, F. Borbón, U. Irigoyen, S. Lozano, P.M. Fernandes, R.A. Chávez, J. Phys. Conf. Series 625, conf. 1 (2015).
[9] J. Sanz Rodrigo, F. Borbón Guillén, P.G. Arranz, M.S. Courtney, R. Wagner, E. Dupont, Renew. En-ergy 53, 200 (2013).
[10] S. Wharton, J.K. Lundquist,Environm. Res. Lett. 7, No. 1 (2012).
[11] A.D. Peña, R. Floors, A. Sathe, S.E. Gryning, R. Wagner, M.S. Courtney, X.G. Larsén, A.N. Hah-mann, C.B. Hasager,Boundary-Layer Meteorol. 158, 1 (2016).
![TABLE I Stability classification according to Wharton and Lundquist [10]](https://thumb-eu.123doks.com/thumbv2/9libnet/4252209.67579/2.892.124.399.550.760/table-i-stability-classification-according-wharton-lundquist.webp)