KADİR HAS UNIVERSITY SCHOOL OF GRADUATE STUDIES
ENERGY AND SUSTAINABLE DEVELOPMENT PROGRAM
THE RENEWABLE ENERGY TRANSITION IN TURKEY
MESUT CAN YILMAZ
SUPERVISOR: PROF. DR. VOLKAN Ş. EDİGER CO-SUPERVISOR: ASSOC. PROF. DR. GÖKHAN KİRKİL
MASTER’S THESIS
THE RENEWABLE ENERGY TRANSITION IN TURKEY
MESUT CAN YILMAZ
MASTER’S THESIS
SUPERVISOR: PROF. DR. VOLKAN Ş. EDİGER CO-SUPERVISOR: ASSOC. PROF. DR. GÖKHAN KİRKİL
Submitted to the School of Graduate Studies of Kadir Has University in partial fulfillment of the requirements for the degree of Master’s in the Program of Energy and Sustainable Development.
SCHOOL OF GRADUATESTUDIES
ACCEPTANCE AND APPROVAL
This work entitled THE RENEWABLE ENERGY TRANSITION IN TURKEY prepared by MESUT CAN YILMAZhasbeen judged to be successful at the defense exam held on 29/05/2019 and accepted by our jury aa MASTER’S THESIS.
APPROVEDBY:
KADIR HAS UNIVERSITY
Assoc. Prof. Dr. Gökhan Kirkil (Co-advisor) Kadir Has University Prof. Dr. Meltem Ş. Ucal
Prof. Dr. Ahmet Sedat Aybar
Prof. Dr. Volkan Ş. Ediger (Advisor) Kadir Has Universityae
Kadir Has University
İstanbul Aydın University
I certify that the above signatures belong to the faculty members named above
o
N\
QE|A
\Prof Dr. Sinem. oiiçıkmeşe Dean of School of Grakjuate Studies DATE OF APPROVAL: 99 ,052019
TABLE OF CONTENTS
ABSTRACT ... i ÖZET ... ii ACKNOWLEDGEMENTS ... iii LIST OF ABBREVIATIONS ... iv LIST OF TABLES ... viLIST OF FIGURES ... vii
INTRODUCTION ... 1
1. THE GLOBAL RENEWABLE ENERGY TRANSITION ... 5
1.1 The Global Renewable Energy Transition ... 5
1.1.1 Germany ... 9
1.1.2 China ... 20
2. THE RENEWABLE ENERGY TRANSITION IN TURKEY ... 27
2.1 Overview of Turkey’s Energy Status ... 27
2.2 Electricity Market Structure ... 29
2.3 Solar Energy ... 31
2.4 Wind Energy ... 36
2.5 Hydropower ... 39
2.6 Geothermal and Biomass Energy ... 41
3. TURKEY’S TRANSITIONAL DISCUSSION ... 43
CONCLUSION ... 54
SOURCES ... 57
i THE RENEWABLE ENERGY TRANSITION IN TURKEY
ABSTRACT
Energy is an integral part of human life. The energy demand has been increasing for many years. The primary energy source differed over time. Fossil fuels dominated the energy market since 19th century. Overuse of fossil fuels has created serious problems such as climate change. In order to tackle these problems renewable energy source (RES) utilization gained importance in the recent years. With the help of economic and technological improvements, the transition from fossil fuels to renewables has accelerated in recent decades. Many countries have already started to invest in RES instead of fossil fuels. Germany and China have some unique characteristics that can help to reshape Turkey’s roadmap to the renewables. Turkey is a developing country with a population of about 80 million. Turkey’s energy import dependency is 77%. According to the experts, Turkey has a good potential for RES. Due to its geographical position there is adequate potential of solar, wind, hydro and geothermal. Turkey has an opportunity to utilize its RES potential. If the important steps are taken, RES can become the primary source of Turkey’s energy demand and would have positive effects on both the economy and sustainability.
Keywords: Renewable Energy Transition, Sustainability, Solar, Wind, Climate Change, Carbon Emissions
ii TÜRKİYE’DE YENİLENEBİLİR ENERJİ GEÇİŞİ
ÖZET
Enerji insan yaşamının ayrılmaz bir parçasıdır. Enerjiye olan talep her geçen gün artmaktadır. Birincil enerji kaynağı zaman içerisinde bir takım değişikliklere uğramıştır. Yakacak odunla başlayıp kömürle devam eden bu süreç şimdilerde doğalgaz veya elektrik olarak ilerlemesini sürdürmektedir. Geçmişten günümüze fosil yakıtların kullanımı başta iklim değişikliği olmak üzere önemli bazı sorunlara neden olmuştur. Bu sorunlarla mücadele etmek adına son yıllarda yenilenebilir enerji kaynaklarına bir yönelim olmuş ve bu yönelim hızı artarak devam etmiştir. Almanya ve Çin yenilenebilir enerjiye geçişte önemli bir yere sahip olan iki ülkedir. Son yıllardaki politikalarıyla hem yenilenebilir enerji kapasitesi hem de elektrik üretiminde iyi göstergelere sahip olan bu iki ülkenin geçiş süreçleri incelenmiş olup Türkiye için nasıl örnek teşkil edebilecekleri açıklanmıştır.
Türkiye enerjide 77% oranında dışarıya bağlı, gelişmekte olan bir ülkedir. Türkiye artan nüfüsunun ve gelişen ekonomisinin enerji talebini yüksek oranda fosil kaynaklardan karşılamaktadır. Yenilenebilir enerji potansiyeli açısından zengin bir ülke sayılan Türkiye’nin yenilenebilir enerjiye geçiş süreci bu çalışmada detaylıca incelenmiş olup, bir takım değerlendirmelerde bulunulmuştur. Küresel ısınma ve çevre sorunlarıyla mücadele edilen dünyamızda yenilenebilir enerji sürdürülebilir bir geleceğe sahip olmak adına önemli bir yer tutmaktadır. Bu geçişi hızlandırabilmek adına başarılı olmuş politikalar örnek alınmalı ve daha iylerinin oluşturulabilmesi için ortak hareket edilmelidir.
iii ACKNOWLEDGMENTS
I would like to express my sincere gratitude to all the people who gave their full support to me to complete my master’s studies. First of all, I would like to thank to my supervisor Prof. Volkan Ş. Ediger who encouraged me to choose the Energy and Sustainable Development Master Program at Kadir Has University. His understanding and helpfulness meant a lot to me. Without his continuous support and guidance I would not have been able to finish this work. Other valuable professors in the energy department have also made a significant contribution to this study. Additionally, I would like to extend my appreciation to the members of my thesis examination committee for their comments and suggestions. I am also extremely grateful for the scholarship that Kadir Has University gave me.
My acknowledgement also goes to my friends at Kadir Has who always encouraged me to be more optimistic and did their best for help.
Last but not least, my deep gratitude goes to my family and close friends for their endless support and patience in all stages of my life.
iv
LIST OF ABBREVIATIONS
°C Degree Celsius
BMBF German Federal Ministry of Education and Research BMEL German Federal Ministry of Food and Agriculture
BMU German Federal Ministry for the Environment, Nature Conversation and Nuclear Safety
BMWi German Federal Ministry of Economics and Technology
BP British Petroleum
CO2 Carbon Dioxide
EIA U.S Energy Information Administration EIGM General Directorate of Energy Affairs EMRA Energy Market Regulatory Authority
EU European Union
EUAS Electricity Generation Corporation EXIST Energy Exchange Istanbul
FIT Feed-in Tariff
GDP Gross Domestic Product
GHG Greenhouse Gas
GW Gigawatt
IEA International Energy Agency
IMF International Monetary Fund
IRENA International Renewable Energy Agency
KWh Kilowatt hour
MW Megawatt
v
MWh Megawatt hour
MTOE Million Tons of Oil Equivalent
MENR Republic of Turkey Ministry of Energy and Natural Resources NDC Nationally Determined Contribution
NDRC National Development and Reform Commission R&D Research and Development
REN21 Renewable Energy Policy Network for 21th Century OAPEC Organization of Arab Petroleum Exporting Countries
TWh Terawatt hour
TEDAS Turkish Electricity Distribution Corporation TEIAS Turkish Electricity Distribution Corporation
TETAS Turkish Electricity Trade and Contracting Corporation UNFCCC The United Nations Framework Convention Climate Change YEGM General Directorate of Renewable Energy
vi
LIST OF TABLES
Table 1.1. Global Installed Capacity of Renewable Energy ………..……7
Table 1.2. Total RE Consumption of Germany ………….…...……….………..13
Table 1.3. Share of Primary Energy Consumption in Germany by Carrier…………...….13
Table 1.4. Primary Energy Consumption in Germany ………...……...14
Table 1.5. Expenditures of German States for Non-Nuclear Research by Sector ...15
Table 1.6. Federal Government’s 7th Energy Research Programme in Germany …..…….17
Table 1.7. Milestones of Renewable Energy Transition in Germany ...……….. 19
Table 1.8. Renewable Energy Consumption in Germany by Sector, 2003-2017 ……... 19
Table 1.9. Top 5 Countries in Annual Investment and Net Capacity Additions in 2017 ....21
Table 1.10. Top 5 Countries in Total Capacity or Generation as of 31 December 2017 ....22
Table 1.11. Renewable Energy Targets of China ..………..24
Table 1.12. Primary Energy Sources of China by Fuel Type ….………...…………..26
Table 2.1. Feed-in Tariff in Turkey ……….……….………...28
Table 2.2. Technology-Based FIT and Domestic Content Extra by Source in Turkey …...28
Table 2.3. Distribution of Solar Energy Potential by Months in Turkey ..….…………..…32
Table 2.4. Solar Energy Potential Distribution by Regions in Turkey…….….….…....…..33
Table 2.5. The Amount of Excess Energy Sold to the Grid in Turkey…..….………..35
Table 2.6. Turkey’s Total Installed Capacity of Wind ……...…...……….……..37
Table 2.7. Yearly Generation of YEKDEM participants by years ……….….…….40
Table 2.8. Hydropower Consumption in Turkey…...….….….……...……...40
Table 3.1. Unlicensed Installed Capacity by Sources 2016-2017.…….….….…...………..44
Table 3.2. National Energy Efficiency Action Plan ……….………...………….…...46
Table 3.3. Renewable Energy Regulations in Turkey Over the Years…...…....…….…...46
Table 3.4. Turkey’s Installed Capacity Targets 2015-2023 ……….47
Table 3.5. Overview of the Turkish Electricity Market………...49
Table 3.6. Comparison of Total Installed Capacities of RES………...………..……..50
Table 3.7. Total Installed Capacity of Turkey as of January 2019 …………....…………..51
vii
LIST OF FIGURES
Figure 1.1. Global Renewable Energy Consumption ……..………..……8
Figure 1.2. Primary Energy Consumption in Germany………..…………9
Figure 1.3. Federal Energy Research Programme Funding by Topic in Germany………..16
Figure 1.4. Development of Renewable Energy in Germany ………..18
Figure 1.5. Feed-in Tariffs for Solar and Wind in China…..……….…...….…..23
Figure 2.1. Divisions of Turkish Government Entities Regulating the Electricity Market..29
Figure 2.2. Solar Radiation Rate in Turkey ……….……….………...31
Figure 2.3. Wind Potential of Turkey …….……….………36
Figure 2.4. Turkey’s Wind Power Plants Under Construction……….38
1
INTRODUCTION
Energy is an integral part of human life. It has been used for many purposes, including lightning, heating, cooling, manufacturing, transportation and more. Economic growth and energy are deeply connected. Demand for energy has increased alongside population and life expectancy. The world population grew rapidly in the last two centuries. It took roughly 200 years for the world’s population to increase from 1 billion to 7.5 billion. There is also a positive correlation between population, economic growth and energy demand. Since the populations and economies are growing daily, energy demand is rising in a commensurate fashion.
Humanity’s energy sources have changed over time. These sources have included wood, coal, oil and natural gas. People have tended to switch from one energy source to another if the new one was better than the current one (Solomon and Krishna, 2011). Three characteristics made one source better: higher calorific value, greater practicability in use and lower environmental impact. Wood fuels were the primary energy resources for most of humanity’s history, but coal replaced wood in the first half of the nineteenth century because of its higher calorific value and its suitability for industrial use (Fouquet, 2010). Coal became widely used, especially for the steam engines during the Industrial Revolution. With the help of technological improvements, petroleum products became the dominant energy source from coal in twentieth century (Fouquet, 2010). Oil was better than coal in terms of calorific value, practicability and cleanliness. When natural gas became available for large-scale use in the 1950s, it became preferred as an energy source along with oil because of its advantages over coal and other sources. The energy transition is a dynamic, ongoing process and is still advancing towards better sources.
Fossil fuels - oil, natural gas and coal - dominate today’s energy markets. According to BP (2018), most of the world’s primary energy consumption comes from fossil fuels with a share of 85.2%. The share of renewables including hydro is 10.4%. However, fossil fuel dominated energy systems are unsustainable. Firstly, all fossil sources are finite by nature, and their reserves are diminishing year by year. Another major problem is environmental.
2 The burning of fossil fuels has resulted in significant damage to the environment. The world’s average temperature has risen due to the release of carbon emissions into the atmosphere. If the world’s average temperature exceeds 2 °C level, the consequences could be catastrophic for humankind. Renewable energy sources (RES) can therefore play an important role in helping mitigate the adverse effects of climate change. First of all, RES are considered infinite and abundant. Secondly, they are environmentally friendly. They offer an economic, environmental and social sustainability and it is possible that they dominate the energy sector in the near future (IEA, 2016; EIA, 2019).
Turkey is a developing country with a population of about 80 million. Its economy is the 18th largest in the world and is expected to grow in the coming years (IMF, 2018). Since energy is needed for economic development, energy demand is also expected to increase. Turkey’s energy mix consists of 87% fossil fuels. However, the net import dependency is 77% (Ministry of Energy and Natural Resources, 2017). At the same time, Turkey has good potential for RES. Due to its geographical position there is adequate potential of solar, wind and geothermal (Ediger and Kentel, 1999; Balat, 2005; Özgür, 2008; Serpen et al, 2009; Kırtay, 2010; Melikoğlu, 2017; Kılıçkaplan et al., 2017). Biomass potential is also comparatively sufficient (Erdil and Erbıyık, 2015; Toklu, 2017). Turkey should use its renewable energy potential for its sustainable development by switching from fossil fuels to renewables.
The main purpose of this thesis is to harness knowledge about renewable energy transitions in the world and in other specific countries and to arrive at insights and guidelines that will be beneficial for Turkey to hasten its own transition. In the thesis, I tried to answer the following question: “what should Turkey do to hasten its own renewable energy transition?”. Sub-questions include: “which countries have had the best practices of in hastening a renewable energy transition?; “which countries should Turkey emulate in order to achieve a successful transition”; “what obstacles do countries face in the transition?”; “what kind of policies should be implemented to change the renewable energy future in a better way?”; and “what are the basic strategies Turkey that should follow?”. The study takes Germany and China models because of their unique characteristics that can be compared with Turkey. All these three countries have one common point: energy import dependency. The share of domestic production in consumption of Germany (20.2%), China
3 (70.1%) and Turkey (21.6%) can be increased with the help of enhancing renewable energy share in their energy mix (BP, 2018). Turkey (56%) and Germany (35%) are both importing natural gas from Russia to meet their energy demand (EIA, 2017; Forbes, 2018). Germany is a pioneering country, having launched its renewable transition and implemented efficient policies during the process. Also, the populations of Germany and Turkey are similar, which makes for a helpful for comparison. China, meanwhile, is the global leader of the renewable energy transition in terms of installed capacity and growth rate although it started to the RE transition later than Germany. However, the eagerness of change and domestic manufacturing power has helped China to accomplish its RE targets and made them world leader in a short period.
There are numerous papers analyzing the global renewable energy transition. While these studies generally focus on the political aspects of the energy transition, others focus more on economics. For instance, Fouquet (2010) analyzed the historical background of energy transitions. Smil (2016) examined the energy transition briefly and identified 12 different aspects. Kelsey and Meckling (2018) discussed the policies that led to the renewable energy transition and provided related evidence. Yanfang and Wei (2012) studied the legislation and incentives behind the renewable energy transition in China, which has implemented a considerable amount of RES into its energy system in recent years. Conolly et al. (2016) examined the impacts of renewable energy on the European Union (EU). Pacesila et al. (2017) analyzed the renewable energy sector in the EU and grouped similar states by their renewable energy usage. Strunz et al. (2016) analyzed the policies of both the EU and Germany. Renn and Marshall (2016) investigated the details of renewable policy since the 1950s.
There are also several publications on renewable energy transition in Turkey. Ediger and Kentel (1999), Balat (2005), Özgür (2008), Serpen et al. (2009), Kırtay (2010) and Kılıçkaplan (2017) assessed the current and future renewable energy situation of Turkey. Özturk et al. (2007) and Erdoğdu (2011) studied on hydropower in Turkey. Melikoğlu (2017) focused on Turkey’s geothermal energy, and analysed the country’s future targets for 2023. Şekercioğlu and Mustafa (2012) examined the renewable energy policies of EU and Turkey. Greenpeace (2015) prepared a very informative and detailed report that examined the past, present and future of the transition in Turkey. Meanwhile Mete and
4 Heffron (2015) reviewed the Turkey’s renewable energy policies and legislation. Kılıçkaplan et al. (2017) investigated the renewable energy transition of Turkey by 2050 with a two different scenario simulations. All of these works were informative and inspiring.
The data used in this study was obtained from the International Energy Agency (IEA), the International Renewable Energy Agency (IRENA), BP (British Petroleum), the Renewable Energy Policy Network for 21st century (REN21), Greenpeace and other international
organizations. Turkey’s domestic data were obtained from the Energy Market Regulatory Authority (EMRA), the Ministry of Energy and Natural Resources (MENR), the Turkish Electricity Transmission Corporation (TEIAS), the Turkish Statistical Institute (TÜİK) and other related local organizations. The data was collected and interpreted to give information about the current situation and to make future predictions.
This thesis has four parts. The first provides a brief introduction to the global renewable energy transition. The second assesses how other countries, including Germany and China, have undertaken their own transitions. It then moves to the third part to investigate the energy transition in Turkey by giving specific background about Turkey’s renewable energy potential, its installed capacities, its electricity generation and the possible future status of renewables. The economy of renewables, such as affordability and feasibility, will be an important component as will analyzing the obstacles that Turkey faces for its renewable energy transition. It will also suggest ways for the country to identify a roadmap to increase its share of RES. Finally, in the fifth part, it will conclude by offering recommendations.
5
1. THE GLOBAL RENEWABLE ENERGY TRANSITION
This section provides detailed information about the renewable energy transition process, including historical background and the reasons that it began and that sustain its momentum. In addition, countries that have enacted successful renewable energy transitions, including Germany and China, are analyzed in further detail.
1.1. The Global Renewable Energy Transition
Energy types have changed over time, and primary energy resources have differed throughout history. It took many centuries to transition from wood to natural gas. Fossil fuels remain the main sources of today’s energy consumption. However, these sources are unsustainable because of their environmental impact and depleting reserves. When all of these reasons are taken into consideration, RES are a better option. They are eco-friendly and considered infinite. They offer new potential to solve substantial problems.
Renewable energy is not a new concept. Solar, wind, biomass and geothermal energy have been used in elementary forms for centuries. Water and windmills were widely used in agriculture and transportation while geothermal for heating. With the help of technological developments RES become more sophisticated. Their usage area and efficiency levels have changed in a considerable extent. Solar, wind, biomass or geothermal energy can be easily transformed into electricity and are used in a large scale.
The importance of the renewable energy has grown in recent decades. After the oil crises of the 1970s, countries sought new alternatives. Price fluctuations of fossil fuels greatly affected energy demand, especially in developing countries (El-Ashry, 2012). Securing energy that was sustainable and that could make states more energy independent became important issues. Renewable energy gained prominence in this context and affected governmental policies (Hache, 2018). States started to plan more independent systems in order to cope with their energy problems. However, the technology and cost of renewables were too high, making it difficult to compete with fossil fuels. The conventional
6 technologies have had political and financial support for many years, and such support is essential for RES to compete with fossil fuels (Greenpeace, 2015). Governments can incentivize RES investment through instruments such as VAT exemption, tax deduction, land allocation, or financial support. These investments can stimulate the economy and contribute to society by enhancing technological development and global competitiveness. Also, from an economic perspective, renewable energy can help create high-quality jobs and encourage the development of micro-industries and mini industrial zones (Conolly et al., 2016).
Climate change is another critical factor that has accelerated the renewable energy transition because it forced governments to think about cleaner energy resources. Many countries signed the United Nations Framework Convention on Climate Change (UNFCCC) in 1992 and accepted the Kyoto Protocol in 1997. The protocol pledged the signatory countries to decrease their greenhouse gas emissions and use more renewable energy into their systems. The EU pledged to double its renewable energy proportion by 2010. The countries also signed the Paris Agreement in 2015, the main goal of which was to mitigate the global adverse effects of climate change and keep the global rise in temperature below 1.5°C (UNFCCC, 2015). The signatory countries should make a serious effort to reach their nationally determined contributions (NDCs) according to the agreement.
There is an external factor that changed the world’s perspective about renewables and shaped future energy policies: the nuclear disasters at Chernobyl and Fukushima (Verplanken, 1991; Jacobsson and Labuer, 2006; Khatib and Difiglio, 2016). In 1986, a major accident occurred at the Chernobyl nuclear power plant in Ukraine, in which the reactors exploded and radiation released into the atmosphere. Radioactive clouds spread all over Europe and neighbor countries including Turkey. The radiation caused many deaths and serious illnesses; the impacts of the accident are still felt (Baverstock and Williams, 2006). The plant area is unusable, as radiation levels at Chernobyl are not at normal levels and are not expected to be in the near future. In 2011, the Great East Japan Earthquake created a tsunami that inflicted heavy damage to the Fukushima Daiichi nuclear power station. A meltdown occurred in the reactors, and thousands of people were evacuated. Radioactive materials leaked into ocean, causing radioactive fallout. The reliance on fossil
7 fuels and nuclear was shattered. After the disaster, countries changed their future energy plans (Kan, 2018). France, for example, generated its electricity mostly from nuclear power, but decided to close 14 nuclear reactors by 2035 (France24, 2018). Germany also decided to shut down its nuclear plants by 2022 (BBC, 2011). The common aim was to replace nuclear with wind and solar power.
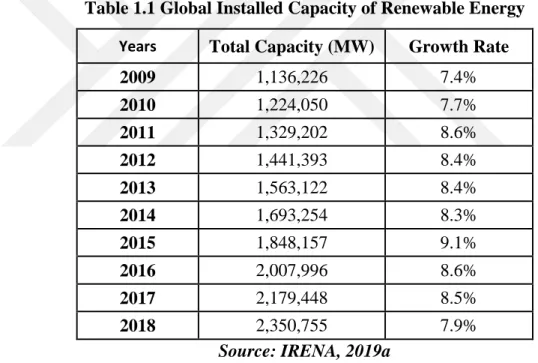
The technology of renewables is also changing rapidly. Costs have fallen significantly in recent years, and governments have started to support RES with greater seriousness and urgency. With the help of technological and economic developments, the global installed capacity of renewables has risen dramatically (Table 1.1), doubling over the last ten years with an average growth rate of 8.3% (IRENA, 2019a).
Table 1.1 Global Installed Capacity of Renewable Energy
Years Total Capacity (MW) Growth Rate
2009 1,136,226 7.4% 2010 1,224,050 7.7% 2011 1,329,202 8.6% 2012 1,441,393 8.4% 2013 1,563,122 8.4% 2014 1,693,254 8.3% 2015 1,848,157 9.1% 2016 2,007,996 8.6% 2017 2,179,448 8.5% 2018 2,350,755 7.9%
Source: IRENA, 2019a
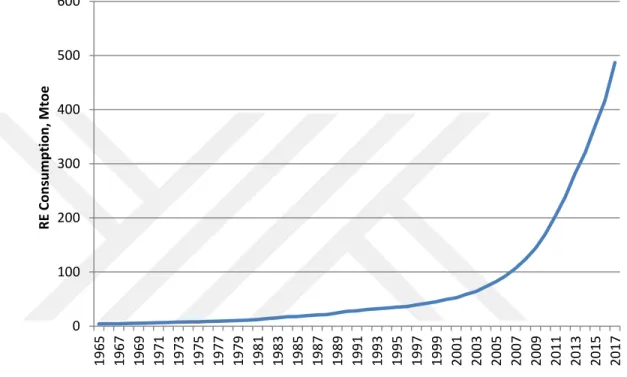
Likewise, the global consumption of renewable energy grown at a rate of 16.6% annually, bringing to market around 500 Mtoe (BP, 2018). After tepid development until 2006, RE consumption doubled from 2012 to 2017. The market continued its growth, with many regions of the world contributing to RE development. In 2017, electricity generation from renewables increased by 17% and accounted for 8.4% of the world’s total consumption (BP, 2018).
8 In 2018, solar power capacity grew by 24.2%, wind power capacity by 9.5%, geothermal power capacity by 4.22% and hydropower capacity by 1.67% (IRENA, 2019a). Figure 1.1 shows the global energy consumption of the world between the years of 1965 and 2017. It can be clearly seen that the RE consumption has increased rapidly since 2000s.
Figure 1.1 Global Renewable Energy Consumption, 1965-2017
Source: BP, 2018
Many countries, especially EU countries, are increasing their investments in renewable energy as an alternative to fossil fuels. Portugal (14.2%), Germany (13.4%), Finland (13.4%), Sweden (12.4%), Spain (11.3%), and United Kingdom (11.0%) have a good share of renewable energy in their energy mixes (BP, 2018). In addition to these countries, Asian markets are eager to deploy renewable energy. China (695.865 MW) is the leader in total installed capacity as well as total added power both in solar and wind. China (695.865 MW), USA (245.245 MW), Brazil (135.674), Germany (120.014 MW), India (117.919 MW), and Japan (90.154 MW) have a significant amount of installed RE capacity (IRENA, 2019a).
Germany and China are the two countries considered the most successful in terms of enacting a renewable energy transition. Germany started its transition earlier than anyone
0 100 200 300 400 500 600 19 65 19 67 19 69 19 71 19 73 19 75 19 77 19 79 19 81 19 83 19 85 19 87 19 89 19 91 19 93 19 95 19 97 19 99 20 01 20 03 20 05 20 07 20 09 20 11 20 13 20 15 20 17 R E C o n su m p tion , M to e
9 and regulated its energy structures and laws accordingly. China started its transition later than Germany but has pursued a more aggressive policy to catch up. China is now leading the world in global investment in RES-based generation and invests in every kind of RES. I will examine these two different countries in the following section.
1.1.1 Germany
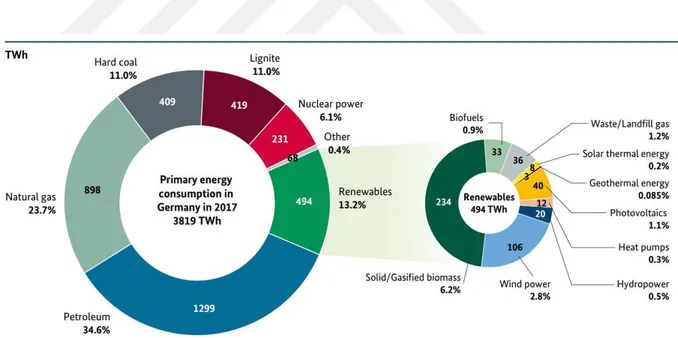
Germany’s Energiewende pioneered the renewable energy transition. Energiewende, first introduced by Kraus et al. (1980), described a path for economic growth and prosperity without uranium and petroleum. Germany had long been a coal-dominated country. When world preferences started to change, they decided to switch to green energy to secure its energy supplies and create a more sustainable system. Today renewable energy is one of its most important sources of energy consumption, constituting a 13.2% share (Figure 1.2).
Figure 1.2 Primary Energy Consumption in Germany (TWh)
Source: BMWi, 2017
Germany’s transition began several decades ago. The Ruhr basin in North Rhine-Westphalia was rich in coalmines; thus the coal industry was located there (Marx, 2014). The coal industry very dominated the market for many years. Then, nuclear power began to
10 be phased in during the 1950s, and it became an important source of domestic supply (Hake et al., 2015). Governmental support for coal and nuclear increased especially after the Organization of Arab Petroleum Exporting Countries (OAPEC) crisis in the 1970s (Hager, 2015). The Ministry of Research and Technology organized a program and invested 10 million DM in research and development (R&D) for renewables (Hake et al., 2015). In order to ensure energy-supply security, solar and wind technologies were supported. A new political movement formed around the anti-nuclear movement, which later became the Green Party. The Greens were environmental activists who pursued a more environmentalist and transparent brand of politics (Hake et al., 2015). They entered parliament in 1983 and tried to achieve better environmental and transparent policies (Hager, 2015).
The past reveals that predetermined policies are likely to change when there is an unexpected incident, and it was the Chernobyl disaster in 1986 that reshaped the Germany’s energy policy (Kunz and Weigt, 2014; Strunz, 2014; Renn and Marshall, 2016). Later Fukushima disaster occurred in 2011. Intended projects were cancelled due to great public opposition against nuclear. Instead of nuclear, new alternatives such as solar and wind were evaluated. In 2011, Germany made a bold decision that clearly indicated its exit from nuclear, which was one of the most extreme reactions among countries to the Fukushima disaster (Grossi et al., 2017).
Before that, the environmental impacts of climate change started to gain more attention in the 1990s, which led countries to initiate policies that supported renewable energy (Strunz, 2014). Germany signed the UNFCCC in 1992. In 2010, the government announced new energy strategies that sought to achieve ambitious targets for climate protection. It targeted to reduce carbon emissions by 55% and increase the share of RES in electricity consumption to 50% by 2030. These targets were later extended to an 80% emissions decrease compared to 1990 and an 80% increase in RE electricity (Hake et al, 2015). Other energy concepts such as green transportation, energy efficient buildings, and better energy-storage systems were also given priority.
EU countries adopted feed-in tariff (FIT) mechanisms after the acceptance of the UNFCCC. These mechanisms guaranteed the sale of electricity for renewables producers, who could their generated electricity at a fixed price for a fixed period of time. Germany
11 was one of the first countries to implement FITs, and additional legislation supporting electricity generation from RES was concurrently pursued. The policies started in 1990s and were expanded in the following years. In 1991, the Electricity Feed Act (EFA) was passed. In 1998, the Green Party and Democrats won the elections and formed a coalition agreement that promised to exit nuclear, reduce carbon emissions, and accelerate the renewable energy transition (Hake et al., 2015). At the same time, electricity and natural gas markets were liberalized in the same year, which led to the liberalization of energy markets and a more decentralized energy generation regime. This had the benefit of being more competitive than the previous regime (Strunz, 2014).
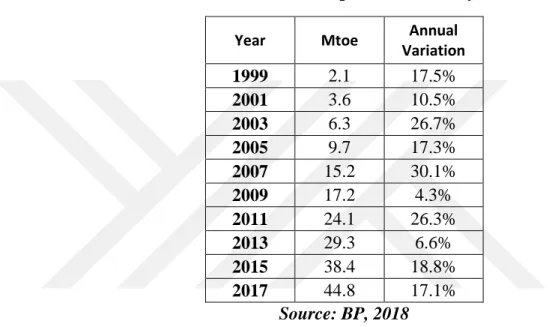
In 2000, Germany adopted the Renewable Energy Sources ACT (EEG) as an extended version of the EFA in order to accelerate the implementation of renewables and to decentralize energy production (Strunz, 2014). FITs were also restructured with the EEG so that other countries could benefit from them (Buchholz et al., 2019). They had a chance to create their own systems in order to stimulate the market. Germany’s FIT mechanism had three main characteristics: long-term guarantees (20 years) for the sale of RE electricity at a higher price than the market price, priority of electricity sales at the market (merit order), and obligatory grid connection by the grid operator (Matschoss et al., 2019). In order to attract potential investors, the FIT support premium was higher than the market price. For example, wind power was being sold at 9.1 cent/kWh and solar power at 50.6 cents/Kwh (Borosso and Iniesta, 2014). The EEG helped the solar and wind energy market grow substantially; the photovoltaics (PV) market grew at an average rate of 30 percent since 2000s (German Federal Ministry of Economics and Technology, 2018). It can be stated that improvements in FITs significantly contributed to the proliferation of RES, whose consumption increased from 2.1 Mtoe in 1999 to 44.8 in 2017, a nearly 22-fold increase, within 18 years (BP, 2018).
In order to understand the success behind Energiewende, the Germany’s government structure for energy should be carefully examined. The main institutions are the Federal Ministry of Economics and Technology (BMWi), the Federal Ministry of Education and Research (BMBF), the Federal Ministry for the Environment, Nature Conversation and Nuclear Safety (BMU), the Federal Ministry of Food and Agriculture (BMEL), German Energy Agency (DENA), Arbeitgemeinschaft Energiebilanzen (AGEB) and Federal Cartel
12 office (FCO). The BMWi is responsible for the energy policy and R&D in general. The BMU was established in order to take part in the nuclear sector in 1982 (Hake et al., 2015). However, the BMU is now responsible for the environmental policies such as climate change, nuclear safety and fossil fuel usage. The BMWi, BMBF and BMEL are working together to implement supportive programs. The BMWi and BMBF are dealing with projects related to the efficiency of renewable energy, nuclear systems and waste disposal. The BMEL is funding bioenergy projects. The FCO regulates energy and electricity markets. AGEB is responsible for the preparation and evaluation of energy-balance statistics from all sectors of the energy industry. In 2000, the government also founded the German Energy Agency (DENA) in order to bring various energy sector players together, help develop energy-efficient policies for both climate change and sustainable development (Jacobs, 2012; Strunz, 2014; Renn and Marshall, 2016). In 2006, the German Solar Industry Association (BSW) was founded in order to stimulate growth in the solar market. In the transition period, Germany became interested in two RES: wind and solar. It is mainly because the potential success of these sources is relatively greater than others. However, these technologies were implemented around 1990s (Erge et al., 2001; Jacobsson and Lauber, 2006).
The government invested in projects such as “Growian” (big-wind turbine) in order gain experience with RES (Hake et al., 2015). The Growian failed due to technical difficulties, which pleased coal and nuclear supporters (Hake et al., 2015). However, Germany did not stop seeking alternatives. In 1989, the government presented a support program for wind power that aimed to install 100 MW of wind power with a guaranteed payment of €0.04 cent/kWh (Jacobsson and Lauber, 2006). The first rooftop PV system that had a grid connection was used in Munich (Erge et al., 2001). This led to the development of small-scale solar.
In 1991, the government initiated “the German 1000-Roofs Program” in order to accelerate this technology. One of the main objectives was to popularize the small-grid connected installations. After the program, more than 2000 grid-connected PV systems were established and public awareness increased (Erge et al., 2001). The 1000-Roofs program was a good start for solar power, and the program was expanded in 1999 to the 100,000-Roofs-Solar Programme by the BMU. This program provided subsidies, such as low
13 interest loans and easy terms of payment, for investors (Jacobsson and Lauber, 2006). PV systems larger than 1 kW could also benefit from these subsidies. The program sought to develop 300 MW of additional capacity and ended in 2003 with 55,000 rooftop installations and 261 MW of additional capacity (IEA, 2012). Together, these developments contributed to the renewable energy transition (Table 1.2, Table 1.3).
Table 1.2 Total RE Consumption of Germany, 1999-2017
Year Mtoe Annual
Variation 1999 2.1 17.5% 2001 3.6 10.5% 2003 6.3 26.7% 2005 9.7 17.3% 2007 15.2 30.1% 2009 17.2 4.3% 2011 24.1 26.3% 2013 29.3 6.6% 2015 38.4 18.8% 2017 44.8 17.1% Source: BP, 2018
Table 1.3 Share of Primary Energy Consumption in Germany by Carrier
% 1990 2000 2005 2010 2015 Hard coal 15.5 14.0 12.4 12.1 13.0 Lignite 21.5 10.8 11.0 10.6 11.8 Petroleum 35.1 38.2 35.5 32.9 33.9 Gases 15.5 20.8 22.4 22.4 21.0 Nuclear Energy 11.2 12.9 12.2 10.8 7.6 Renewable Energy 1.3 2.9 5.3 9.9 12.4
Other Energy Carriers 0.0 0.4 1.4 1.7 1.7
Net import of electricity 0.0 0.1 -0.2 -0.4 -1.3
Total 100 100 100 100 100
Source: AGEB, 2018b
Energy regulations also affected the carbon dioxide (CO2) emissions negatively. The total
amount of CO2 emission was greater than 1000 million tons (mt) between the years of
14 time. This downtrend has been continuing since 1990. Between the years of 1990 and 2017, total amount reduced from 1003,2 mt to 765,4 mt (BP, 2018). In order to contribute to the international climate protection, the reduction target for 2050 was set to 50% (Hake et al., 2015).
Energiewende regulations had had a notable effect on energy supply and consumption
(Renn and Marshall, 2016; Strunz et al., 2016; Hansen et al., 2019). RES increased its share of production by 9% from 2011 to 2017 (BP, 2018). Germany has seen one of the highest increases in RES generation worldwide. In 2017, it installed 7,295 GW in total new capacity and most of the increase took place in solar (8.5%) and wind (6.6%), while hydropower and bioenergy capacities remained stable (IRENA, 2019a). According to the REN21 (2018), Germany ranked first in per-capita PV capacity in 2017. With the help of supporting mechanisms, PV and wind played an important role in the electricity market between 2000-2015 (Table 1.4), where the share of renewables grew while coal and nuclear declined.
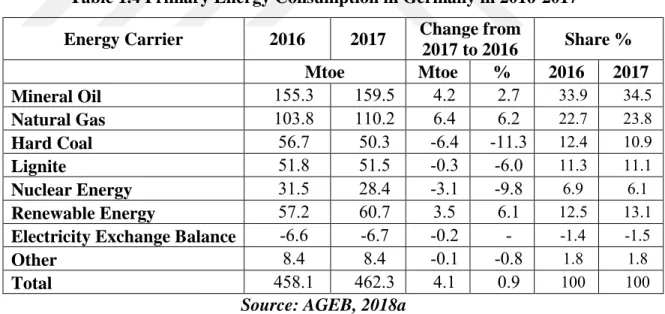
Table 1.4 Primary Energy Consumption in Germany in 2016-2017 Energy Carrier 2016 2017 Change from
2017 to 2016 Share % Mtoe Mtoe % 2016 2017 Mineral Oil 155.3 159.5 4.2 2.7 33.9 34.5 Natural Gas 103.8 110.2 6.4 6.2 22.7 23.8 Hard Coal 56.7 50.3 -6.4 -11.3 12.4 10.9 Lignite 51.8 51.5 -0.3 -6.0 11.3 11.1 Nuclear Energy 31.5 28.4 -3.1 -9.8 6.9 6.1 Renewable Energy 57.2 60.7 3.5 6.1 12.5 13.1
Electricity Exchange Balance -6.6 -6.7 -0.2 - -1.4 -1.5
Other 8.4 8.4 -0.1 -0.8 1.8 1.8
Total 458.1 462.3 4.1 0.9 100 100
Source: AGEB, 2018a
The increase of solar and wind did come at a cost. There was a price reduction in solar energy generation after the Renewable Energy Sources Act in 2001 (Buchholz et al., 2019). In 2011, more than 80% of electricity from RES (RES-E) generation received additional payments as specified within the Renewable Energy Sources Act, with total payments to RES operators amounting to more than €16 billion (Kreuz and Müsgenz, 2018). The FIT
15 mechanism was amended several times in order to accommodate these price realities. Germany pursued policies that decreased financial support after the determined level; payment were always higher at first, but gradually declined over time.
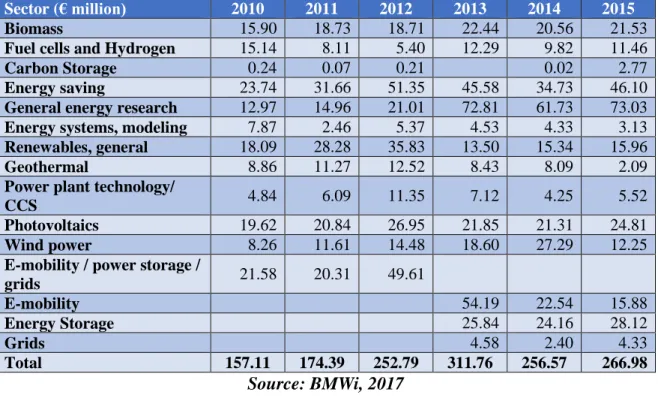
Energy Research programs played a critical role. The 1st Energy Research Programme was initiated by the government to fund non-nuclear research projects with a budget of 12 billion DMs in 1977 (BMWi, 2018). Thanks to this program, different actors from business, academia, and society got involved in the energy transition. In 2010, the BMWi and BMBF started an R&D program in order to stimulate the solar industry with a budget of €100 million. Funding of RE has helped create a more efficient, sustainable and cleaner energy system. Also it helped universities, institutes and firms gain experience with RES at an early stage (Hager, 2015). R&D activities opened the new door for greater technological advancement in solar and wind. Programs funded a wide range of sectors, as shown in Table 1.5. General energy researches, energy saving, energy storage and photovoltaics have a greater share than others.
Table 1.5 Expenditures of German States on Non-Nuclear Research by Sector
Sector (€ million) 2010 2011 2012 2013 2014 2015
Biomass 15.90 18.73 18.71 22.44 20.56 21.53
Fuel cells and Hydrogen 15.14 8.11 5.40 12.29 9.82 11.46
Carbon Storage 0.24 0.07 0.21 0.02 2.77
Energy saving 23.74 31.66 51.35 45.58 34.73 46.10
General energy research 12.97 14.96 21.01 72.81 61.73 73.03
Energy systems, modeling 7.87 2.46 5.37 4.53 4.33 3.13
Renewables, general 18.09 28.28 35.83 13.50 15.34 15.96
Geothermal 8.86 11.27 12.52 8.43 8.09 2.09
Power plant technology/
CCS 4.84 6.09 11.35 7.12 4.25 5.52
Photovoltaics 19.62 20.84 26.95 21.85 21.31 24.81
Wind power 8.26 11.61 14.48 18.60 27.29 12.25
E-mobility / power storage /
grids 21.58 20.31 49.61 E-mobility 54.19 22.54 15.88 Energy Storage 25.84 24.16 28.12 Grids 4.58 2.40 4.33 Total 157.11 174.39 252.79 311.76 256.57 266.98 Source: BMWi, 2017
In September 2018, the Federal cabinet adopted the 7th Energy Research Programme (BMWi, 2018). The program had a €7 billion budget for projects advancing innovative ideas, technological readiness, and energy efficiency. The energy research programs
16 provided opportunities to test innovative ideas, in which start-ups would play a critical role. Coordination with the EU and other international organizations also became possible, as their scope was extended to the international level.
Energy efficiency and RES were the main targets of these programs, but also included research on fusion and nuclear safety (Figure 1.3). The funding helped build more affordable, efficient, and environmentally friendly solutions for the RE transition.
Figure 1.3 Federal Energy Research Programme Funding by Topic in Germany
Source: BMWi, 2017
Domestic production and intellectual property rights are also important in Germany. There are more than 1000 company that are actively manufacturing RE component, equipment and final products especially in solar and wind sector (Jacobsson and Lauber, 2006; Rogge and Scheleich, 2018). There is a remarkable increase in the number of patents in the RE technology. According to IRENA (2018), number of total RE patents increased from 1,493 to 30,696 since 2000. With the help of technological improvements and supporting instruments, the cost of solar power fell from €50 cents/kWh to €6 cents/kWh (BMWi, 2018). In order to maintain development in the transition period, government has continued to fund institutions and projects (Table 1.6).
17 Table 1.6 Federal Government’s 7th Energy Research Programme in Germany
€, thousands Target Government
draft Plan Data
2018 2019 2020 2021 2022 BMWi 639,700 725,205 725.778 723,800 723,745 Project funding 595,596 682,980 682,980 682,980 682,980 Institutional Funding 44,104 42,225 42,798 40,820 40,765 BMEL Project Funding 46,803 46,803 46,803 46,803 46,803 BMBF 506,613 515,601 528,018 521,819 521,809 Project Funding 133,427 133,261 133,355 133,355 133,355 Institutional Funding 373,186 382,340 394,663 388,464 388,454 Total 1,193,116 1,287,609 1,300,599 1,292,422 1,292,357 Source: BMWi, 2018
As part of the renewable energy transition process, Germany also promoted electric vehicles, while taking actions to curtail the use of conventional cars. In 2009, the BMU introduced the National Electro-Mobility Development Plan, whose target was to decrease vehicle-related emissions and invest in R&D facilities (BMU, 2009). Later, in 2015, the BMWi and BMU initiated the Electric Mobility Act, which gave privileges to electric vehicles, such as purchase grants or free parking (BMWi, 2018). The government is planning to expand its charging infrastructure by providing €300 million (BMWi, 2018). It has also started to exclude diesel cars from roads. As a beginning, old diesel vehicles were banned from roads in Bonn and Cologne in order to have better air quality (DW, 2018). As of 2017, Germany had 110,000 electric vehicles with a market share of 1.6% (IEA, 2018). The goal is to reach 1 million electric vehicles by 2022 (Reuters, 2018).
Germany started its renewable energy transition several decades ago. When we look at Germany today, it can be stated that all its investments and political decisions served the purpose very well (Figure 1.4). The transition continues for Germany. Its target is to reach to high levels in RE production and consumption.
18 Figure 1.4 Development of Renewable Energy in Germany, 2000-2017
Source: BP, 2018
The major factors that underlie the success of the renewable energy transition in Germany can be summarized as follows:
Early starter of transition;
Economic and political support from the government;
Strong feed-in tariff (FIT) mechanism;
Public awareness.
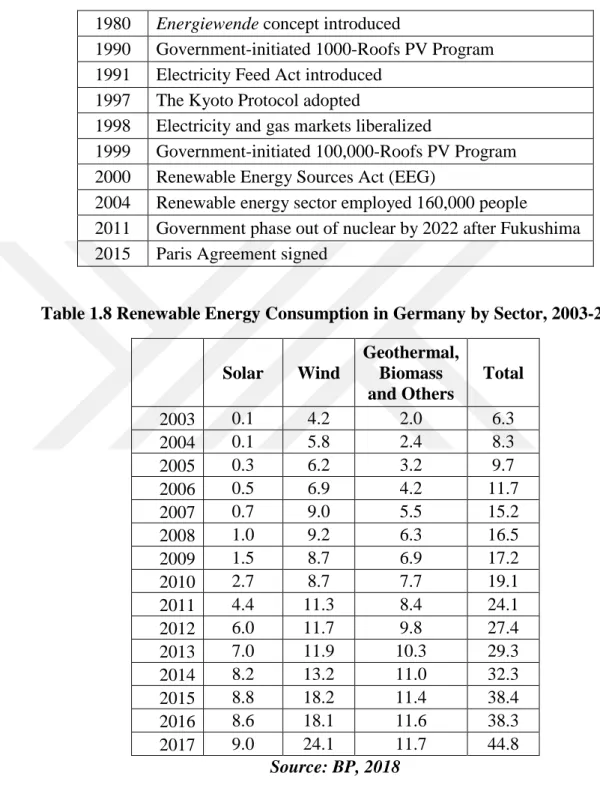
The early phases of renewable energy transition have been completed, having passed through many stages already (Table 1.7). RE consumption increased in the transitional phase (Table 1.8). 0 5 10 15 20 25 30 35 40 45 50 2000 2001 2002 2003 2004 2005 2006 2007 2008 2009 2010 2011 2012 2013 2014 2015 2016 2017 C onsum pti on, m toe
19 Table 1.7 Milestones of Renewable Energy Transition in Germany
1980 Energiewende concept introduced
1990 Government-initiated 1000-Roofs PV Program 1991 Electricity Feed Act introduced
1997 The Kyoto Protocol adopted
1998 Electricity and gas markets liberalized
1999 Government-initiated 100,000-Roofs PV Program 2000 Renewable Energy Sources Act (EEG)
2004 Renewable energy sector employed 160,000 people
2011 Government phase out of nuclear by 2022 after Fukushima 2015 Paris Agreement signed
Table 1.8 Renewable Energy Consumption in Germany by Sector, 2003-2017
Solar Wind Geothermal, Biomass and Others Total 2003 0.1 4.2 2.0 6.3 2004 0.1 5.8 2.4 8.3 2005 0.3 6.2 3.2 9.7 2006 0.5 6.9 4.2 11.7 2007 0.7 9.0 5.5 15.2 2008 1.0 9.2 6.3 16.5 2009 1.5 8.7 6.9 17.2 2010 2.7 8.7 7.7 19.1 2011 4.4 11.3 8.4 24.1 2012 6.0 11.7 9.8 27.4 2013 7.0 11.9 10.3 29.3 2014 8.2 13.2 11.0 32.3 2015 8.8 18.2 11.4 38.4 2016 8.6 18.1 11.6 38.3 2017 9.0 24.1 11.7 44.8 Source: BP, 2018
The speed of the transitional is increasing in virtue of its experience and multi-directional development. There is a consensus that FIT mechanisms have made important contributions in stimulating and popularizing RE (Couture, 2010; El-Ashry, 2012; REN21, 2018). Germany has adequate economic power to promote FIT mechanisms and to subsidize R&D
20 and other facilities. Germany is a powerful economic country. It has the fourth largest economy in the world, and its economic indicators are strong. In 2018, Germany’s budget surplus was about €58 billion (DW, 2019). In this transition period, they set realistic targets and followed them unambiguously. Also the role of Green Party is undeniable. It started a movement, acted as a legislator, and tried to change policies after entering the parliament (Hake et al, 2015; Hager, 2015). Most RE experts agree that climate change and nuclear disasters also had a big influence on the transitional process (Renn and Marshall, 2016; Hake et al, 2015, Jacobsson and Lauber, 2006; Hache, 2018). The decisive attitude of Germany towards renewable energy transitions, in short, should be model for other countries.
1.1.2. China
China is the world’s largest energy consumer. In 2017, its primary energy consumption was 3,132.2 Mtoe with an increase of 3.1%. This constituted nearly 25% of the world’s total consumption (BP, 2018). China’s energy demand and economic growth are interconnected. It has the world’s second largest economy with a growth rate that has averaged 6% over the last 30 years (IMF, 2017). It is following a rigorous strategy towards securing energy supplies and is consuming every type of energy source in order to maintain its economic growth. However, the Chinese energy market has been dominated by fossil fuels, mainly coal and oil, for a long time. China wanted to create a more diverse energy structure than its current coal-dominated one (Lin et al., 2013). Also, air pollution has been a serious problem that has shortened the life expectancy of people in northern China by about 5.5 years (Chen et al., 2013). Air quality is thus a major driver of China’s transition, as the overconsumption of fossil fuels has caused a large amount of CO2 emissions. China’s fossil
fuel-related CO2 emissions reached 9,232.6 million tons, accounting for 26.6% of global
emissions (BP, 2018). In order to reduce its CO2 emissions, China made commitments at
the UN Climate Conference in 2015. The 2030 target is to increase the share of renewables to 20% and decrease emissions by 60% (IEA, 2016).
Meanwhile, the share of electricity in China’s energy consumption is expected to grow. The IEA (2016) estimates that 40% of final energy consumption will be met by electricity, 60%
21 of which will be generated by RES in 2040. Since electricity generation from renewables will grow in importance, China is positioning itself for the future and has made huge investments in its electricity infrastructure.
China’s investments in renewables have made it one of the most successful transitional countries in terms of acceleration and capacity. According to the REN21 (2018) China ranks first in installed capacity and annual investment in most RES, including solar PV, wind, bioenergy, and hydropower (Table 1.9).
Table 1.9 Top 5 Countries in Annual Investment and Net Capacity Additions in 2017
Rank 1 2 3 4 5
Investment in renewable power and fuels (hydro over 50 MW not included)
China US Japan India Germany
Geothermal power capacity Indonesia Turkey Chile Iceland Honduras
Hydropower capacity China Brazil India Angola Turkey
Solar PV capacity China US India Japan Turkey
Wind power capacity China US Germany UK India
Solar water heating
Capacity China Turkey India Brazil US
Source: REN21, 2018
Renewable energy was considered a supplementary source, something to use when there was a shortage of conventional fuels in rural areas (Liu, 2019). The transition from fossil fuels to renewables became more popular, however, in recent decades. The main reasons were an increase in demand and the attractiveness of RE market, climate change and carbon emissions, and economic developments (Lahiani et al., 2017).
One of the main reasons for China’s renewable investments is climate change. The excessive consumption of low-efficiency fossil fuels, especially coals has created an ecological problem. In 2017, China becomes the world’s largest carbon emitter. Its use of coal is responsible for 13% of global annual emissions (He et al., 2017). The most important target of previous Chinese five-year plans was increasing coal, petroleum and electric power usage (Lanfang and Wei, 2012). After China became a member of the UNFCCC and Kyoto Protocol, it took major steps towards creating a lower carbon energy system. It committed to decrease emissions by 60% and increase the share of renewables to
22 20% by 2030 (IEA, 2016). It also attached these targets to its five-year plans in order to demonstrate its determination (Lanfang and Wei, 2012).
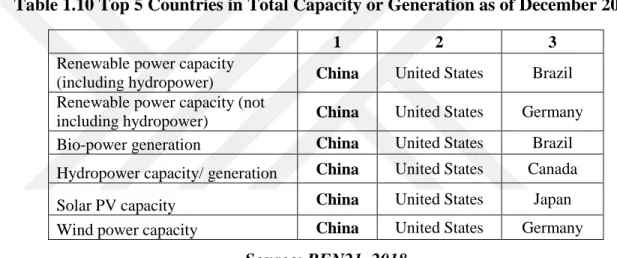
China is making investments in both fossil fuels and renewables. Its total energy supply investments share increased to 20% as a consequence of spending on electricity infrastructure and coal power in 2015 (IRENA, 2017). Generally, these investments focused on capacity expansion, energy infrastructure, and system integration (He et al., 2017). With governmental support, China became the world leader in terms of installed capacity and generation (Table 1.10).
Table 1.10 Top 5 Countries in Total Capacity or Generation as of December 2017
1 2 3
Renewable power capacity
(including hydropower) China United States Brazil Renewable power capacity (not
including hydropower) China United States Germany Bio-power generation China United States Brazil Hydropower capacity/ generation China United States Canada Solar PV capacity China United States Japan Wind power capacity China United States Germany
Source: REN21, 2018
Conventional energy development was the primary goal of Chinese energy policy from 1949 to 1992 (Lanfang and Wei, 2012). China started to implement renewable energy into its energy system in the 2000s. It enacted the Renewable Energy Law (REL) in 2006 and revised it in 2009 (IEA, 2017b). Before REL, feed-in tariffs prices were determined by negotiation and were thus different every time. However, this arrangement caused some price speculations, which were harmful in the long run (Jiang, 2017). Renewable energy generators were signing FIT agreements with the state grid. Details for wind power FITs were determined by the REL and prices by the government, which differed from province to province (Jiang, 2017). The premium for wind was CNY0.51-0.61/kWh ($0.075-0.090/ kWh) in 2009 and planned to fall by 4.9%-13.7% by 2018 (Yang et al., 2016). In 2016, the government revised the wind tariffs and divided them into four classes; CNY 0.4/kWh, CNY0.45/kWh, CNY0.49/kWh and CNY0.57/kWh. For solar power it was CNY0.65/kWh,
23 CNY0.75/kWh, and CNY0.85/kWh plus fixed CNY0.42/kWh (Jiang, 2017). Figure 1.5 shows the latest tariffs for different regions (Yang et al, 2016). In addition to price premiums, the government paid the initial investment in small scale-off grid solar PV systems (IEA, 2017a). After the promulgation of the REL with the FIT, installations of RES including wind and solar peaked (Zhang, 2006). Renewable electricity became more competitive with the governmental-support mechanisms (Yang et al., 2016). Electricity generated from wind rose from 1.3 TWh in 2004 to 13.1 TWh in 2008, nearly ten-fold growth in four years (BP, 2018).
Figure 1.5 Feed-in Tariffs for Solar and Wind in China
Source: Yang et al., 2016
In 2014, the state council announced the Strategic Action Plan for Energy Development (2014-2020). Future coal consumption was limited to 4.2 billion tons in order to reduce the share of coal in primary consumption (IEA, 2015). The plan also targeted to reach a total capacity 100 GW in solar PV, 200 GW in wind, and 350 GW in hydropower by 2020 (Lin et al, 2015). According to the IRENA (2019), China, as of 2018, had 175,032 MW of total solar PV installed capacity, 184,696 MW of wind, and 352,261 MW of hydropower.
Of these, the greatest potential lies in hydropower. It is estimated that China has 694 GW of theoretical hydropower potential, which is 16% of the world’s total (Huang and Yan, 2009). China’s renewable investments mainly focused on hydropower because of its enormous
24 potential (Huang, 2009). China has ranked first in installed capacity for hydropower for many years, accounting for nearly 25% of the global total (IRENA, 2019a).
Renewable energy policies were initiated for the purpose of developing rural energy structures (Lanfang and Wei, 2012). The renewable energy policies between 1990 and 2005 were generally designed to combat air pollution (Liu, 2019). As such, the government announced the Air Pollution Action Plan in 2013, which sought to reduce air pollution by constraining future coal consumption (Lin et al, 2013).
In 2007, the National Development and Reform Commission (NDRC) of China announced its medium and long-term development plan for renewable energy. The target was to increase the share of renewables in total energy consumption to 15% by 2020 with the help of substantial investment and invest on R&D in order to manufacture domestically (IEA, 2017; Jiang, 2017). Table 1.11 shows the renewable energy targets of China.
Table 1.11 Renewable Energy Targets of China
2005 2010 2020
RE share in energy consumption 7.20% 10% 16%
Annual RE consumption 112 Mtoe 189 Mtoe 371 Mtoe
RE share in power generation
(hydro excluded) - 1% 3%
Hydropower installed capacity 117 GW 180 GW 300 GW
Wind power installed capacity 1.26 GW 5 GW 30 GW
Biomass power installed capacity 2 GW 5.5 GW 30 GW
Solar PV installed capacity 70 MW 300 MW 1.8 GW
Source: IEA, 2017b; Jiang, 2017
Financial investments played an important role in China’s renewable energy integration. According to the REN21 (2018), China alone accounted for 45% of renewable investments globally followed by Europe (15%) and the US (14%) in 2017. Solar and wind markets benefitted from these investments.
China is also the leader in renewable energy technology. According to Forbes (2019), over 150,000 renewable energy patents, 29% of the global total, belonged to China as of 2016. There is a tremendous increase in the number of patents in since 2000s. According to IRENA (2018), number of total RE patents increased from 883 to 168,028 within 16 years.
25 Chinese government has promoted the domestic production and gave special attention to create competitive manufacturing. Supportive mechanisms such as tax incentives and loans with low interest rate were included into five year plans. In 2008, the government has started to grants special funds for RE manufacturers for domestic production (Kennedy, 2013). With the help of these supportive policies China became the global manufacturer leader since 2011, especially in solar panels and wind power equipment, with competitive prices (Jiang, 2017).
These patents contributed significantly to the fall in renewable energy costs. IRENA (2017) indicates that PV module prices have fallen by 80% and wind turbines by 30%-40% since 2009. Also, the cost of electricity from solar PV decreased more than 60% from 2010 to 2016. The average of levelized cost of energy in solar PV has dropped to $0.08/kwh, nearly the same prices levels as fossil fuel-generated electricity (Yang et al, 2016). Electricity generation from coal fell by 28.4 TWh, while generation from solar PV increased by 15.1 TWh, wind by 29.7 TWh and hydro 141.5 TWh in 2014 (Line et al., 2015; BP, 2018). Chinese investments focused on small-scale asset financing (Jiang, 2017).
China dominates the global electric vehicle (EV) market. Howell et al. (2014) identified four main goals of China’s EV policy: reduce CO2 emission, secure its energy market,
become a sector leader, and decrease air pollution. Electric cars offered a solution to rising air pollution, particularly in cities, and the government started to invest in EVs in the 2010s. In order to accelerate the switch from conventional cars to EVs, China strongly promoted them through strong policies. Many cities adopted the one-car ownership policy. According to this policy people have 3 choices; 1) people wait 24 months to get a conventional car, 2) they pay extra premium to get one, 3) They immediately buy an electric car with a small amount of subsidy from government (Yang et al, 2017). After these legislations, the electric cars stock boosted from 480 to 1.227.770 with a share of 40% globally (IEA, 2018). Also, within a decade China become the biggest manufacturing power and largest EV market with the help of policy boost (Du et al,. 2019; IEA, 2018). Despite all these developments in renewable energy, fossil fuels still dominate in China (BP, 2018). Table 1.12 shows recent shifts in China’s primary energy sources; coal and oil remain the main sources of energy. However, coal consumption has decreased since 2013, after decades of rising.
26 Table 1.12 Primary Energy Sources of China by Fuel Type (Mtoe)
Oil Natural
Gas Coal
Nuclear energy
Hydro
electric Renewables Total 2016 587.2 180.1 1,889.1 48.3 261 81.7 3,047.2
Share 19.3% 5.9% 62.0% 1.6% 8.6% 2.7% 100%
2017 608.4 206.7 1,892.6 56.2 261.5 106.7 3,132.2
Share 19.4% 6.6% 60.4% 1.8% 8.3% 3.4% 100%
Source: BP, 2018
Supportive policies and financial investments nurtured the development of RE projects (Liu, 2019). The coal share still fluctuates; though renewables started to take share from the coal but coal will remain a dominant energy source until 2030 (Zhang et al., 2017). Nevertheless, China is continuing to invest in RES, and the growth of its renewable energy sector could contribute to the world (Birol and Oreljarnik, 2012; IEA, 2016; He et al., 2017)
27
2. THE RENEWABLE ENERGY TRANSITION IN TURKEY
This section will provide detailed information about the renewable energy transition in Turkey and will examine in detail Turkey’s renewable resource potentials, installed capacities and electricity market structure.
2.1 Overview of Turkey’s Energy Status
Turkey has the 18th largest economy in the world. It is a developing country with a
population of about 80 million. The economy has been growing at an average rate of 6.8% since 2008 (TÜİK, 2018). In order to maintain economic growth, energy consumption is imperative. Turkey relies on fossil fuels for 87% of its energy. At the same time, its net import dependency for fossil fuels is 77% (EIGM, 2018). On the other hand, renewable sources are abundant in Turkey; due to its geographical characteristics, there is adequate potential for solar, wind, hydro and geothermal energy (Ediger and Kentel, 1999; Balat, 2005; Özgür, 2008; Kırtay, 2010; Melikoğlu, 2017; Kılıçkaplan et al, 2017). Biomass potential is also ample to generate economical electricity (Toklu, 2017). Evrendilek and Ertekin (2003) estimated that Turkey has a total 495.4 TWh/year of potential energy with the 196.7 TWh/year of biomass, 124 TWh/year of hydropower, 102.3 TWh/year of solar, 50 TWh/year of wind, and 22.4 TWh/year of geothermal.
The government is incentivizing RE generation through FITs and tax exemptions. The FIT mechanism is vital, and the government is giving a 10-year purchase guarantee to the certificated RE producers. Table 2.1 shows the base price by energy types, while Table 2.2 shows the additional incentives that are added to the base price.
28 Table 2.1 Feed-in Tariff in Turkey
Energy type USD cent/ kWh Solar Energy 13.3
Biomass 13.3
Geothermal 10.5
Wind 7.3
Hydroelectric 7.3
Source: Official Gazette, 2011
Table 2.2 Technology-Based FIT and Domestic Content Extra by Source in Turkey
Domestic Production Domestic content
extra $ cent/kWh
Hydroenergy Turbine 1.3
Generator and Power Electronic 1
Wind Energy
Wing 0.8
Generator and Power Electronic 0.1
Turbine Tower 0.6
Rotor Mechanic Parts 1.3
Solar PV Pv Panel Integration 0.8 Pv Modules 1.3 PV Cells 3.5 Inverter 0.6 PV focusing materials 0.5 Biomass
Fluid-bed steam generator 0.8
Liquid or gas steam generator 0.4
Gasification and Gas Cleaning Group 0.6
Steam and Gas Turbine 2
Internal Combustion Engine or Stirling Motor 0.9
Generator and Power Electronic 0.5
Cogeneration system 0.4
Geothermal
Steam and Gas Turbine 1.3
Generator and Power Electronic 0.7
Steam injector or vacuum compressor 0.7
29 2.2 Electricity Market Structure
The first electricity in Turkey was generated from a 2-KW water mill hydro plant in Mersin in the late Ottoman era. Electricity became very popular and spread quickly all over the country (Yılmaz, 2012). Supplying, transmitting, and distributing electricity was the responsibility of local municipalities from the foundation of the Turkish Republic until 1970, when the government founded the Turkish Electricity Institution (TEK), which thereafter assumed municipalities’ responsibilities. This system continued until 1984, when the government created more horizontal integration. The electricity market was essentially a monopoly because Turkey was not economically stable enough to attract substantial private investment. The government also wanted to control the market because of energy-supply security concerns. Thereafter, the government slowly started to privatize the market, following global trends. In 1993, the TEK was divided into the Turkish Generation and Transmission Corporation (TEAŞ) and the Turkish Electricity Distribution Company (TEDAŞ). Figure 2.1 shows the further division of government entities over time.
Figure 2.1: Divisions of Turkish Government Entities Regulating the Electricity Market
Source: Taşdöven et al., 2012
In 2003, the TEAŞ was divided into the Electricity Generation Company (EÜAŞ), the Turkish Electricity Trade and Contracting Corporation (TETAŞ), and the Turkish Electricity Transmission Company (TEİAŞ). Today, the EÜAŞ has authority over the Turkey’s electricity generation, the TEİAŞ oversees the electricity transmission across the country and the TETAŞ deals with the wholesale electricity trade. The TEDAŞ was also